CBL PROPERTIES Investor Presentation | March 2023
←
→
Page content transcription
If your browser does not render page correctly, please read the page content below
Investor Presentation | March 2023

CBL PROPERTIES

Introduction to CBL
                   We own and manage a diverse national portfolio of market-dominant malls, lifestyle centers, outlet
                              centers, and open-air centers in dynamic and growing mid-tier markets

                       $734M                                                  $2.67B                                                        $6.16                                        $429M
                     12/31/22 Equity Market                                 Total Pro Rata Share of                                Midpoint 2023 per share FFO,                         Midpoint 2023 SC NOI
                         Capitalization                                             Debt (1)                                         as adjusted, guidance (2)                               guidance (2)

                        5.76%                                                  $276M                                                          6.2X                                         $1.50
                 WA Interest Rate at 12/31/22                                    12/31/22 Cash (3)                                      Net Debt/EBITDAre (4)                      Per Share Annualized Dividend   (5)

(1)   Net of $70.4mm of debt related to Excluded properties.
(2)   Midpoint of FFO, as adjusted, per share and SC NOI Guidance provided on February 21, 2023, which has not been and should not be deemed to have been updated or reaffirmed.
(3)   Represents 12/31/2022 cash balance net of $70mm special dividend payment in January 2023.
(4)   Reflects Net Debt / Adjusted EBITDAre for the year ended 12/31/2022. Cash balance pro forma for $70mm special dividend payment in January 2023.
(5)   Reflects current annualized dividend of $1.50 per share ($0.375 quarterly). Actual dividends paid, if any, will be determined by CBL’s Board of Directors.                                                         2
DOMINANT ASSETS IN DYNAMIC MARKETS

More than malls…

                                     • ~29% of NOI from Non-Mall Properties
Our Portfolio
                                     • ~71% of NOI from stable enclosed malls
94 Properties                               Open
                                                              Outparcels              Other
                                                                 4%                    1%
                                          Air/Power
46 Malls                                   Centers
                                             12%

29 Open-Air Centers                           Life Style
                                               Centers
                                                 8%
5 Outlet Centers
                                        Outlet Centers
                                             4%
5 Lifestyle Centers
5 Office/Hotel                                                                                       Malls
                                                                                                     71%

4 Managed for 3rd parties
                                        2022 Same-Center NOI. Does not reflect Excluded Properties

                                                                                                             3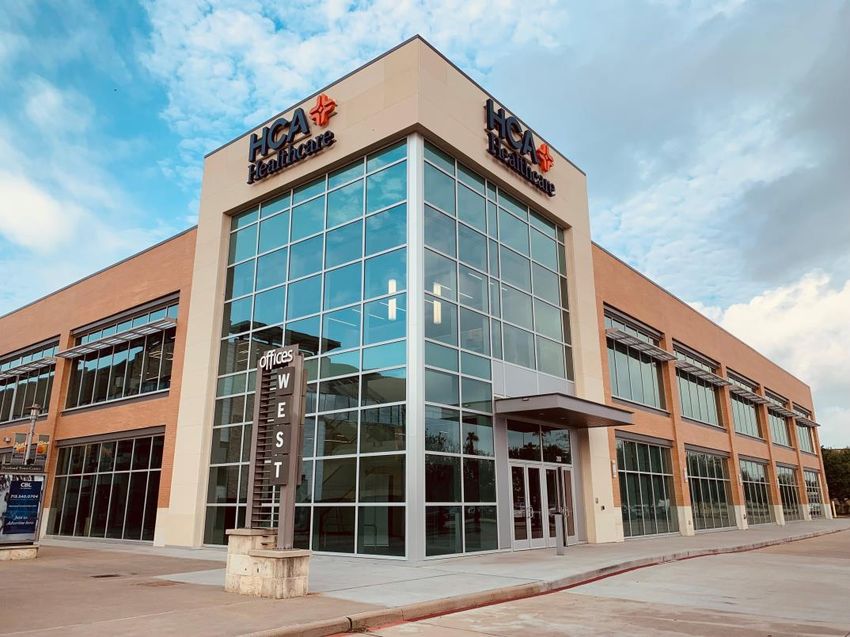
Q4 ‘22 updates

SC NOI Increased to ~$443M

2022 tenant sales of $435 PSF

Portfolio occupancy +170 bps YOY to 91% as of YE

Completed more than $1.1 billion in financing activity in 2022

50% increase in regular cash dividend to $1.50 annualized

                                                                 4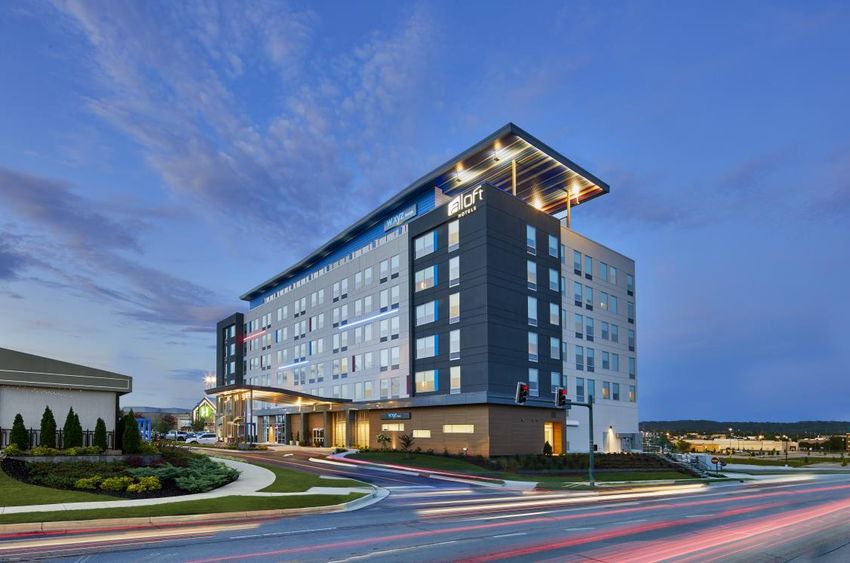
CBL Value Proposition
   1
          Significant
                                             ▪ $131mm of stable estimated cash flows before principal amortization
          Cash Flow                            provides 18% cash flow yield (1)
          Generation
                                                                                                                                                                                                                 18%
   2                                                                                                                                                                                                     Cash Flow Yield (1)
         Commitment                              Debt Amortization                 ▪ $80 million annual principal amortization
        to Maximizing
           Returns                               Regular Dividends                 ▪ $48 million annually (an increase of 50% over prior year)
          Capital to
        Shareholders                              Special Dividend                 ▪ Special one-time dividend of $70 million paid in January 2023
                                                                                                                                                                                                             $6.00+
                                                                                                                                                                                                         Per Share Capital
   3        In-Place                         ▪ Non-recourse debt with low leverage of 6.2x (2) provides financial flexibility                                                                             Return to Equity
             Capital                                                                                                                                                                                        Investors (3)
                                             ▪ Blended interest cost of 5.76% is accretive to shareholder cash flows
            Structure

   4                                         ▪ With a well positioned balance sheet and significant liquidity, CBL trades
            Valuation
                                               at a significant discount to estimated net asset value using highly
             Upside                            conservative estimates
                                                                                                                                                                                                             ~$8.30
                                                                                                                                                                                                          Per Share Cash
   5                                                                                                                                                                                                        Balance (4)
         Investment                          ▪ Selectively evaluate (re)development, acquisitions, and strategic opportunities
        Opportunities                        ▪ We are committed to a disciplined approach to capital allocation

(1) Based on 12/30/2022 share price of $23.08. CBL Cash flow yield based on midpoint of $131mm of cash flow before amortization.
(2) Reflects Net Debt / Adjusted EBITDAre for the year ended 12/31/2022. Cash balance net of $70mm special dividend payment in January 2023.
(3) Includes regular dividend announced for March 2023 annualized at $48mm, one-time special dividend of $70mm paid in January 2023, and midpoint of 2023 debt amortization assumption of $80mm.
(4) Represents 12/31/2022 cash balance net of $70mm special dividend payment in January 2023.
Figures above based on midpoint of guidance, dividend and capital item (Capex, TA, Amortization) assumptions issued on February 21, 2023, which has not been and should not be deemed to have been updated or reaffirmed.      5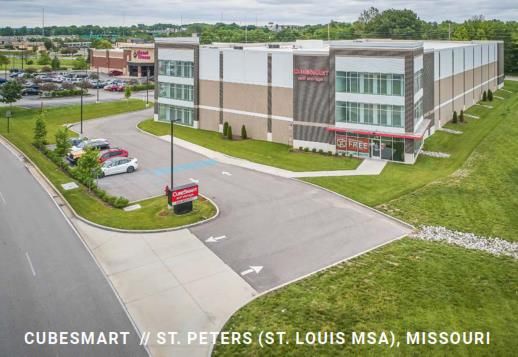
Discretionary cash flow
      1

                                                                                                Illustrative 2023 at Midpoint of 2/21/23                              • Significant amortization of loans
                                                                                                               Guidance (1)                                             secured by high quality properties
                                                                                                                                                                        accrues to equity.
                   2023 SC NOI                                                                                        $429 million

                   2023 FFO, as adjusted                                                                              $198 million                                    • Amortization provides potential lever
                                                                                                                                                                        point to improve future cash flows
                   Less: Est. Capex/TA                                                                                 $48 million                                      available for shareholders.
                   Less: Revenue Generating
                                                                                                                       $19 million                                    • Significant recurring cash flow
                   Redevelopment
                                                                                                                                                                        available for return to
                   Cash Flow before Amortization                                                                     $131 million                                       shareholders/investment:
                                                                                                                                                                           • Regular/Special Dividends
                   Less: Amortization (property/term loan)                                                             $80 million                                         • Acquisitions – one-off and
                   Discretionary Cash Flow                                                                             $51 million                                            portfolio
                                                                                                                                                                           • Additional value-added
                                                                                                                                                                              redevelopment
                   Cash at 12/31/22                                                                                   $337 million                                         • Strategic capital markets
                                                                                                                                                                              activity
                   Pro Forma Cash (net of Special Dividend paid January 2023)                                         $267 million

(1)   For illustrative purposes only. Actual results could vary materially. Based on midpoint of guidance and capital item (Capex, TA, Amortization) assumptions issued on February 21, 2023, which has not been and should
      not be deemed to have been updated or reaffirmed.                                                                                                                                                                       6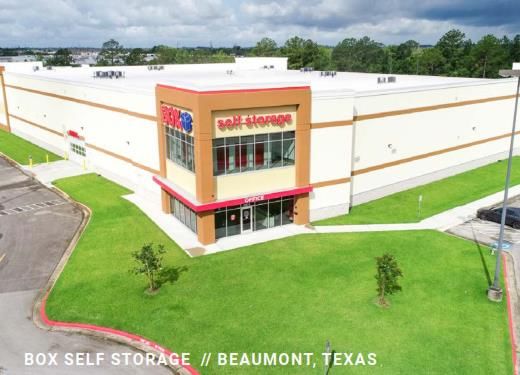
1        Significant Cash Flow Generation
                           CBL offers a compelling relative valuation to both retail peers and other investment alternatives

                                                                     CBL Yields at Various Prices                                                            Major Sector Averages
                                                           $25.00         $27.50         $30.00          $32.50         $35.00            Mall        Open Air        Office          MF         Industrial       Hotel

                            2023E
                           FFO Yield

                            2023E
                          Cash Flow
                            Yield

    Source: Green Street Advisors as of 12/31/2022. CBL FFO Yield based on 2023 midpoint guidance of FFO, as adjusted, of $5.85 - $6.47 per share provided on February 21, 2023, which has not been and should not be deemed to
    have been updated or reaffirmed. CBL Cash flow yield based on midpoint of $131mm of cash flow before amortization. Major sector averages represent simple averages of AFFO yield for Green Street’s coverage universe with the
    exception of office which excludes EQC.                                                                                                                                                                                          7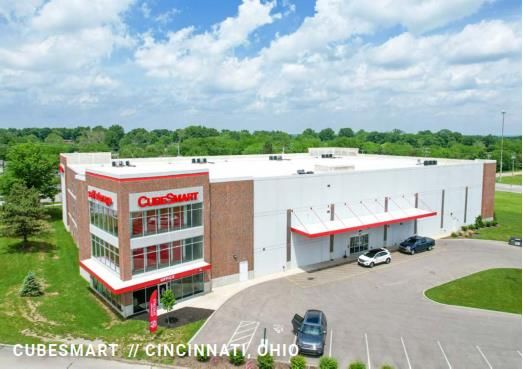
2        Ability and Commitment to Maximizing Returns to Shareholders

                                                                                                                             ✓
                                                                                                                                                              Significant Recurring Cash Flow with
            $198mm 2023 FFO, as adjusted, at Midpoint
                                                                                                                                                                 27% FFO, as adjusted, Yield(1)

                                                                                                                             ✓
             Approximately $48mm 2023 Capex / TA and                                                                                                                 Ongoing Focus on Disciplined
                $19mm Redevelopment at Midpoint                                                                                                                           Capital Spending

            $131mm Est. Cash Flow Before Amortization
                                                                                                                             ✓                                   Represents 18% Cash Flow Yield(1)

                                                                                                                                                      Amortization Inures to Shareholders’ Benefit:
              $80mm Est. 2023 Amortization at Midpoint
                                                                                                                             ✓                              up to ~$2.50 per Share Annually

             $267mm Cash Balance(2) / $8.30 per Share
                                                                                                                             ✓                                        Source for Cash Distributions

                       We are committed to maximizing returns to shareholders while maintaining balance sheet flexibility

    (1) Based on 12/30/2022 share price of $23.08.
    (2) Represents 12/31/22 cash balance net of $70mm special dividend paid in January 2023.
    Note: All guidance figures shown at midpoint of range provided on February 21, 2023, which has not been and should not be deemed to have been updated or reaffirmed.                              8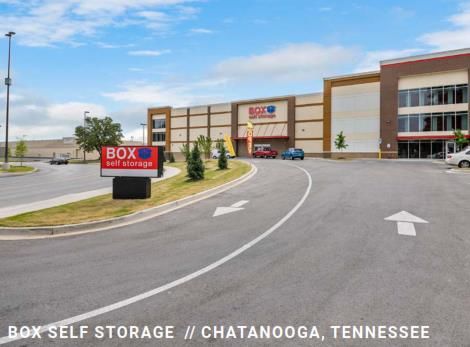
3       CBL Capital Structure Provides Value Drivers Beyond NAV Approach

                                                                                            Low Levered, Flexible Balance Sheet
                                 ✓                                                              $73mm of Unencumbered 2022 NOI
                                                                                          $267mm of Cash (1) Provides Balance Sheet Flexibility

                                 ✓                                                              98% Non-Recourse Property Debt
                                                                                                Limits Capital Outlays for Upcoming Maturities

                                 ✓                                                                                Below Market Debt
                                                                                              Weighted Average Interest Cost of Debt of 5.76%

                                 ✓                                      Low Debt Yield CMBS Loans Generate Free Cash Flow
                                                                                      and Future Option Value

    (1) Represents 12/31/2022 cash balance net of $70mm special dividend payment in January 2023.
    Note: All guidance figures shown at midpoint of range provided on February 21, 2023, which has not been and should not be deemed to have been updated or reaffirmed.
                                                                                                                                                                           9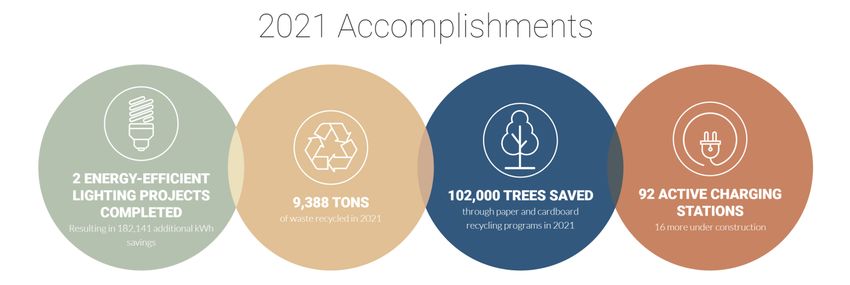
3              Flexible balance sheet with clear
                  path to further optimization
                  $5,000

                  $4,500
                                             $4,364
                  $4,000                                                                                                               ~$1.6 billion in recent
                                                  $1,375                                                                              debt reduction and $626
                  $3,500                                                                                                                                                                             Over 98% of property
                                                                                                                                          million preferred
                                                                                                                                                                                                     level loans are non-
                  $3,000                                                                     $2,674              (1)                      elimination with
                                                                                                                                                                                                           recourse.
                  $2,500
                                                                                                                                      additional deleveraging
                                                  $1,115
                                                                                                   $829                                      underway.
                  $2,000

                  $1,500
                                                                                                                                                                                                   Non-recourse property
                  $1,000                          $1,668                                          $1,813                                                                                          loans with low debt yield
                     $500                                                                                                               Limited recourse term                                      provide opportunity for
                                                   $206
                                                                                                                                           loan ($141M(2)).                                          creative restructure
                        $0                                                                        $30                                                                                               and/or additional NAV
                                                9/30/2021                                      12/31/2022
                                                                                                                                                                                                          accretion
                         Recourse Property Level Debt                       Non-Recourse Property Level Debt
                         Secured Credit Facility/Term Loan                  Notes

CBL’s pro rata share of debt, in millions. Balance before unamortized debt discount.
(1) Excludes $70.4M of debt related to Excluded properties that are in the process of conveyance to the lender.
(2) As of December 31, 2022, the Senior Secured Term Loan had a limited guaranty of up to a maximum of $141 million. If, at the earlier of the term loan balance equal to or less than $650 mm or any time after 11/1/23, the debt yield is
    greater than 15%, the limited recourse guaranty is terminated.
                                                                                                                                                                                                                                              10
Status: property loan maturities
3
Maturity Interest Rate 12/31/22 Balance Action
West County Center December - 22 3.40% $80.9 Extension/Modification in process
Cross Creek Mall Jan - 23 4.54% 97.4 2-year extension/modification in process
Friendly Center April - 23 3.48% 42.9 Refinancing in-process
Shops at Friendly Center April - 23 3.34% 30.0 Refinancing in-process
The Outlet Shoppes at
April – 23 9.12% 7.4 Anticipate refi or payoff
Bluegrass
The Outlet Shoppes at ATL Nov – 23 4.90% 33.3 Anticipate refinancing
The Outlet Shoppes at ATL
Nov - 23 6.62% 4.4 Anticipate refinancing
–Phase II
Total/WA 4.1% $296.3
114 Illustrative Net Asset Value
Current discount to estimated Net Asset Value (1) provides significant upside opportunity
Illustrative Illustrative Illustrative
Valuation: Conservative cap rates 2022 Cap Rate Range Asset Value 12/31/2022 Equity Value
(3)
applied to 2022 NOI produce an $ in millions except per share values NOI High Low at Midpoint Debt at Midpoint
illustrative net asset value of more than
Term Loan Assets - Holdco I
$35 per share.
Malls 115 17.50% 12.50% $789
Non-Recourse Debt: Non-recourse debt Lifestyle Centers 23 12.00% 10.00% 208
provides optionality and limits future cash Open-Air Centers 4 9.00% 8.00% 47
outlays for low debt yield maturing debt.
Total Term Loan Assets - Holdco I $142 $1,044 ($829) $214
Fair Value of Debt: Weighted average All Other Assets
interest rate of 5.76% represents
Malls 198 17.50% 12.50% $1,358
attractive in-place debt financing. NAV
excludes debt mark to market impact Outlet & Lifestyle Centers 33 12.00% 10.00% 298
given limited pricing transparency which Open-Air, Outparcels & Other 71 9.00% 8.00% 840
provides further upside. Total All Other Assets $302 $2,496 ($1,844) $651
Pro Forma Cash (2) 267 -- 267
Illustrative Net Asset Value $443 $3,806 ($2,674) $1,133
Shares Outstanding 31.82
Illustrative NAV per Share at Midpoint $35.59
(1) Based on 12/30/2022 share price of $23.08.
(2) Represents 12/31/2022 cash balance less $70mm special dividend payment in January 2023.
(3) Represents 12/31/2022 pro rata share of debt, excluding $70.4mm of debt related to Excluded Properties.
Note: 2022 NOI for Same-Center properties. NAV for illustrative purposes only. Actual results may differ materially. 125 CBL is Well Positioned to Capitalize on Attractive Investment Opportunities
Investment opportunities must be compelling and meet return requirements and/or provide strategic benefits
Redevelopment Development
▪ Anchor transformations to energize centers and ▪ Focus on creating value with attractive returns by
add more relevant concepts utilizing intrinsic land value and joint ventures
▪ Nearly three dozen anchor replacements since ▪ Diversify revenue through development of non-
2017 - majority with little to no capital outlay retail uses: multifamily, hotel, self-storage, medical
office, etc.
Select Acquisitions Strategic Opportunities
▪ Selectively underwriting acquisition opportunities ▪ Continue to evaluate opportunities to enhance value
given volatility in capital markets
▪ CBL is well positioned relative to peers to use its
▪ Focused on upgrading portfolio quality, balance sheet, liquidity, operating platform and
redevelopment and diversification opportunities scale to roll-up and integrate portfolios / platforms
135 INVESTMENT OPPORTUNITIES
JV partnerships
Hamilton Place: Significant value created utilizing
Ground-up 147-key ALOFT Hotel intrinsic land value and limited cash:
CBL JV developed a 147-key ALOFT Hotel on a parcel created from a
former Sears parking lot adjacent to Hamilton Place Mall in Chattanooga,
TN
CBL: 50% Share of Cost: $12.0M CBL Equity: $3.5 million
Share of Loan: $8.4M Project Yield: 9.2%
1. MINIMAL CASH INVESTMENT:
• $1.2 Million Cash Investment
2. MONETIZATION OF EXISTING LAND:
• $2.2 Million Imputed Land Value (Non-Cash)
3. CREATING VALUE:
• Estimated share of Stabilized Value at 6.5 – 7% Cap Rate(1): $16-
$17M
(1) For illustrative purposes only. Not an indication or estimate of actual value.
145 INVESTMENT OPPORTUNITIES
JV monetization
Project Overview JV Storage Portfolio Sale
Four self-storage facilities developed in joint venture HEADLINE
partnerships on available pads at CBL properties.
dkfjsdklfjdslkfjdslkfjsdlkfjsd
lkfjsdlfkjsdflksdjflksdjfklsdjf
1. MINIMAL CASH INVESTED ew0rifopdjfopjdsfjdsl;mdslf
jdslkfmdslkfjdslkfjdslfjdslfj
• CBL Invested $234k in cash dslkfjdlsfjsdlkfjklsdmvmop
• CBL contributed land ($2.9M basis) at imputed dmvpkas;lfk;skdl;.
equity value
Kdlsjfhklsadfjnklsdfjklsdfnl
kdsfnsdkfnsdo;vnsdoivnmd
osino0[fjdlksml.
2. SIGNIFICANT VALUE CREATED
• Portfolio sold for $42M ($22M at CBL’s share)
• CBL’s Share of Proceeds: $8.5M
155 INVESTMENT OPPORTUNITIES
Non-retail densification
Pearland Town Center:
Ground-Up HCA Medical Project Overview
Vacant parcel at Pearland Town Center in Houston, TX, transformed into 48,000
square-foot state-of-the-art training center, HCA Healthcare Center for Clinical
Advancement:
CBL Ownership: 100% Share of Cost: $14.2M Project Yield: 11.8%
1. DIVERSIFICATION
• Addition of HCA Offices, add new healthcare/office component to Pearland’s
mixed-use campus
2. DENSIFYING
• HCA training facility adds significant new daytime traffic to Pearland Town
Center. The facility serves the healthcare system’s nearly 7,000 healthcare
personnel.
3. CREATING VALUE
• CBL’s Share of Stabilized Value at Illustrative 6-6.5% Cap Rate: $26 - 28M
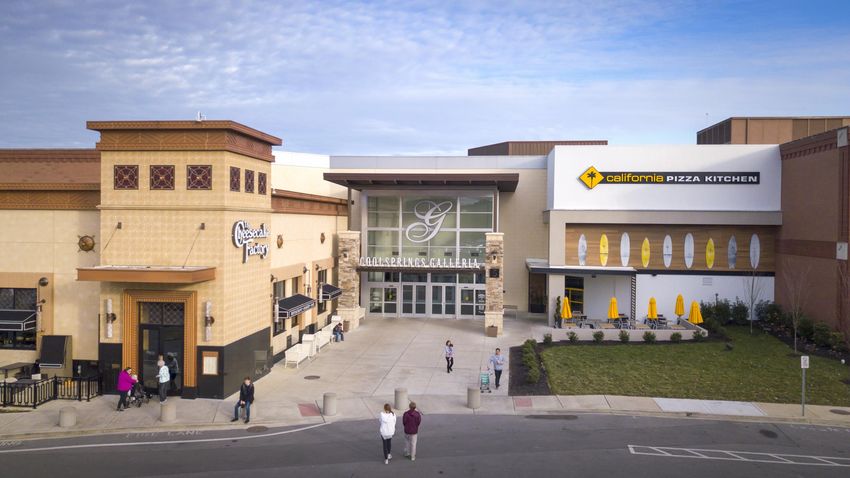
165 INVESTMENT OPPORTUNITIES
Anchor transformation
Kirkwood Mall, Bismarck, ND
New pads constructed in former anchor parking lot,
creating high-quality, stable rent stream and future
monetization opportunity:
Pad Developments:
Blaze Pizza May-22
Chick-Fil-A(GL) Dec-21
Five Guys May-22
Thrifty White Jun-22
Panchero’s May-22
Net Cost: $7.9M
Pro Forma Return: 8.9%
Current single tenant cap rates: mid-single digits
17Anchor transformations
5
Nearly three dozen anchor replacements since 2017 - majority effected
with little to no capital outlay by CBL:
Property Former Anchor Replacement Status Property Former Anchor Replacement Status
Layton Hills Macy’s (Dillard’s)Dillard’s Open* York Galleria Sears Hollywood Casino Open*
Jefferson Mall Macy Round1 Open Westmoreland Mall BonTon Stadium Live! Casino Open*
Northwoods Mall Sears (Seritage) Burlington Open* Richland Mall Sears (Dillard’s) Dillard’s Open*
Kentucky Oaks Mall Sears (Seritage) Burlington, Ross Dress for Less Open* Sunrise Mall Sears (Elm Creek) TruFit; Main Event Open*
West Towne Sears (Seritage) Dave & Busters, Total Wine Open* Frontier Mall Sears (Jax) Jax Outdoor Gear Open*
Dick Sporting Goods, Five Stroud Mall Sears EFO Furniture Outlet Open*
Parkdale Mall Macy Open Ross Dress for
Below, HomeGoods Dakota Square Herberger Open
Less/Five Below OFS
Brookfield Square Sears Marcus Theaters, Whirlyball Open
Jefferson Mall Sears Overstock Open*
Brookfield Square Sears Excess Land (City) Hotel/Convention Center Open*
Kirkwood Mall BonTon Restaurants Open
Laurel Park Place Carson’s Dunham Sports Open
York Galleria BonTon (LifeStorage) LifeStorage Open
Meridian Mall Younkers High Caliber Karts Open*
Hanes Mall Sears (Novant) Novant Health Construction TBD *
Hanes Mall Macy’s (Truliant) Truliant Open*
Dakota Square Sears (Scheel’s) Scheel’s Open*
Post Oak Mall Sears (Elm Creek) Conn’s HomePlus Open* West Towne Mall Boston Von Maur Open
Stroud Mall Boston Shoprite Open* Harford Mall Sears (3rd Party) Grocer Under construction*
Kentucky Oaks Mall Elder Beerman HomeGoods, Five Below Open* Rooms To Go, Main
Dicks Sporting Goods, Dave & Cross Creek Mall Sears Open/2023*
Hamilton Place Sears Open Event EXE
Busters, ALOFT Hotel, office Jefferson Mall Sears Overstock Open*
Cherryvale Mall Sears Tilt Open* Murdoch’s Farm &
Post Oak Mall Sears (Elm Creek) TBD*
Cherryvale Mall BonTon Galleria Furniture Open* Ranch
*Denotes project with zero or minimal capital invested by CBL.
185 Redevelopments: recent and
underway
Total Cost Pro Forma Initial Opening Date
(net of reimbursements) Unleveraged Yield
Hamilton Place Aloft $12.0 9.2% Q2 ’21
Pearland HCA Medical $14.2 11.8% Q2 ’21
Cross Creek – Longhorn R2Go $2.8 10.1% Q4 ’21
Kirkwood Mall – Outparcel Development $8.0 8.9% Q2 ‘22
Dakota Square – Herberger’s Redevelopment (Five Below) $1.8 8.7% Q4 ’22
The Terrace – Nordstrom Rack (former Staples) $2.5 13.0% Q2 ‘23
York Town Center – Burlington (former BB&B) $1.2 18.5% Q2 ‘23
Mayfaire Town Center – Hotel Development (49% Interest) $15.3 11.0% Q2 ‘24
Total/WA $57.8 10.7%
($ in millions) 19Significant non-retail activity
highlights diversification
Entertainment:
Multi-Family: Hotel:
2 under construction/
1 under construction 1 out for signature/
2 out for signature/
1 executed
2 executed
Restaurants: Medical: Other Non-Retail:
2 out for signature/ 3 out for signature/ 3 out for signature/
13 executed 4 executed 8 executed
Represents activity underway. Represents deals in process as of February 2023. Actual results may differ materially. 202022 Operational Performance
Substantial improvements to occupancy and lease spreads. Average lease spread and SF of
executed leases trending above pre-pandemic levels.
96% 95.3% 94.8% 1.8%
94% 1.6%
Full Year Executed Leases
91.0% 1.4%
92% 1.2%
89.6% 89.3% 1.0%
90%
2022 2021 2020 2019
87.9% 0.8%
88% 0.6%
86% 0.4%
4.1M 3.2M 2.6M 3.8M
0.2%
84% 0.0% Total SF Leased
Total Malls, Total Open-Air
Total Portfolio
2.1M 1.8M 1.6M 2.1M
Lifestyle, Outlet Centers
Comp SF Leased
Occupancy as of
89.6% 95.3% 91.0%
12/31/2022
Avg. Portfolio
Occupancy as of
12/31/2021
87.9% 94.8% 89.3% Comp Lease (5.2)% (11.2)% (13.2)% (8.0)%
Spread
Variance 1.7% 0.5% 1.7%
21CBL’s ESG Commitment
22We Are:
• Maintaining strong and transparent corporate governance, including regular reviews
of best practices.
CBL’s • Implementing environmentally conscious practices in our operations and
development.
Commitment • Engaging in our communities and donating our time and resources to 501c3
organizations in markets across our portfolio.
to ESG: • Adopting socially conscious policies and procedures, including our human rights
commitment, fair labor practices, etc.
• Actively developing our workforce and providing comprehensive team-member
benefits and programs.
23CBL & Sustainability
• CBL's management and development teams have worked to identify ways to reduce our
environmental footprint by installing energy management systems across our portfolio,
utilizing energy-efficient lighting, and energy-efficient water fixtures.
24Advancing Inclusion & Belonging
• CBL has long valued an inclusive and welcoming environment for our team members and the communities we serve. We are committed to a
workplace free from discrimination and harassment, and we value the diverse perspectives, backgrounds, and experiences that we derive from our
team, our retailers, and our customers.
• CBL Community is a team-member led committee that works to broaden our inclusion efforts.
The goal of CBL Community is to
advance inclusion by: 2022 Goals:
• Offering development opportunities for CBL employees to learn Sign the Pledge for CEO Action for Diversity & Inclusion™
how to be consciously inclusive. Implement a DEI strategy and roadmap with the help of our
• Identifying strategic partnerships that can help diversify the inclusion partner, Hinton & Company
talent pipeline in commercial real estate. Implement unconscious bias training
• Partnering with like-minded organizations seeking to make an
impact through inclusion.
• Enhancing representation of historically underrepresented
groups on our marketing efforts and our supply chain.
25Safe Harbor Statement
While the information contained in this presentation is provided in good faith, neither CBL & Associates Properties Inc. (together with its subsidiaries and affiliates,
“CBL”, of the “Company”) nor any of its advisers, representatives, officers, agents or employees makes any representation, warranty or undertaking, express or implied,
with respect to this presentation and no responsibility or liability is accepted by any of them as to the accuracy, completeness or reasonableness of this presentation.
The information contained in this presentation is as of the date hereof, and CBL and any of its affiliates each expressly disclaim any obligation to update the information
herein presented or to correct any inaccuracies in this presentation that may become apparent. You should conduct your own investigation into any information
contained in this presentation.
The information included herein contains "forward-looking statements" within the meaning of section 27a of the securities act of 1933, as amended, and section 21e of
the securities exchange act of 1934. All statements, other than statements of historical facts, included or incorporated by reference in this presentation that address
ongoing or projected activities, events or trends that the company expects, believes, anticipates or assumes will or may occur in the future, including such matters as
future operating results, capital expenditures, development or redevelopment projects, distributions, financings or refinancings, acquisitions or dispositions (including
the timing, amount and nature thereof), tenant leasing, performance and results of operations, trends of the real estate industry or markets generally, and company
business strategies and other matters of such nature are forward-looking statements. Such statements are based on expectations, beliefs, anticipations or assumptions
which may not be realized and are inherently subject to risks and uncertainties, many of which cannot be predicted with accuracy and some of which might not even be
anticipated. Prospective investors are cautioned that any such statements or projections are not guarantees of future performance and that future events and actual
events, financial and otherwise, may differ materially from the events and results discussed in forward-looking statements or projections. The company has no
obligation, and makes no undertaking, to publicly update or revise any forward-looking statements or projections. The reader is directed to the company's various
filings with the securities and exchange commission, including without limitation the company's most recent earnings release and supplemental financial schedules filed
on form 8-k, the company's annual report on form 10-k and quarterly report on form 10-q and the "management's discussion and analysis of financial condition and
results of operations" included therein, for a discussion of such risks and uncertainties.
26You can also read