Climate risks & Net Zero - FIRM March 2021

Page created by Kyle Moreno
 
CONTINUE READING
Climate risks & Net Zero - FIRM March 2021
Climate risks & Net Zero
FIRM
March 2021
Climate risks & Net Zero - FIRM March 2021
PwC has been actively shaping the ESG agenda and
contributing with thought leadership and market-leading tools
   We are actively involved in standard setting (orange letters indicate PwC involvement)                                      We help orchestrating the regulatory agenda and support clients globally
    Umbrella reporting frameworks                   Detailed standards                   Umbrella enablers
                                                                                                                               UK: FCA is consulting on corporate                             Germany: BaFin published guidance
    Global reporting initiative (GRI)
                                                    Environment (E):                     •   Accounting for Sustainability     disclosure of climate risks and                                in December 2019 on how FS firms
                                                    CDSB, CDP, TCFD, Natural             •   Corporate Reporting Dialogue      is focusing on ‘greenwashing’;                                 should manage sustainability risks
                                                    Capital Protocol, Greenhouse
                                                    gas protocol, Science Based
                                                                                         •   EFRAG                             BoE plans to introduce climate
    Integrated Reporting Council (IRC)                                                                                         stress tests
                                                    Targets                              •   European Commission                                                                              Hong Kong: Securities & Futures
                                                    Social (S):                          •   Focus capital for the long term                                                                  Commission announced Strategic
    IASB – MD&A project                                                                  •   Impact Measurement Project                                                                       Framework for Green Finance in 2018
                                                    International organisation for                                             EU: EBA Sustainable Finance
                                                    standardisation (ISO26000),          •   NGFS (contributions)              Action Plan; EU taxonomies,
    Sustainability Accounting Standards Board       UN guiding principles framework      •   The Capitals Coalition            ECB Guide on management of                                     Singapore: MAS exploratory work to
    UN Global Compact Communication                 Governance (G):                      •   UN Sust. Development Goals        climate risks; various reporting                               incorporate climate-related stress
                                                    COSO Framework                       •   UNEP FI                           and disclosure requirements                                    scenarios
                                                                                         •   Value Balancing Alliance
    WEF International Business Compact                                                   •   World Business Council for
                                                                                             Sustainable Development
                                                                                                                               We have developed market-leading tools
                                                                                                                                                                        PwC's “Climate Excellence” tool for climate scenario
                                                                                                                                                                        analysis supports investors and companies in getting
   We shape global ESG discussions through Thought Leadership                                                                                                           their portfolios ready for the risks and opportunities of
                                                                                                                                                                        climate change.
                                        Our recent publications/projects include                                                                                        In this way, the potential for value enhancement, adequate
                                                                                                                                                                        risk management and communication with regulators and
                                        •   Advice and review: UNEP FI PSI work on climate risks in insurance
                                                                                                                                                                        stakeholders can be fully exploited.
                                        •   The growth opportunity of a century - onset of a paradigm shift in investment                                               Market Recognition:
                                                                                                                                                                        • Network for Greening the Financial System (NGFS)
                                        •   Sustainable Finance for Asset Managers – a revision to the non-financial                                                    • UNEP FI TCFD Pilot at insurers
                                            reporting and regulatory requirements based on the EU Green Deal                                                            • TCFD Knowledge Hub
                                                                                                                                                                        • UN PRI
                                        •   “Privatkundenstudie Sustainable Finance” – detailed survey of private customer
                                                                                                                                                                        • Standard and Poor’s
                                            expectations on ESG offerings and preferences, and growth opportunities
                                                                                                                                                                        • Kepler Chevreux
                                        •   Pathways to Paris (in collaboration with WWF): develop transformation tools for                                             • Green and Sustainable Finance Cluster Germany
                                            sectoral decarbonization in Germany and connect real economy with financial
                                            sector in Germany
Climate Risks & Net Zero                                                                                                                                                                                                      March 2021
PwC                                                                                                                                                                                                                                    2
Climate risks & Net Zero - FIRM March 2021
Agenda

1.    Why climate?
2.    Climate risks and Net Zero – what does it mean?
3.    Spotlight on climate risk
4.    Spotlight on Net Zero
5.    What does it mean for the risk function?

                                                        March 2021
PwC                                                              3
Climate risks & Net Zero - FIRM March 2021
Why climate?

                     March 2021
PwC                           4
Climate risks & Net Zero - FIRM March 2021
Even if we are limiting global warming, we will see tangible
changes in our world

                                                                                                                                              Legend

  Source: IPCC (2019) SR15 Summary for Policymakers, https://www.ipcc.ch/site/assets/uploads/sites/2/2019/05/SR15_SPM_version_report_LR.pdf

Climate Risks & Net Zero                                                                                                                               March 2021
PwC                                                                                                                                                             5
Climate risks & Net Zero - FIRM March 2021
Awareness is increasing that we will be facing
climate risks, no matter what we do

                                                   More Physical Risks
                                       01          If we do not contain climate change,
                                                   physical risks will materialize.

                                                    Floods and                   Extreme weather
                                       Drought    higher sea level     Heat           events          Wind

                                                   More Transition Risks
                                                   If we embark on a transition path, transition
                                      02           risks will materialize. An orderly transition
                                                   is preferred over an abrupt and disorderly
                                                   transition.

                                       Technological      Climate law and regulation      Market
Source: Global Carbon Project           innovation

Climate Risks & Net Zero                                                                           March 2021
PwC                                                                                                         6
Climate risks & Net Zero - FIRM March 2021
Net Zero is a pressing issue for society
                                              GOAL to make 1.5C possible:
                                              -> Net zero carbon emissions before
        Transition Pathways:
                                              2050, 50% reduction by 2030.
        PwC’s Low Carbon Economy Index 2019

                                              The Net Zero tidal wave (since 2019):

                                               -   >120 countries commit to net zero
                                                   by 2050,
                                               -   >450 net zero cities
                                               -   Ca. 300 net zero global
                                                   businesses (“Race to Zero”)
                                               -   WEF and WBCSD membership
                                                   requirement 1-2yrs
                                               -   Investors controlling $45Tr AUM
                                                   commit to net zero by 2050

                                              > quarter of global CO2 emissions and
                                              more than half of the global economy
                                              covered by net-zero commitments
Climate Risks & Net Zero                                                      March 2021
PwC                                                                                    7
Climate risks & Net Zero - FIRM March 2021
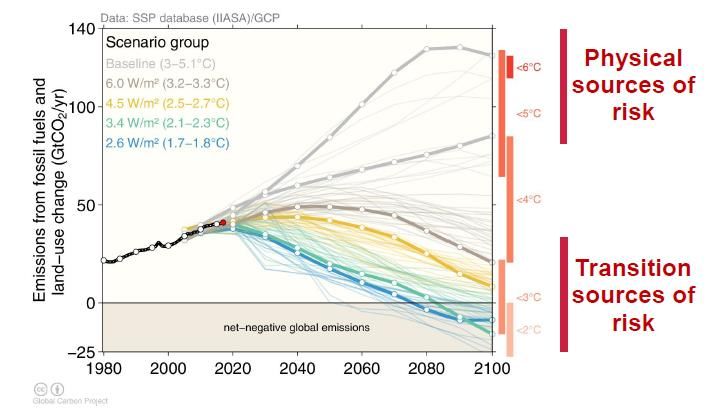
The finance sector is impacted by three significant climate-
related changes

              ESG assets perform better                              The market commits to disclosing                          The market commits to net zero
                                                                     climate risks and opportunities                           decarbonization

ESG leaders’ equity performed better during the Corona    Climate risks and opportunities have become part of the   Market participants are increasingly committing to
crisis compared to ESG laggards:                          market and regulatory conversation.                       decarbonize their portfolios to net zero emissions.
                                                                                         >1500 signatories
                                                                                         >$12 trillion market                                              30 signatories
                                                                                         capitalization                                                    >$9 trillion AuM
                                                          Source: TCFD Signatories website (December 2020)
                                                                                                                    Source: Net Zero Asset Manaegers Initiative Website (December 2020)

                                                                                                                                              33 signatories
                                                                                                                                              >$5 trillion AuM
                                                                                    >3000 signatories
                                                                                    >$103 trillion AuM              Source: UNEP FI Website (December 2020)

                                                          Source: PRI Signatories website (December 2020)
                                                                                                                                              >60 Financials taking action

Source: AXA (2020) Coronavirus: How ESG scores signaled
resilience in the Q1 market downturn, retrieved here.                                                               Source: SBTi Website (December 2020)
                                                                             If we don’t act …

               … we will lose market share, …                  … we will not fulfill investee expectations, …                … we will not fulfill our commitments.

Climate Risks & Net Zero                                                                                                                                                      March 2021
PwC                                                                                                                                                                                    8
Climate risks & Net Zero - FIRM March 2021
Case example: Climate risk heat maps focus attention
                                                                                                                                         MSCI world analysis
    Example: Portfolio
                                                                                                                               Unweighted        1.8°C Scenario
                    The MSCI World could risk losing 5% in profitability if                                                             Benefits
                    companies weren’t acting
                        MAINSTREAM: 2019 - 2030                                                                            •    Understanding financial
                                                                                                                                materiality of climate risks
Percentage annual change of EBITDA
:                                                                                                                               in portfolios and focusing
                                                                                                                                the attention going forward
                                                                                                                                as heatmaps highlight
                                                                                           Total MSCI World                     material sectors and
                                         Mining                                                                                 geographies
                                         -1.41%
                                                                                           cumulated growth (2019-2030):

                                                                                           + 3.4% in Mainstream            •    Identification of potential for
                                         Utilities                                                                              reweighting
                                         +3.86%                                            - 4.9% in Inaction
                                                                                                                           •    Key input into reporting

                                 EBITDA CHANGE as compound annual growth
                                   rate (CAGR) compared to previous period
                                  - 1%                                               +1%
Climate Risks & Net Zero                 Negative financial     Positive financial                                                                       March 2021
                                         impact of scenario   impact of scenario
PwC                                                                                                                                                               9
Climate risks & Net Zero - FIRM March 2021
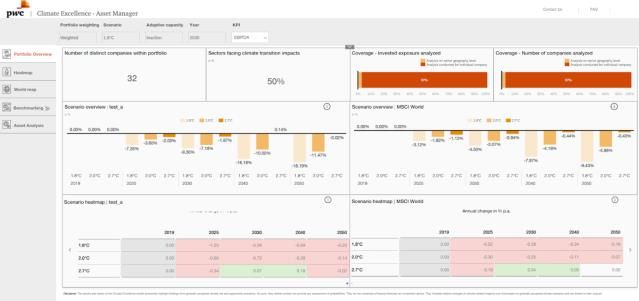
Stakeholders are taking a harder look at climate

                           US   Asia               Europe

Climate Risks & Net Zero                                    March 2021
PwC                                                                 10
Climate risks and Net Zero –
          what does it mean?

                                     March 2021
PwC                                          11
TCFD as SBT can conceptually interlock seamlessly with a
shared scenario basis: IEA below 2°C 1

      Task Force on Climate-Related Financial Disclosures                                                                                            Science-Based Targets Initiative (SBTi)

                          EUR                                                                                                                           CO2/t
                                                                                                                           Taxonomy
                                                                                            4°C
                                                                                                                                                                                   Paper Sector Curve
                                                                                            2°C                                                                                    (based on 2° IEA 1)
Extract Absolute Impact: Net zero does not equal no risk

Can a CO2 footprint be a good indicator for risks and opportunities?
                                                                                                                                      Comments

                                                                                                          •   Portfolio choice:
                                                                                                                •   Two test portfolios were built based on Europe’s top 20
                                                                                                                    utilities companies
                                                                                                                 • Test portfolio A chose those 3 out of those 20 companies
                                                                                                                    that showed the highest climate resilience in both
                                                                                                                    scenarios and with and without strategic adaptation
                                                                                                                    assumption (highest EBITDA change)
                                                                                                                 • Test portfolio B chose those 3 out of the 20 companies
                                                                                                                    that had the lowest CO2 footprint
                                                                                                          •   Result: A is a lot more resilient, while growth could be similar
                                                                                                              in the best case for both, B could experience -0,9% EBITDA
                                                                                                              change p.a. – average change in A lies at +0,8% p.a. and at
                                                                                                              +0,2% for B
                                                                                                          •   Rationale: companies in A show a diversified technology
             Best, average and worst annual earnings performance (EBITDA)
                                                                                                              portfolio and are globally diversified. Companies in B are
             of the two test portfolios A and B over the period 2020 to 2050                                  rather focusing on Europe and mostly have RE, nuclear in their
             based on a 1.8°C and a 2.7°C climate scenario respectively with                                  mix.
             and without strategic adaptation of the companies.

   Source: AbsolutIimpact, Climate Excellence: Bewertung von Klimarisiken und –chancen, Ausgabe 04/2020
   Climate Risks & Net Zero                                                                                                                                                March 2021
   PwC                                                                                                                                                                             13
Spotlight on climate risk
Minimal input from your side and maximum output provided
via the Climate Excellence tool

 Input of Your Company                                                                   Output: Financial
 • NACE codes                                                                            impact per scenario
 • ISIN (if listed)
 • Company
 • Country of operation/geography (ideally not only headquarters)
 • Exposure                                                                                        EBITDA
                                                                    1.8°C
 • If possible: revenue breakdown of companies by NACE codes
                                                                            Climate
                                                                    2.0°C                          Sales
                                                                            Excellence
  Input Climate Excellence Model                                    2.7°C
  • Scenario data

  • Asset level data

  • Validation emission-data
Climate Risks & Net Zero                                                                           March 2021
PwC                                                                                                        15
Climate risks are not a separate risk category but have an
impact on credit, market and operational risks

                     Credit Risk                               Market Risk                               Operational Risk
Physical             • Revaluation of credit objects and       • Rating downgrades and Exchange rate     • Physical losses burden balance sheet;
Risks                  collateral                                losses after catastrophes and by          impairment the availability of banking
                     • Rating downgrades                         creeping sinking productivity             services

Transition • Stranded assets                          • Sudden extreme fluctuations in asset             • Image damage due to failure to switch
Risks      • Risk shifts                                prices; stranded assets                            to sustainable business practices
           • Effects on Probability of default (PD)   • Long-term price increases due to
             and losses in the event of default (LGD)   environmental and social changes
Financial            • Affectedness of entire industries and   • Market-threatening effects of climate   • Reputation damage for entire industries/
Stability              markets                                   and environmental damage in an entire     entire markets
Risks                • Economy is no longer insurable at         region                                  • Large parts of the financial infrastructure
                       reasonable cost                                                                     of a Country/Region
Source: BaFin Perspektiven Ausgabe 2|2019, pg. 23

Climate Risks & Net Zero                                                                                                                        March 2021
PwC                                                                                                                                                     16
The tools guides you through the relevant aspects and delivers
answers for your specific portfolio                                                                                                                         Transition risk

PF Overview                                                    Regional Heatmap               Single Asset Benchmark

 Identify exposures, portfolio   Compare sector performances   Illustrate differences in      Allows separation of winners and   Compare risk drivers for a single
 resilience and potentials for   of companies                  performance across countries   losers                             company and analyze company
 reshifting                      in the same segment.                                         within the same sector             differentiators.

                                 Company Benchmark             Regional Performance                                              Single Asset Risk driver

Climate Risks & Net Zero                                                                                                                                    March 2021
PwC                                                                                                                                                                 17
Spotlight on Net Zero

                              March 2021
PwC                                   18
Reaching Net Zero: Different frameworks for target setting
exist
                                                                                             Three target options* for
                                                                                             mandatory Asset Classes:                                                                Further approaches:
                                                                                             1) Sector Decarbonization Approach
    Potential Net Zero pathway:                                                                                                                                          Four target options
                                                                                             Target for the reduction of the emission
                                                                                                                                                                         (3 mandatory):
    in Billion tonnes CO2 per year (GtCO2/yr)
                                                                                             intensity of individual sectors present
                                                                                             in the portfolio
         40
                                                                                                                                                                     •     Absolute emissions target for
                                                                                                                                                                           (sub)portfolio
                                                                                             2) Portfolio Coverage
         20                                                                                                                                                          •     Sector intensity targets
                                                                                              Target for the share of portfolio                                      •     Engagement targets
                                                                                              companies that set themselves a                                        •     Financing Transition targets
           0
                                                                                              SBT

        -20                                                                                  3) Portfolio Temperature Rating
                     2020
                    2020               2060
                                    2060          2100 2100

         Fossil fuel and industry         AFOLU                                              Target for the overall temperature
                                                                                             rating (contribution to global warming)
                                                                                             of the entire portfolio

Climate Risks & Net Zero       Sources: IPCC SR1.5; SBTi – Financial sector science-based targets guidance, October 2020;   *Real Estate and Project Finance has to be calculated using the SDA        March 2021
PwC                            The Unconvened Net-Zero Asset Owners Alliance 2025 Target Setting Protocol; January 2021                                                                                        19
How to use the SBTi to set science-based targets

What does this mean for the different parts of your business?
                                                                                                                                                                                                      SBTi method
             The table shows the SBTi
                                                                                                                            Estimated                       SBTi           Sector Decarbonisation          SBT Portfolio        Temperature
             approach mapped to your                                                                                                          €bn
                                                                                                                            emissions                     Coverage                Approach                  Coverage              Rating
             business.
                                                  Residential Mortgages                                                                                    Optional                     ✔                          ⨯                   ⨯

             Where an activity is out of scope    Property & Construction / Commercial Real Estate                                                      > 67% actual                    ✔                          ⨯                   ⨯
             for SBTi, such as car finance,                                      Electricity generation                                                  100% actual                    ✔                          ⨯                   ⨯
                                                   Project
             targets can still be developed and    Finance                                Other                                                               n/a                        ⨯                         ⨯                   ⨯
             set using an appropriate method,
                                                                                 Electricity generation                                                  100% actual                    ✔                          ⨯                   ⨯
             and would provide you with an
                                                                                      Fossil fuel**                                                        > 95% $                       ⨯                        ✔                    ⨯
             opportunity to show leadership by
             working with the SBTi to pioneer     Corporate                                                                                                                            ✔
                                                                                 Mining and quarrying                                                      > 67% $                                                ✔                   ✔
             a new methodology.                    & SME*                                                                                                                     (iron and steel only)
                                                   lending
                                                                  Transport, aluminium, cement, pulp and paper,
                                                                                                                                                           > 67% $                      ✔                         ✔                   ✔
             The SBTi are looking to broaden                                         buildings
             the framework over the coming                                       Other commercial***                                                       > 67% $                       ⨯                        ✔                   ✔
             years, with infrastructure and
             asset finance being considered                       Common and preferred stock, corporate bonds,
                                                    Listed         exchange traded funds, REITs****, listed real                                           100% $                       ✔                         ✔                   ✔
             for the next twelve months.          equity and        estate companies, real estate mutual funds
                                                    bonds
             For your own operations,                                               Funds of funds                                                         Optional                     ✔                         ✔                   ✔
             financial institutions are                   Private equity and debt, including venture capital                                               Optional                     ✔                         ✔                   ✔
             encouraged to set targets for        * SME lending is optional
             scope 1 & 2 emissions.               ** Includes Oil & Gas and Coal. SDA approach for oil and gas currently in development
                                                  *** Other sectors include all service sectors, tech and education, wholesale, agriculture, manufacturing, and retail and hospitality
                                                  **** REITs: If the FI in question is a REIT, 67% of mortgages need to be covered. If the FI in question is investing in REITs, this investment is considered a listed equity, and 100% of
   Climate Risks & Net Zero
                                                  mortgages need to be covered.                                                                                                                                                         March 2021
   PwC                                                                                                                                                                                                                                         20
Case example: Achieving net zero requires target setting and
active steering
                                                                                                                                                                        Example: Portfolio

                                           Energy                                        Relevant questions that need addressing:
                                                                                                                                                                Benefits
             0,60                                                                   1.   Where are companies I am investing in situated
             0,55                                                                        relative to the trajectory?                               •   Credible communication
             0,50
                                                                                    2.   Comparing titles I hold and sell over time, what are          of integrated steering
             0,45
             0,40                                                                        relevant assumptions I need to consider?                      mechanisms
tCO2 / MWh

             0,35                                                                   3.   In planning decarbonization of my portfolios what         •   Initial assessment of
             0,30
                                                                                         KPIs do I need to consider in the future?                     financing universe
             0,25
             0,20
                                                                                    4.   How much decarbonization can I expect to                  •   Setting up a future-proof
             0,15                                                                        achieve in my portfolios through my holdings’ own             steering mechanism by
             0,10                                                                        decarbonization?                                              understanding
             0,05
             0,00
                                                                                    5.   What are implications on my product portfolio?                decarbonization needs in
                     2020           2025          2030      2035         2040       6.   Is the investment universe large enough to explore            different sectors
               Reduction curve from the IEA B2DS Scenario
                                                                                         such a decarbonization journey?                           •   Set decarbonization
                                                              Possible portfolio
               Illustrative portfolio reduction curve          starting points                                                                         targets and collaborate
                                                                                                                                                       with clients to achieve them
      Sector decarbonization curves can be built:                                  Existing Asset Holdings                          Asset Additions
      •   For different ambition levels (different scenarios)
      •   For different scenario sources                                           Steering options:                                Steering options:
      •   For a number of different sectors                                        • Engagement with issuers                        • Choose issuers, who are already aligned
      •   With regional granularity where scenarios provide it                     • Re-weighting                                   • Choose companies and sectors, who are easy to align
      •   Based on physical or economic intensities
                                                                                   • Last resort: sell                                or have credible commitments
                                                                                                                                    • Policies and thresholds
Climate Risks & Net Zero                                                                                                                                                           March 2021
PwC                                                                                                                                                                                        21
A steering logic must take into account the development of the
existing portfolio and requirements for new business
                                                                                                                                                                                                                   Illustrative: Real Estate

                                                                                                                     Reduction in primary energy demand from the climate scenario for Germany (for comparison).
                                                                                                                     Calculated reduction of primary energy demand (kWh/m²) according to IEA ETP 2017 B2DS

   1                   RISK                                                                                                                      Focus on heat pumps and

                                                                                Primary energy (kWh/m²) (1 = 100%)
                                                                                                                                                        natural gas
                                                                                                                                                          Lock-in for new buildings to be considered
    Vulnerability
   Wie stehe ich of today’s portfolio
                  da?
                                                                                                                                                                                       Focus on solar heat and heat pumps
                                                                                                                                                                                          → Necessary to reduce energy
                                                                                                                              ~-                                                         consumption through renovation

                                                                                                                             80%
       Paris-Agreement
       (Well-below 2°C)
                                 3           SUPPORT
                                            TRANSITION                                                                                                 The majority of buildings are
                                                                                                                                                       renovated and use efficient,
                                                                                                                                                            renewable heat
                                         How can I support the transition?
                                                                                                                                                          Long-term minimum standard?

                                                                                                                                                                     Nearly Zero Energy Buildings (NZEB)

     2             STEERING
                                                                                                                                                                                            Combining extreme building efficiency
                                                                                                                                                                                                 with renewable heating.
     Portfolio starting point „to be aligned“
                                                                             Source: IEA ETP and Energy Efficiency Strategy Buildings BMWi

Climate Risks & Net Zero                                                                                                                                                                                                            March 2021
PwC                                                                                                                                                                                                                                         22
What does it mean for
 the risk function?
The ambition level defines the way forward for risk integration

                           Do I want to decarbonize my portfolios as well? Need to integrate on both sides and
                           ensure consistency of approaches.

                             What is my decarbonization ambition?

                              How many scenarios do I want to analyze?

                               Qualitative/quantitative integration

                           Start with most material sectors

Climate Risks & Net Zero                                                                                 March 2021
PwC                                                                                                              24
Different key pathways for risk integration exist
                                                                                     Metrics for Net Zero need to be
                                                                                   integrated as well and depend on
                                                                                                    method decision

Model integration                              Factor model                                 Qualitative integration
•     Quantitative results integration into    •   Determination of risk drivers across     •   Qualitative integration into current
      current assumptions and existing             scenarios                                    assumptions and considerations
      models                                   •   Define a sector and company
                                                   characteristic-specific weighting
                                               •   Approximation in the risk model

                                                         Selection criteria:
                                                          • Ambition level
                                                   • Simplicity in implementation
                                          • Transaction and data costs under construction
                                        • Integration capability into the overall control system
Climate Risks & Net Zero                                                                                                        March 2021
PwC                                                                                                                                     25
Today’s production portfolio and strategy separates winners from losers
                        in a 2°C climate scenario
                        EBITDA developments from steel production up to 2050 in relation to 2016 status
                                                                                                                                                                                                                Comment
                          150%                                                                        150%                                                           150%
                                                                   144%
                                                                                                                                                                                                                • ArcelorMittal is transitioning to a
                          140%                                                                        140%                                                           140%
                                                                                                                                                                                                        133%      regionally and technologically diverse
                          130%                                                                        130%                                                           130%                                         (BOF, EAF & DRI) asset base that makes it
                                                                                                                                      119%                                                                        resilient to climate change scenarios
                          120%                                                                        120%                                                           120%
                                                          113%
                          110%                                                                        110%                                                           110%                                       • thyssenkrupp’s earnings from its steel
                                     100%                                                                     100%   99%                                                    100%
                          100%                                                                        100%                                                           100%                                         division could fall until 2030E, due to a
EBITDA [100% in 2016]

                                                                             EBITDA [100% in 2016]

                                                                                                                                             EBITDA [100% in 2016]
                                                   93%
                                                                                                                                                                                       89%                        lack of regional and technological diversity.
                           90%                                                                        90%                                                            90%
                                                                                                                                                                                                                  Economic use of CCS technology (w/o
                           80%                                                                        80%                                                            80%                                          hydrogen) only in a time window from 2030
                           70%                                                                        70%                                                            70%                       68%                to 2040
                                                                                                                               64%
                           60%                                                                        60%                                                            60%                                        • voestalpine’s earnings could rise by 33%
                           50%                                                                        50%                                                            50%                                          to 2050 as a result of a long-term BOF
                           40%                                                                        40%                                                            40%
                                                                                                                                                                                                                  divestment strategy, towards DRI-based
                                                                                                                                                                                                                  steel production (ACT) and can turn highly
                           30%                                                                        30%                                                            30%                                          profitable for voestalpine
                           20%                                                                        20%                                                            20%

                           10%                                                                        10%                                                            10%

                            0%                                                                         0%                                                             0%
                                     2016          2020   2030     2050                                       2016   2020      2030   2050                                  2016      2020     2030     2050

                           S. AMERICA + S. AFRICA           N. AMERICA                               EUROPE                 GERMANY                                                UNITED STATES      AUSTRIA
                                                           Source: Kepler Cheuvreux, The CO-Firm. The CO-Firm’s team and tool are now part of PwC
                           EAF         DRI          BOF
                        Climate Risks & Net Zero                                                                                                                                                                                                       March 2021
                        PwC                                                                                                                                                                                                                                    26
Your contact person

                           Dr. Nicole Röttmer
                           Climate Leader PwC
                           Deutschland
                           Partner, Hamburg
                           +49 151 40803712
                           nicole.roettmer@pwc.com

Climate Risks & Net Zero                             March 2021
PwC                                                          27
Develop a future-proof
climate strategy with us!
Thank you.
Coverage in the licensed tool version will include…

          ALL sectors           (NACE up to 4th digit)
                                                                                                                                                             Open for all scenarios
                  A - Agriculture, Forestry                                                             K – Financial and                                    All business-related scenarios can be analyzed.
                                                            E - Construction
                  And Fishing                                                                           Insurance activities                                 Focus right now lies on (Integrated) Energy
Sectors

                                                                                                                                                             System Models
                  B - Mining and Quarrying                 C - Manufacturing                           L – Real Estate Activties                             • 1.8°C based on IEA ETP B2DS
                                                                                                                                                             • 2.0°C based on IEA ETP 2DS
                  D - Electricity                          H – Transport and Storage                   All remaining NACE*                                   • 2.7°C based on IEA ETP RTS
                   Financial
                   Assets           Listed corporate bonds, listed equity
                   Coverage

                  Companies More than         ~70,000                   companies; beyond that covering unlisted companies
                                                                                     based on sectoral split
                   Physical
                   Assets           > 230,000                 physical assets
                                                                                          e.g. power plants (wind, solar farms), oil
                                                                                          fields, automotive production lines

                  Adaptation
                  measures          >135          unique technical adaptation measure packages across sectors per industry

                  Countries         Global Coverage with more than   50     countries in depth
                                                                                                 *Our primary analysis is performed based on NAICS classification, as it provides
                                                                                                  more granularity for the analysis. We provide a mapping for NAICS to NACE.
     Climate Risks & Net Zero                                                                                                                                                                            March 2021
     PwC                                                                                                                                                                                                         29
You can also read