Better Choice Company - Q1 2022 Earnings Presentation May 12, 2022 - Seeking Alpha
←
→
Page content transcription
If your browser does not render page correctly, please read the page content below

Better Choice Company
Q1 2022 Earnings Presentation

May 12, 2022
This presentation regarding Better Choice Company, Inc. (“the Company”, “Better Choice”, “BTTR”, “we”, “us” or “our”) is for you to familiarize yourself with the Company. This
presentation contains information, statements, beliefs and opinions which are forward-looking, and which reflect current estimates, expectations and projections about future events,
referred to herein and which constitute “forward-looking statements” or “forward-looking information” within the meaning of the Private Securities Litigation Reform Act of 1995. All
statements other than statements of historical fact included in this document, regarding our strategy, future operations, financial position, prospects, plans and objectives of management
are forward-looking statements. Statements containing the words “could”, “believe”, “expect”, “intend”, “should”, “seek”, “anticipate”, “will”, “positioned”, “project”, “risk”, “plan”, “may”,
“estimate” or, in each case, their negative and words of similar meaning are intended to identify forward-looking statements. By their nature, forward-looking statements involve a
number of known and unknown risks, uncertainties and assumptions, most of which are difficult to predict and many of which are beyond the Company’s control, concerning, among
other things, the Company’s anticipated business strategies, anticipated trends in the Company’s business and anticipated market share, that could cause actual results or events to differ
materially from those expressed or implied by the forward-looking statements.
These risks, uncertainties and assumptions could adversely affect the outcome and financial effects of the plans and events described herein. In addition, even if the outcome and
financial effects of the plans and events described herein are consistent with the forward-looking statements contained in this presentation, those results or developments may not be
indicative of results or developments in subsequent periods. Although the Company has attempted to identify important risks and factors that could cause actual actions, events or results
to differ materially from those described in forward-looking information, there may be other factors and risks that cause actions, events or results not to be as anticipated, estimated or
intended. Forward-looking information contained in this presentation is based on the Company’s current estimates, expectations and projections, which the Company believes are
reasonable as of the current date. The Company can give no assurance that these estimates, expectations and projections will prove to have been correct. Given these uncertainties, you
should not place undue reliance on these forward-looking statements. All statements contained in this presentation are made only as of the date of this presentation, and the Company
undertakes no duty to update this information unless required by law. You are also reminded that during this presentation, certain non-GAAP financial measures, such as Adjusted EBITDA,
may be discussed. These measure should not be considered an alternative to net income, or any other measure of financial performance or liquidity presented in accordance with
generally accepted accounting principles (GAAP). These measures are not necessarily comparable to a similarly titled measure of another company. Please refer to our reconciliations of
these discussed figures with the most comparable GAAP measures.
The known risks, uncertainties and factors are described in detail under the caption “Risk Factors” in documents the Company has filed with the Securities and Exchange Commission (the
“SEC”). that are incorporated by reference in this presentation. Certain information contained in this presentation may be derived from information provided by industry sources. The
Company believes such information is accurate and that the sources from which it has been obtained are reliable. However, the Company cannot guarantee the accuracy of, and has not
independently verified, such information. All trademarks, service marks, and trade names appearing in this presentation are the property of their respective holders.

                                                                                                                                                                                            2
Portfolio of Established Premium and Super-Premium Pet Products

                                          Executive Team Purpose Built for Success in the Pet Industry

                                          2,000 Brick & Mortar Locations Targeted in 2022 (Petco, PSP, Indy)

                                          Rapidly Growing International Sales ($100m+ contracted in ’21-’25)

                                          Significant Online Recurring Revenue Base (Chewy, Amazon and DTC)

                                          Exciting Three-Year Innovation Pipeline Key to Future Growth
The Most Innovative Premium Pet Food
       Company in the World               Asset Light Model with Established Co-Manufacturing Partners

                                       Note: Premium and super premium segments defined as being sold with a retail price greater than $0.20 per ounce.

                                                                                                                                                  3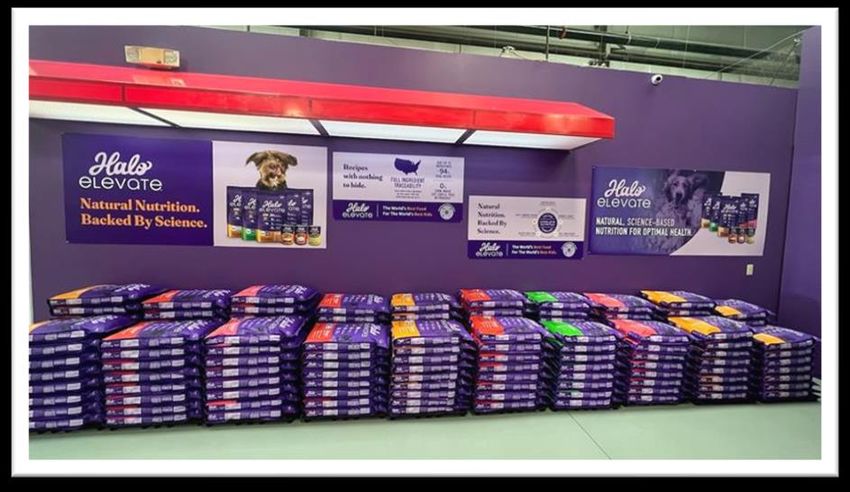
•   Our goal is to reach millennial pet
                                     parents enabling purchase of Halo
                                     products wherever, whenever, and
                                     however they choose.
E-Comm               DTC
                                 •   Differentiating through thoughtful
                                     merchandising of the Halo portfolio that
                                     maximizes conversion and margin in
                                     store, DTC, and eCommerce channels.
     2023 Gross Sales
      Target – $100m
                                 •   Turning every consumer touchpoint into
                                     a dynamic opportunity to connect and
  Pet                                convert customers with a consistent and
                 International
Specialty                            immersive brand experience, end to end.

                                                                                4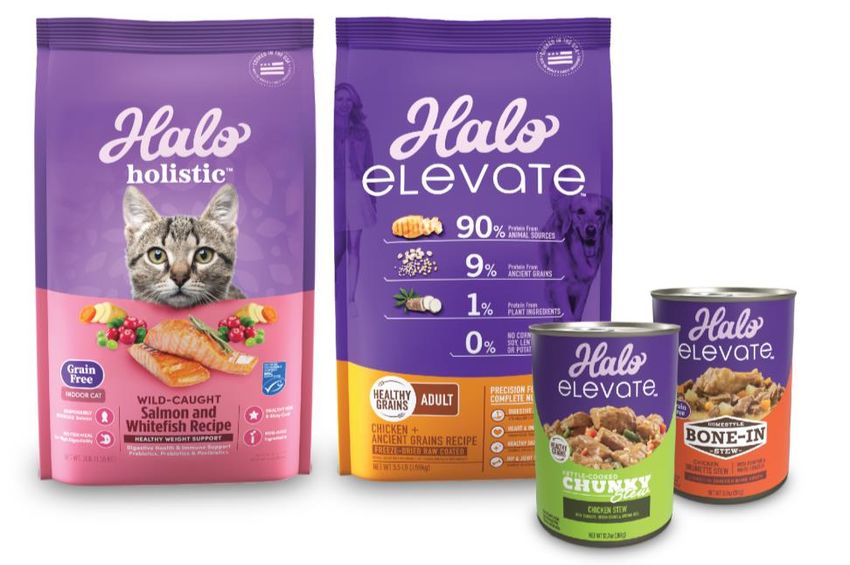
Halo is the
brand for a new
generation of
pet parents

                  5
1
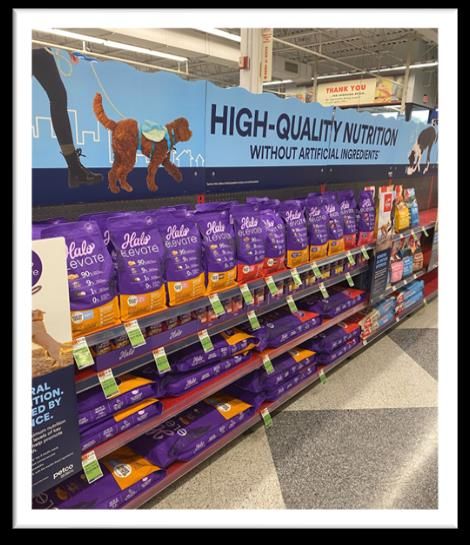
Key Independent Retailers
(Distributor + Direct Sales)
Petco: Seasonal Wall Petco: Dog Aisle Pet Supplies Plus: Dog Aisle Independent Pet (Distribution + Direct Sales)
• Launch Date: May ‘22 • 1,000+ Stores by July ‘22 • Launch Date: April ‘22 • Smaller independent accounts managed by Phillips
• ~900 Petco Stores • 167 Stores in Q1 ‘22 • 600+ Stores • Larger independent accounts managed directly by Halo
• 4’ – 8’ Shelf Space • 4’ – 8’ Shelf Space • 5’ Shelf Space • 4’+ Shelf Space (Opportunity to grow key local accounts)
• “Best Choice Brand” • “Best Choice Brand” • “Preferred Brand” • Focus on partner quality in launch year one
1. Estimated Store Count as of May 31, 2022 and may vary based on individual store reset timelines. 6
SCAN HERE FOR
                                                                   AR EXPERIENCE

 Augmented Reality Engages Store Associates and Consumers

 Compare Brands       Answer Questions      Incentivize Purchase

Added 5 New Sales Team Members in 2022 To Support Launch

                                                                                   7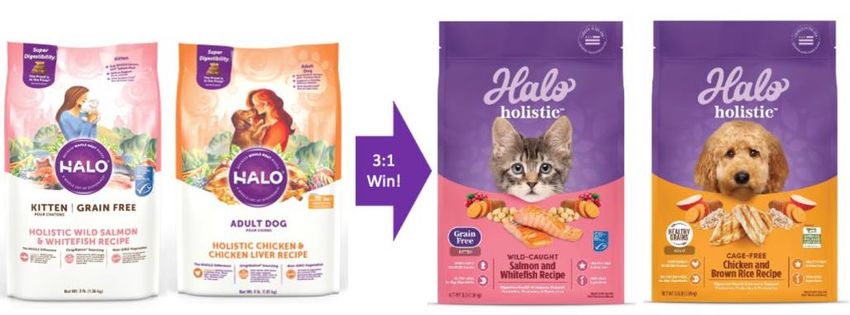
8
•   Estimated Q3 ‘22 Production &
  Halo          Q4 ‘22 Launch on Domestic E-
                Commerce Platforms & DTC Site
 Holistic   •   Minimal Disruption to Existing
                Subscriber Base Anticipated

 Freeze-    •   Estimated Q2 ‘22 Production &

Dried Raw
                Gradual Phase in During 2H ‘22
            •   Minimal Disruption to Existing
 & Treats       Subscriber Base Anticipated

                                                 9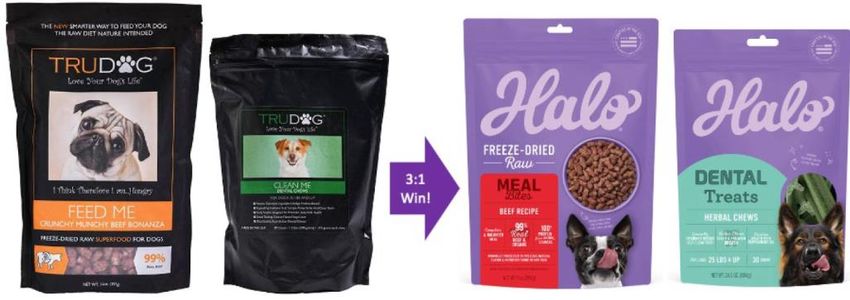
International Growth
      Continues to
  Exceed Expectations
• On pace to exceed contracted volumes in 2022
• International growth driven by Asian demand for
  dry cat food (99% Dry Kibble / 88% Cat Food)
• Additional drivers of growth include:

             +                    +
  Holistic        High Protein        New Market
Renovation       Cat Innovation       Opportunities    $7M Q1 ‘22 Sales            $100M ’21–’25 Sales
                                                      ~3x Q1 ’21 & +77% Q4 ‘21   Aggregate Contracted Minimums
                                                                                                            10
• Sequential domestic growth driven primarily by Halo
Q4 2021 Q1 2022 Delta Elevate launch (~$2.5M incremental sales) and E-
Commerce growth (+$500k vs Q4 ’21)
$ in millions $ % $ % $ %
• Sequential international growth driven by significant
Gross Sales: incremental demand in China. March ‘22 was a record
Domestic $9.7 71% $12.7 65% $3.1 32% month, with $4.6M of international sales
International $3.9 29% $7.0 35% $3.0 77%
Total $13.6 100% $19.7 100% $6.1 45%
• Although commodity costs rose across all categories in Q1
Net Sales: ‘22 vs. Q4 ‘21, we were able to improve gross margin
Domestic $7.1 64% $10.1 59% $3.0 43% without increasing price by taking key actions:
International $3.9 36% $6.9 41% $3.0 76% • Shifted production of Halo Holistic domestic kibble
Total $11.0 100% $17.0 100% $6.0 55% to new co-manufacturer in Q4 ‘21
• Optimized mix to focus on higher GM products
Gross Margin:
Domestic $2.0 28% $3.3 33% $1.3 4% • Consolidated production runs and in some cases
International $0.8 20% $1.4 20% $0.6 0% prepaid to secure lowest possible price
Total $2.8 25% $4.7 28% $1.9 2% • Launched Halo Elevate, which was formulated post
higher-cost, inflationary macro environment
11Domestic gross margin expansion in 1H ’22; Significant International gross margin upside potential in 2H ‘22
Q1 ‘22 Actions Taken International Margin Upside in 2H ‘22
Actions Taken in Q1: International Upside
• Communicated 8-10% price increase in January ‘22 across • 10% Price Increase Effective April ‘22
majority of SKUs, effective April ‘22
• Transition of international kibble production to new co-
• Shifted production of Halo Holistic domestic dry kibble to new manufacturer estimated 6/30/22 (regulatory driven timeline)
manufacturer in Q4 ’21, estimated 10%+ margin improvement on
• Beginning in Q3 2022, estimated 10%+ margin improvement on
majority of domestic kibble SKUs(1)
majority of international kibble SKUs(2)
• Optimized mix, consolidated production runs and selectively
• Illustrative Range of Potential Impact to PF BTTR Gross Margin:
prepaid production to secure ingredients & priority run-times
$ in millions Q1 '22 Q1 '22 - PF Q1 '22 - PF Q1 '22 - PF
• Purchased significant Halo Elevate® inventory to ensure sufficient
Actual Scenario 1 Scenario 2 Scenario 3
supply during launch and to lock in direct COGS
Gross Margin $ % $ % $ % $ %
Domestic $3.3 33% $3.3 33% $3.3 33% $3.3 33%
International $1.4 20% $1.7 25% $2.1 30% $2.4 35%
Total $4.7 28% $5.1 30% $5.4 32% $5.7 34%
Note: Illustrative 25%-35% International GM Range for comparison purposes.
1. Estimated margin improvement for domestic dry kibble based on estimated Q1 ‘22 product costs by SKU. 12
2. Estimated 10%+ margin improvement for international dry kibble SKUs is consistent with estimated margin improvement realized in Q1 ‘22 for similar domestic dry kibble
SKUs (post-transition to new co-manufacturer). This estimate does not account for any increases in input costs from Q1 ‘22 to Q3 ’22 or any variation in diets.$ in miilions 31-Mar-22 31-Dec-21
Current Assets: • Cash Balances of $23.4M in Q1 ‘22 vs. $28.9M in Q4 ‘21
Cash and cash equivalents $16.5 $21.7
Restricted cash $7.0 $7.2
• Adjusted EBITDA loss of $2.0M consistent with management’s
Accounts receivable, net $9.7 $6.8 estimates for quarterly cash burn from operations
Inventories, net $8.3 $5.2 • Strategically utilized our strong cash cushion to secure production
Prepaid expenses and other current assets $2.9 $2.9 capacity and launch Halo Elevate, which increased gross margin
Total Current Assets $44.3 $43.9
Current Liabilities:
Accounts payable $5.7 $4.6
Accrued and other liabilities $1.4 $1.9 • Accounts Receivable: We generated $8.7M of gross sales in March
Term loan, net $1.0 $0.9 2022, an all-time record month for Better Choice, which drove a
Operating lease liability $0.0 $0.1 $2.9M increase in AR relative to December 2021
Total Current Liabilities $8.2 $7.3
• Inventory: We strategically purchased inventory in Q1 to ensure a
Long-Term Debt: 100% fill rate of Halo Elevate, a key driver in the $3.1M increase in
Term loan, net $4.2 $4.6 inventory relative to December 2021
Line of credit, net $7.4 $4.9
Total Long-Term Debt $11.6 $9.4
1314
15
The World’s Best Food
For The World’s Best Kids
Better Choice Company
Thank You!   The Most Innovative Pet Food Company In The World
You can also read