Q2 2022 Earnings Call Presentation - TechnipFMC
←
→
Page content transcription
If your browser does not render page correctly, please read the page content below
Q2 2022 Earnings Call
Presentation

July 28, 2022
Disclaimer
Forward-looking statements
This communication contains “forward-looking statements” as defined in Section 27A of the United States Securities Act of 1933, as amended, and Section 21E of the United States
Securities Exchange Act of 1934, as amended. Forward-looking statement usually relate to future events and anticipated revenues, earnings, cash flows, or other aspects of our
operations or operating results. Forward-looking statements are often identified by words such as “guidance,” “confident,” “believe,” “expect,” “anticipate,” “plan,” “intend,” “foresee,”
“should,” “would,” “could,” “may,” “will,” “likely,” “predicated,” “estimate,” “outlook” and similar expressions, including t he negative thereof. The absence of these words, however, does not
mean that the statements are not forward-looking. These forward-looking statements are based on our current expectations, beliefs, and assumptions concerning future developments
and business conditions and their potential effect on us. While management believes these forward-looking statements are reasonable as and when made, there can be no assurance
that future developments affecting us will be those that we anticipate. All of our forward-looking statements involve risks and uncertainties (some of which are significant or beyond our
control) and assumptions that could cause actual results to differ materially from our historical experience and our present expectations or projections, including unpredictable trends in
the demand for and price of crude oil and natural gas; competition and unanticipated changes relating to competitive factors in our industry, including ongoing industry consolidation; the
COVID-19 pandemic and its impact on the demand for our products and services; our inability to develop, implement and protect new technologies and services; the cumulative loss of
major contracts, customers or alliances; disruptions in the political, regulatory, economic and social conditions of the countries in which we conduct business; the refusal of DTC and
Euroclear to act as depository and clearing agencies for our shares; the United Kingdom’s withdrawal from the European Union; the impact of our existing and future indebtedness and
the restrictions on our operations by terms of the agreements governing our existing indebtedness; the risks caused by our ac quisition and divestiture activities; the risks caused by fixed-
price contracts; any delays and cost overruns of new capital asset construction projects for vessels and manufacturing facili ties; our failure to deliver our backlog; our reliance on
subcontractors, suppliers and our joint venture partners; a failure or breach of our IT infrastructure or that of our subcont ractors, suppliers or joint venture partners, including as a result of
cyber-attacks; the risks of pirates endangering our maritime employees and assets; potential liabilities inherent in the industries in which we operate or have operated; our failure to
comply with numerous laws and regulations, including those related to environmental protection, health and safety, labor and employment, import/export controls, currency exchange,
bribery and corruption, taxation, privacy, data protection and data security; the additional restrictions on dividend payouts or share repurchases as an English public limited company;
uninsured claims and litigation against us, including intellectual property litigation; tax laws, treaties and regulations an d any unfavorable findings by relevant tax authorities; the
uncertainties related to the anticipated benefits or our future liabilities in connection with the spin-off of Technip Energies (the “Spin-off”); any negative changes in Technip Energies’
results of operations, cash flows and financial position, which impact the value of our remaining investment therein; potenti al departure of our key managers and employees; adverse
seasonal and weather conditions and unfavorable currency exchange rate and risk in connection with our defined benefit pension plan commitments and other risks as discussed in Part
I, Item 1A, “Risk Factors” of our Annual Report on Form 10-K for the fiscal year ended December 31, 2021 and Part II, Item 1A, “Risk Factors” of our subsequently filed Quarterly Reports
on Form 10-Q. In addition, our results may be impacted by the uncertainty of transition to new energy, including the type, devel opment and demand for new energy sources;
unpredictable trends in energy transition initiatives; geopolitical, legislative or regulatory initiatives and changes related to energy transition; and our ability to achieve the benefits of the
energy transition related business strategies, initiatives, systems, collaborations and applications.

We caution you not to place undue reliance on any forward-looking statements, which speak only as of the date hereof. We undertake no obligation to publicly update or revise any of our
forward-looking statements after the date they are made, whether as a result of new information, future events or otherwise, except to the extent required by law.

                                                                                                                                                              Q2 2022 Earnings Call Presentation | 2
Q2 2022 Overview Operational Highlights and Financial Results Doug Pferdehirt, Chair and Chief Executive Officer Alf Melin, EVP and Chief Financial Officer
Q2 2022 Operational summary
Highlights
Adjusted EBITDA of $187 million, with outperformance in both segments
Subsea inbound orders of $1.9 billion; second consecutive quarter of book -to-bill above 1.3x
Subsea inbound orders now anticipated to grow up to 40% for full-year, approaching $7 billion
Higher North America activity and pricing drove sequential improvement in Surface Technologies
iFEED™ award from Equinor for BM-C-33 project in Brazil; option to direct award 1 as iEPCI™
1 iEPCI™ phase of the project w ould be a “major” contract over $1.0 billion, subject to FID and contract approval
Takeaways
1H subsea tree awards for $400 million share International markets drive
TechnipFMC nearly double repurchase authorization 2H strength in Surface
full-year 2021 announced Technologies
Q2 2022 Earnings Call Presentation | 4Q2 2022 Financial results
Sequential highlights
$2.2B
Reduced gross debt by $530 million, enabling initiation of shareholder distributions Inbound orders
Total Company adjusted EBITDA of $187 million from continuing operations
$9.0B
Subsea increased due to higher project and service activity and improved backlog margin Backlog
Surface Technologies benefited from higher activity and improved pricing in North America,
partially offset by transition to new Saudi Arabia manufacturing facility $187M
Adjusted EBITDA
Free cash deficit of $133 million; seasonality to drive expected strength in 2H
Cash and cash equivalents of $685 million, net debt of $790 million $133M
Free cash deficit
Segment results
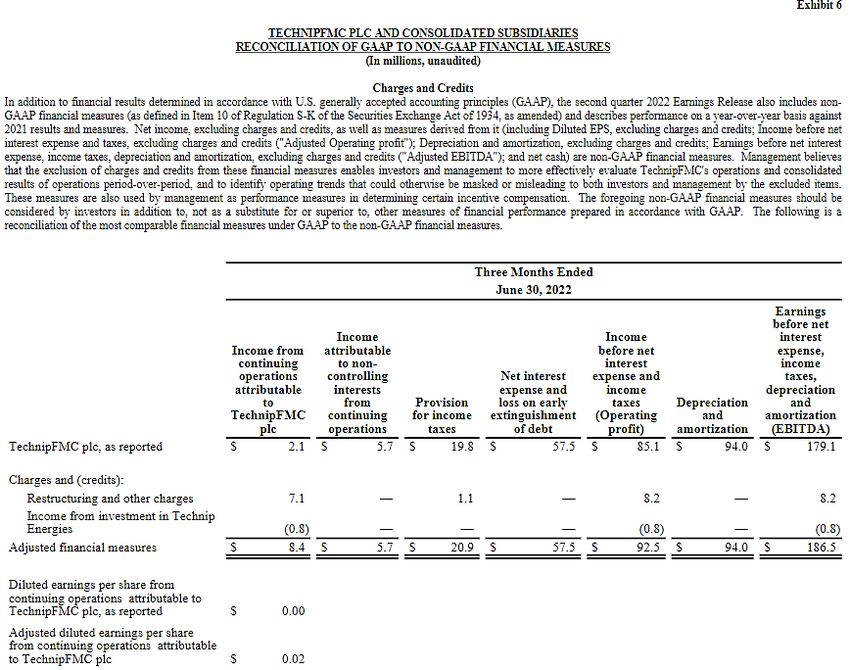
Q2 2022 Earnings Call Presentation | 5Q2 2022 Cash flow and net debt
Net Debt
(In millions, unaudited)
June 30,
2022
Cash and cash equivalents $ 685
Short-term debt and current portion
of long-term debt (104)
Long-term debt, less current portion (1,371)
Net debt $ (790)
Q2 2022 Earnings Call Presentation | 62022 Full-year financial guidance1 As of February 23, 2022
Subsea Surface Technologies
Revenue in a range of $5.2 – 5.6 billion Revenue in a range of $1,150 – 1,300 million
EBITDA margin in a range of 11 – 12% EBITDA margin in a range of 11 – 13%
(excluding charges and credits) (excluding charges and credits)
TechnipFMC
Corporate expense, net $100 – 110 million (includes depreciation and amortization of ~$5 million)
Net interest expense $105 – 115 million
Tax provision, as reported $100 – 110 million
Capital expenditures approximately $230 million
Free cash flow2 $100 – 250 million
All segment guidance assumes no further material degradation from COVID -19 related impacts.
1 Our guidance measures of adjusted EBITDA margin and free cash flow are non-GAAP financial measures. We are unable to provide a reconciliation to comparable GAAP financial measures on a forward-looking
basis without unreasonable effort because of the unpredictability of the individual components of the most directly comparabl e GAAP financial measure and the variability of items excluded from each such
measure. Such information may have a significant, and potentially unpredictable, impact on our future financial results.
2 Free cash flow = cash flow from operations less capital expenditures
Q2 2022 Earnings Call Presentation | 7Backlog scheduling provides visibility
Subsea1 Surface Technologies
as of June 30, 2022 as of June 30, 2022
2022
2022
2024+ $2.0B
$317M
$2.7B
$7.9 $1.1
billion billion
2023+
$797M
2023
$3.2B
1 Backlog does not capture all revenue potential for subsea services
Q2 2022 Earnings Call Presentation | 8Subsea opportunities in the next 24 months1
Q2 2022 Earnings Call Presentation | 9Appendix
Q2 2022 Earnings Call Presentation | 10Glossary
Term Definition Term Definition
CAGR Compound Annual Growth Rate iLOF™ Integrated Life of Field
CCS Carbon Capture and Storage LNG Liquefied Natural Gas
ESG Environmental, Social and Governance MMb/d Million Barrels per Day
FID Final Investment Decision Mtpa Million Metric Tonnes per Annum
F/X Foreign Exchange NAM North America
GHG Greenhouse Gas Emissions RCF Revolving Credit Facility
GOM Gulf of Mexico ROIC Return on Invested Capital
HP/HT High Pressure / High Temperature ROV Remotely Operated Vehicles
HSE Health, Safety and Environment ROW Rest of World
iEPCI™ Integrated Engineering, Procurement, Construction and Installation
iFEED™ Integrated Front End Engineering and Design
Q2 2022 Earnings Call Presentation | 11Q2 2022 Earnings Call Presentation | 12
Q2 2022 Earnings Call Presentation | 13
Q2 2022 Earnings Call Presentation | 14
Q2 2022 Earnings Call Presentation | 15
Q2 2022 Earnings Call Presentation | 16
Q2 2022 Earnings Call Presentation | 17
You can also read