Assessment Report-Residential Overview - City and Borough of Juneau For Assessment Year 2022
←
→
Page content transcription
If your browser does not render page correctly, please read the page content below
Finance
                                                                           Department
                                                                       Assessor Division
                                                                       155 S Seward St.
                                                                       Juneau AK 99801
                                                                         (907)586-5215

    Assessment Report- Residential Overview

                City and Borough of Juneau

                 For Assessment Year 2022

         Assessment Date (Effective Valuation Date): January 1, 2022

                     2022 Report Date: March 29, 2022

1
Table of Contents
Residential Prologue ...................................................................................................................................................................................... 3
Introductory Message for 2022...................................................................................................................................................................... 3
Valuation Summary ........................................................................................................................................................................................ 3
    Assessment Process Overview ................................................................................................................................................................... 3
       Sales Data Procedures ............................................................................................................................................................................ 3
       Model Specification & Calibration Procedures ...................................................................................................................................... 3
       Analysis and Valuation Overview ........................................................................................................................................................... 4
Summary of Performance Tests and Measures (Statistics) ............................................................................................................................ 5
Overview Reconciliation & Conclusions ......................................................................................................................................................... 7
    Submarkets, Stratifications and Characteristics Adjustments ................................................................................................................... 7
       Residential .............................................................................................................................................................................................. 8
    General Reconciliation & Conclusions Summary ..................................................................................................................................... 10

2
Residential Prologue
A City and Borough of Juneau property assessment is the Assessor’s determination of the fair market value of your
property as of January 1, 2022. For residential properties, values for single-family homes in Juneau went up by 8.4%
on average over the last year. This market activity is reflected in CBJ’s 2022 property assessments. The increase in
value was driven by a high demand for homes, low supply of new homes, and rapidly rising building costs. Average
assessment increases for single-family homes by neighborhood range from as little as 5% out Thane Road to as much
as 12.2% in the Casey Shattuck (Flats) neighborhood.
Residential properties become worth more when people are willing to pay more. 2021 saw about 800 residential
sales in Juneau; CBJ has sale prices for roughly half of them. Here are details on what drove residential property
values up:
With so many buyers in the market and so few homes to buy, sale prices tended to exceed asking prices. In
the 2021 housing market, it was not uncommon for sellers to receive multiple offers including escalating
contingencies from buyers trying to make sure they were not out-bid. Some homes were purchased with
additional cash above and beyond what could be financed based on a market appraisal.
Interest rates — essentially the cost to borrow money — were also historically low. Lower interest rates give
buyers additional purchasing power, and that purchasing power created high demand among limited supply.
Prices for lumber and other building materials surged last year, as did labor costs. These price inputs increase
the cost to replace a home, which in turn increases the prices that buyers were willing to pay.
Why do CBJ assessments matter? Your property taxes are calculated by multiplying your assessed value with the
millage rate, so it is important that your assessed value is accurate. Until the Juneau Assembly finishes next year’s city
budget and sets the property tax rate in June, no one knows exactly what their individual property tax bill will look
like. The Assembly has the authority to reduce or increase the mill rate, or keep it flat.
Introductory Message for 2022
Overall, residential assessed property values increased 9.21% from 2021 to 2022.
Overall, commercial assessed property values increased 2.31% from 2021 to 2022.
Overall, vacant land assessed property value decreased by 0.62% from 2021 to 2022.
Business Personal Property Values increased less than 1% from 2021 to 2022.
Valuation Summary
Assessment Process Overview
Sales Data Procedures
Sales data was gathered and considered through a sales validation and verification process. A sales validation
criteria and policy was implemented in 2021 and documented for commercial property for 2022.
For residential properties the sales utilized for analysis are from the range of January 1, 2019 to December 31,
2021. There were a total of 1,040 qualified sales of residential properties with confirmed sale prices for the main
analysis set.
Model Specification & Calibration Procedures
Mass appraisal models utilized in generating values have gone through the processes and Specification and
Calibration.Three Approaches to Value
Cost Approach – is calibrated through trends in costs.
Sales Comparison Approach – utilizes market sales.
Income Approach – utilizes standard rates and/or individual property data.
For many classes of properties our CAMA utilizes a model that is a hybrid of the Cost and Sales Comparison
approaches; a Market Adjusted Cost Approach.
Analysis and Valuation Overview
Commercial and residential property levels of assessment are summarized in the table below. The table
summarizes the ratios from comparing assessed values to sales. A ratio of 1.00 would be right at market, a ratio
under 1.00 indicates that the assessed value is below market value.
Property Class (After Adjustments) Count Mean Median
Commercial Properties Overall (without boathouses) 49 0.8507 0.8265
Residential Properties 1040 0.9752 0.9748
The residential market increased in value throughout 2021 with increased prices for single family homes,
attached homes, and residential condos. A table summarizing residential values is below.
Property Type 2019 Median Sale Price 2020 Median Sale Price 2021 Median Sale Price
Single Family Homes $415,000 $442,000 $481,400
Attached Homes $310,000 $332,700 $362,500
Residential Condos $232,500 $228,900 $240,000Summary of Performance Tests and Measures (Statistics)
This summary report shows statistics for residential properties from the starting point for assessment year 2022
showing a mean of 0.9570 and a median of 0.9565.
AY2022- Residential Starting Point, Trended
Summary Report
IAAO Standards for COD
Statistics SFR 15.0 or less
Current Proposed SFR-newer/homog 10.0 or less
1007 1007 Count (Number of Records with Ratio) Income Properties 20.0 or less
0.7360 0.7360 Minimum Ratio Income-Urban area 15.0 or less
1.1930 1.1930 Maximum Ratio Vacant Land 20.0 or less
0.4570 0.4570 Range
0.9570 0.9570 Mean (This is the average ratio for your sample.)
0.9565 0.9565 Median (This is the mid-point value for your sample. Preferred measure of central tendency.)
0.9616 0.9616 Weighted Mean
7.2748 7.2748 Sum of the Square of Deviations
0.0671 0.0671 AAD
0.0850 0.0850 Standard Deviation Coefficients (0=Normal Distribution)
7.0134 7.0134 COD (Good indicator of confidence level.) Kurtosis #DIV/0!
8.8855 8.8855 COV Skewness #DIV/0!
0.9953 0.9953 PRD- Price-Related or Factor Differential Alt.Cyhelsky's Skew 0.0050
(PRD s/b between 0.98 & 1.03, IAAO) Alt.Pearson's Skew 0.0177
(PRD over 1=Regressive)
Trending Factors Normal / Skewed Distribution Evaluation
0.85 Target Level -0.0005 Differential Mean to Median
0.8882 Factor on Mean 506 Number of data points below the mean.
0.8886 Factor on Median 501 Number of data points above the mean.
0.8839 Factor on Weighted Mean *Note- # below/above works on data sets up to 5,000 pts.
Ratios by Sale Date
2.0000
1.9000 1.4000
1.8000
1.7000 1.2000
1.6000
1.5000
1.4000 1.0000
1.3000
1.2000 0.8000
1.1000
1.0000 0.6000
0.9000
0.8000
0.7000 0.4000
0.6000
0.5000 0.2000
0.4000
0.3000 0.0000
0.2000
0.1000
0.0000
Summary
Histogram of Ratio Frequency
300
250
200
150
100
50
0
0.00
0.10
0.20
0.30
0.40
0.50
0.60
0.70
0.80
0.90
1.00
1.10
1.20
1.30
1.40
1.50
1.60
1.70
1.80
1.90
2.00This second summary report shows the statistics for residential properties after calibrating the values for
assessment year 2022 showing a mean of 0.9752 and median of 0.9748.
AY2022- Residential, After Adjustments, Trended
Summary Report
IAAO Standards for COD
Statistics SFR 15.0 or less
Current Proposed SFR-newer/homog 10.0 or less
1040 1040 Count (Number of Records with Ratio) Income Properties 20.0 or less
0.7792 0.7792 Minimum Ratio Income-Urban area 15.0 or less
1.1807 1.1807 Maximum Ratio Vacant Land 20.0 or less
0.4015 0.4015 Range
0.9752 0.9752 Mean (This is the average ratio for your sample.)
0.9748 0.9748 Median (This is the mid-point value for your sample. Preferred measure of central tendency.)
0.9751 0.9751 Weighted Mean
5.5631 5.5631 Sum of the Square of Deviations
0.0567 0.0567 AAD
0.0732 0.0732 Standard Deviation Coefficients (0=Normal Distribution)
5.8171 5.8171 COD (Good indicator of confidence level.) Kurtosis #DIV/0!
7.5035 7.5035 COV Skewness #DIV/0!
1.0001 1.0001 PRD- Price-Related or Factor Differential Alt.Cyhelsky's Skew 0.0096
(PRD s/b between 0.98 & 1.03, IAAO) Alt.Pearson's Skew 0.0173
(PRD over 1=Regressive)
Trending Factors Normal / Skewed Distribution Evaluation
0.85 Target Level -0.0004 Differential Mean to Median
0.8716 Factor on Mean 525 Number of data points below the mean.
0.8720 Factor on Median 515 Number of data points above the mean.
0.8717 Factor on Weighted Mean *Note- # below/above works on data sets up to 5,000 pts.
Ratios by Sale Date
2.0000
1.9000 1.4000
1.8000
1.7000 1.2000
1.6000
1.5000
1.4000 1.0000
1.3000
1.2000 0.8000
1.1000
1.0000 0.6000
0.9000
0.8000
0.7000 0.4000
0.6000
0.5000 0.2000
0.4000
0.3000 0.0000
0.2000
0.1000
0.0000
Summary
Histogram of Ratio Frequency
350
300
250
200
150
100
50
0
0.00
0.10
0.20
0.30
0.40
0.50
0.60
0.70
0.80
0.90
1.00
1.10
1.20
1.30
1.40
1.50
1.60
1.70
1.80
1.90
2.00Overview Reconciliation & Conclusions
Note that this is an overview of the reconciliation and conclusions. Much deliberation and review occurs within
the analysis process that cannot be captured here.
Over the next few years we will continue to work to:
Bring more uniformity between the commercial and residential property classes
Bring more uniformity between the commercial subclasses
Correct the imbalance in the distribution of the value between the land component and the building
component(s).
Submarkets, Stratifications and Characteristics Adjustments
The chart below shows the change from 2020 to 2022.
Ratios from the Mean
AY2020 AY2021 AY2022
Residential 0.9629 0.9800 0.9752
Comm Overall (1) 0.7149 0.8526 0.8070
Comm Land 0.4095 0.6143 0.8426
Comm Improved 0.7748 0.9142 0.8404
(1) Does not include boathouses.
Ratios from Mean
1.2000
1.0000
0.8000
0.6000
0.4000
0.2000
0.0000
AY2020 AY2021 AY2022
Residential Comm Overall (1) Comm Land Comm Improved
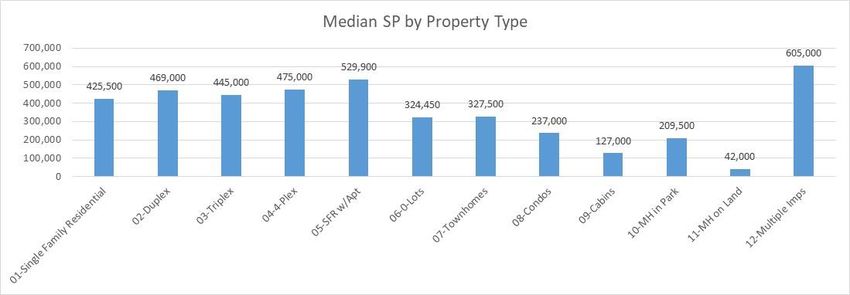
7Residential The following charts are from the audit analysis AFTER the calibration adjustments. These charts show median assessed value to sales (a/s) ratios and median sales prices. On the median ratio chart the number above the column is the number of qualified market sales in that group. 8
Again, the number above the column is the number of qualified market sales in that group.

9
The chart below shows the percent change of assessed values per building type from 2021 to 2022.
Residential Comments
Building cost increases were applied to the residential building components.
After the building cost increases were applied the values were re-analyzed against sales on a neighborhood
basis.
Residential property values increased across the board due to a strong residential market in Juneau.
General Reconciliation & Conclusions Summary
After consideration of the data, the various models, and the performance measurements and tests, we have
applied the changes to the assessed values for 2022 as indicated by market sales as outlined in the above
sections and in further detail in the Annual Valuations Summary Report.
All three approaches were considered for all properties. Similar appraisal methodologies were applied to
similarly classed properties in order to promote equity and uniformity. For some classes of properties one or
more of the approaches were not given significant weight. Additional information in this regard can be found in
the supporting documentation.
10You can also read