Application and Verification of ECMWF Products 2021
←
→
Page content transcription
If your browser does not render page correctly, please read the page content below
UK UK
Application and Verification of ECMWF Products 2021
Met Office. Contributing authors: Dan Suri, Helen Titley, Robert Neal and Philip Gill.
1. Summary of major highlights
ECMWF output is widely used by the Met Office at many timescales, especially the week 2 period where the Met Office is
particularly dependant on ECMWF output. The heaviest users of ECMWF output include the Chief and Deputy Chief
Operational Meteorologists, who provide forecast guidance across the organisation, primarily for the UK but also for many other
areas around the world, and hydrometeorologists at the Flood Forecasting Centre. ECMWF output also forms part of 'BestData',
a multi-model blend producing site-specific forecasts available, for example, on the Met Office public website. Meanwhile, the
Met Office continues to be actively engaged in producing some novel and innovative tools to help operational meteorologists
visualize ensemble output.
2. Use and application of products
2.1 Direct Use of ECMWF Products
ECMWF output is available to the Met Office forecasting community via three main sources - ECMWF's website, internal Met
Office websites and the Visual Weather meteorological workstation which most operational meteorologists at the Met Office
have access to.
A broad range of ECMWF output is visible via WMS layers in Visual Weather and a subset of deterministic output is directly
ingested into the workstation. Direct ingestion of NWP into the workstations is a particularly useful method of visualization as
it allows easy like-for-like comparison of different models and model runs and allows users to exploit some of Visual Weather's
more advanced features and derive their own diagnostics and indices from model fields and otherwise not available, for example
lifted index or fog points.
A number of internal web-based tools and diagnostics which use ECMWF output have been developed. For example, a tool
classifying ensemble members by synoptic type to objectively assess signals and known internally as Decider has been available
for some time. Situations when it is of particular use includes identifying regime changes or the threat of severe weather (Neal
et al. 2016), or in downstream forecast applications to identify the risk of coastal flooding (Neal et al. 2018), fluvial flooding
(Richardson et al. 2020), or landslides. In early 2021 the Met Office implemented a new forecast visualisation for the Decider
weather pattern forecasts, which was based on the popular stacked probability bar plot visualisation already produced by
ECMWF for their set of four weather regimes. These new plots present probabilities for a set of eight weather regimes and enable
a quick assessment of any large-scale circulation changes within the medium- to long-range forecast period. They are also very
useful for comparing consistency over consecutive runs and for identifying key trends in the forecast. The more cyclonic regimes
are plotted at the bottom of the plot (as shades of blue) and the more anticyclonic regimes are plotted at the top of the plot (as
shades of red). This helps derive combined probabilities for types with similar tendencies. The regime ordering always remains
the same to allow easy comparisons with forecasts from previous runs and from different models.
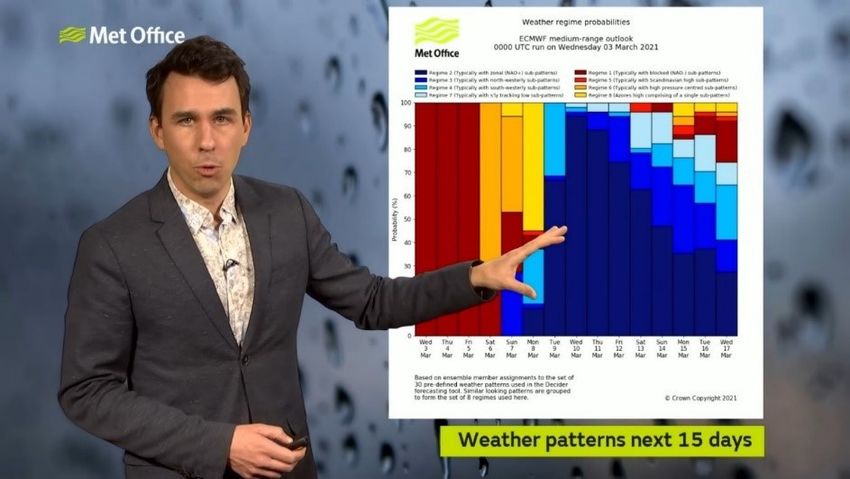
Figure 1. Aidan McGivern using the new Decider weather regime stacked probability bar plots in one of the recent weekly 10-
day trend videos. Here, Aidan highlights a messy transition to more unsettled weather types. ECMWF forecast data is used here.
.
Page 1 of 8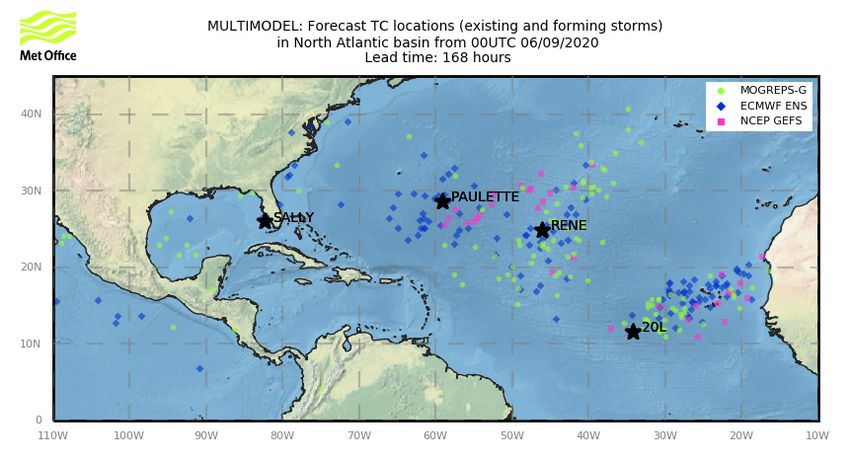
UK                                                                                                                          UK

Before going operational, these plots were trailed with the Met Office Media Team (Figure 1), who have used them several times
in their weekly 10-day trend videos (e.g., the 10-day trend video on 3rd March 2021) to help present long-term changes in the
weather to the public. Aidan McGivern, Met Office broadcast meteorologist says "The darker blues might be the equivalent of
very changeable weather. For example, wet and windy one day, sunshine and showers the next. The darker reds would mean
that the weather patterns are stuck - whether that means continuous northerlies or easterlies or low pressure sitting to the
southwest."

Having a similar visualisation between the ECMWF and the Met Office now makes it easier for forecasters to make a comparison
between the two forecasting tools. For example, Figures 2 and 3 show a direct comparison between the two centre’s visualisations
using input from the ECMWF extended-range ensemble. Figure 2 shows the Met Office visualisation using a set of 8 weather
regimes and Figure 3 shows the ECMWF visualisation using a set of 4 weather regimes. Both examples are from the same
ECMWF ensemble run initialised at 00 UTC on 21st January 2021.

Figure 2. The Met Office visualisation for the set of 8 regimes using the ECMWF extended range ensemble on 21st January 2021.

                                                         Page 2 of 8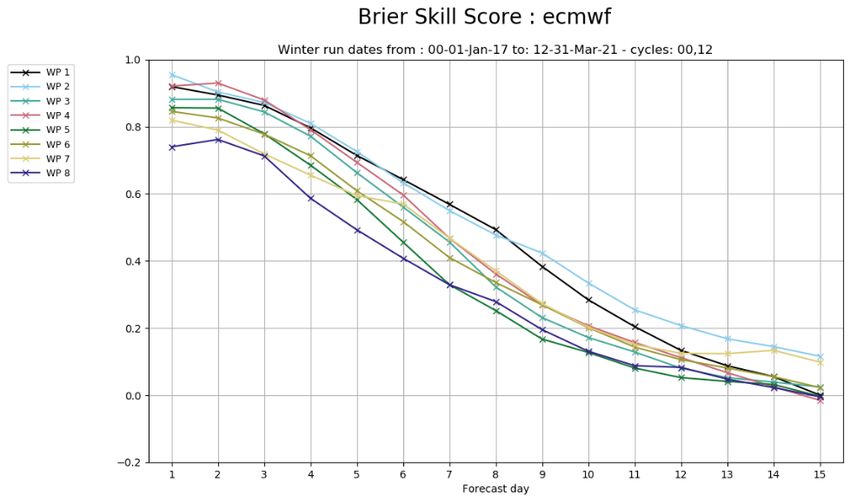
UK                                                                                                                             UK

Figure 3. The ECMWF visualisation for the set of 4 regimes using the ECMWF extended range ensemble on 21st January 2021.

ECMWF ensemble data is also used to create multi-model ensemble products primarily aimed at identifying major impactful
hazards such as tropical cyclones, high wind, rain and snow events, cold spells and heatwaves. This output is available internally
in a web-based module known as the Global Hazard Map (Robbins and Titley 2018). Meanwhile, ECMWF model data is blended
with Met Office NWP to produce what is known in-house as 'BestData', a database of site-specific forecasts for thousands of
sites used for many applications including, for example, forecasts on the Met Office's public web site. ECMWF data is
incorporated from day 2 onwards and becomes the primary source of data for forecasts for week 2. Finally, a new probabilistic
post-processing system for use with ensemble output has been developed at the Met Office. Named IMPROVER, this system
currently runs purely with Met Office NWP, but is expected to be further developed to incorporate ECMWF output during the
next couple of years.
ECMWF output is also accessed via ECMWF's website, be this ecCharts or Open Charts. ecCharts offers outstanding user
flexibility in terms of being able to customize a chart and its 'look' by adding and editing layers and allowing the user to pan and
zoom within the chart. Data in Open Charts, meanwhile, is considered well-presented, though users report some small frustrations
relative such as the relatively large size of icon on the main charts catalogue page resulting in more scrolling than was previously
the case to find items and the size of the default area shown in some of the charts making it hard to pick out details over smaller
areas. Being able to set a default area, say North West Europe, to then apply to all charts in the main Open Charts menu rather
than changing the area in each chart is suggested as useful additional functionality in Open Charts. Meanwhile, depending on
screen size, meteograms opened by clicking on a point in a chart do not always fully fit inside the window that then opens leaving
the user to then have to resize their screen. A print to pdf option of this meteogram would also be useful.
Operational meteorologists at the Met office use ECMWF output alongside the Met Office's own model suite which includes
hourly-cycling, convection-permitting deterministic and ensemble output (respectively UKV and MOGREPS-UK), the global
model, which is run 4 times a day with a horizontal resolution of approximately 10 km and a time-lagged 18 member ensemble,
MOGREPS-G.
Regarding forecasting operations, over-arching, authoritative guidance for the shorter term (Days 1 and 2) is provided by the
Chief Operational Meteorologist, who has ultimate accountability for forecast output and is responsible for operational delivery
of the National Severe Weather Warning Service (NSWWS) which is the Met Office's impact-based public and civil protection
warning service. The Chief Operational Meteorologist is supported, on shift, by three or four Deputy Chiefs. One focuses on UK
weather on time scales from Day 3 through the medium range onwards into monthly and seasonal time-scales. Two others focus
on providing guidance on global forecast matters across multiple time-scales, operating in what is known as the Global Guidance
Unit. Here customers include Met Office meteorologists working outside of the UK, UK government departments, to whom
support is provided during periods of severe weather globally, and cross-European projects such as ARISTOTLE. Meanwhile,
the fourth Deputy Chief provides nowcasting support, on a surge basis, currently mainly in the immediate build-up to and during
severe convective events.

                                                          Page 3 of 8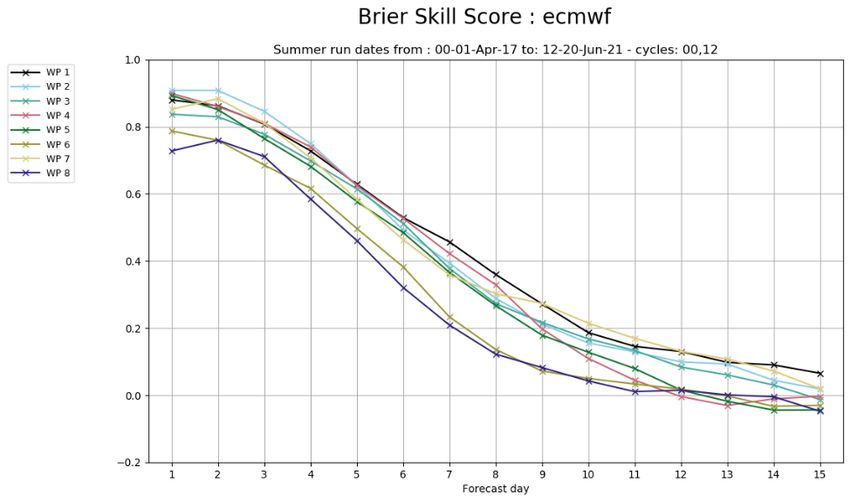
UK                                                                                                                          UK

Other forecast teams, for example aviation, media and marine, then use this guidance to influence their own more customer-
specific output. These forecast teams are spread across the UK with, pre-COVID, operational meteorologists based mainly at
either UK military bases, Met Office operations centres in Exeter and Aberdeen or embedded with clients, for example at some
UK airports and transport agencies. In addition, there are a number of operational teams at locations around the world such as
the Falkland Islands, Gibraltar and Cyprus. The Flood Forecasting Centre, meanwhile, is a joint partnership with the Environment
Agency set up in the wake of severe flooding over parts of the UK in 2007 and comprises of a team of dedicated
hydrometeorologists providing advice on fluvial, pluvial and tidal flooding.
The typical forecasting shift will then see Chief and Deputy Chief Operational Meteorologists inspect a broad range of model
data, comparing output to observational data and considering known systematic model biases. ECMWF output is considered in
tandem with other outputs, primarily the Met Office's own model suite, with the medium range forecasting effort tending to
feature more use of a broader range of ECMWF data than shorter period forecasting which, for details, tends to be more reliant
on the Met Office's own higher resolution, convection-permitting output. Some of the more popular outputs from ECWMF
include cyclone database and point rainfall products.

2.2    Other uses of ECMWF output
2.2.1 Post-processing
Nothing to add.

2.2.2 Derived fields
Noting to add.

2.2.3 Modelling
Noting to add.

3.     Verification of ECMWF products

3.1    Objective verification
3.1.1 Direct ECMWF model output (both HRES and ENS), and other NWP models
Nothing to add.

3.1.2 Post-processed products and end products delivered to users
Verification of Met Office weather pattern forecasts from Decider
The Decider forecasting tool assigns multiple ensemble members from several global ensemble prediction systems to the closest
matching weather pattern definition using a set of 30 weather patterns (Neal et al., 2016). Ensemble member assignments are
carried out separately for each day in the forecast period, allowing short-lived/transitionary weather patterns to be identified.
Forecast probabilities for each weather pattern are then based on the number of ensemble members assigned to each weather
pattern. Probabilities for a reduced set of 8 weather patterns are derived by aggregating up probabilities from each of the 30
patterns, depending on which of the 8 patterns they are mapped to. Weather pattern forecasts are verified against the Met Office
global model analysis weather pattern assignment as defined at 1200 UTC daily.

                                                         Page 4 of 8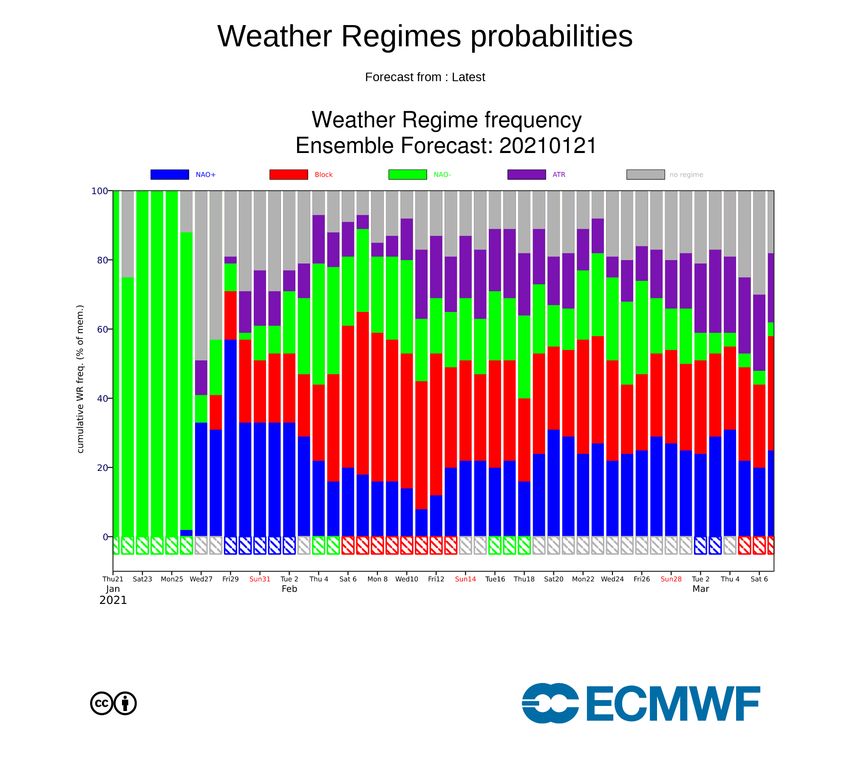
UK                                                                                                                          UK

Figure 4. ECMWF Brier skill score for the set of 8 weather regimes (Top – summer months; bottom – winter months). WP1:
Typically blocked (-NAO) subpatterns; WP2: Typically zonal (+NAO) subpatterns; WP3: Typically north-westerly subpatterns;
WP4: Typically south-westerly subpatterns; WP5: Typically Scandinavian high subpatterns; WP6: Typically high-pressure
centred subpatterns; WP7: Typically southerly tracking low subpatterns; WP8: Azores high single subpattern. This verification
gives full credit to forecast weather regimes which occur within a 1-day window of the central validity date.
Figure 4 shows a seasonal forecast skill comparison between summer and winter for the ECMWF 15-day ensemble, for the
period between January 2017 and June 2021. Forecast skill is better in winter than summer, with most regimes having skill out
to 15 days in winter, with this dropping by 3 to 4 days in winter. WP1 (blocked –NAO) and WP2 (zonal +NAO) are among the
types with the best skill between seasons. WP8 (Azores high extension) has the lowest skill in both seasons. Summer also sees
poor skill with WP7 (southerly tracking low types), whereas these have better skill relative to the other types in winter.

Tropical cyclones: Multi-model ensemble products and verification
At the Met Office, the MOTCTracker tropical cyclone tracker (Heming, 2017) is used to identify and track tropical storms in the
MOGREPS-G, ECMWF ENS and NCEP GEFS ensembles. Ensemble-based products for named storms from each model, and
from the multi-model ensemble are then created. Other products are created for each tropical storm basin, including an animation
of tropical cyclone forecast centres coloured according to model or intensity, and showing the forecast centre locations from
existing storms and for those forecast to form during the forecast. An example frame from these animations is shown in Figure
5 from the forecast from 00 UTC 6th September 2020. The four observed storms that were present by the selected lead time
(T+168) have been overlain in black, all four of which developed during the forecast. The formation of the storms that developed
from Easterly waves off the coast of Africa was generally well predicted (Paulette, Rene and 20L which becomes Teddy) but
the formation of Hurricane Sally near Florida was not well forecast in any of the global ensembles even at shorter lead times.

                                                         Page 5 of 8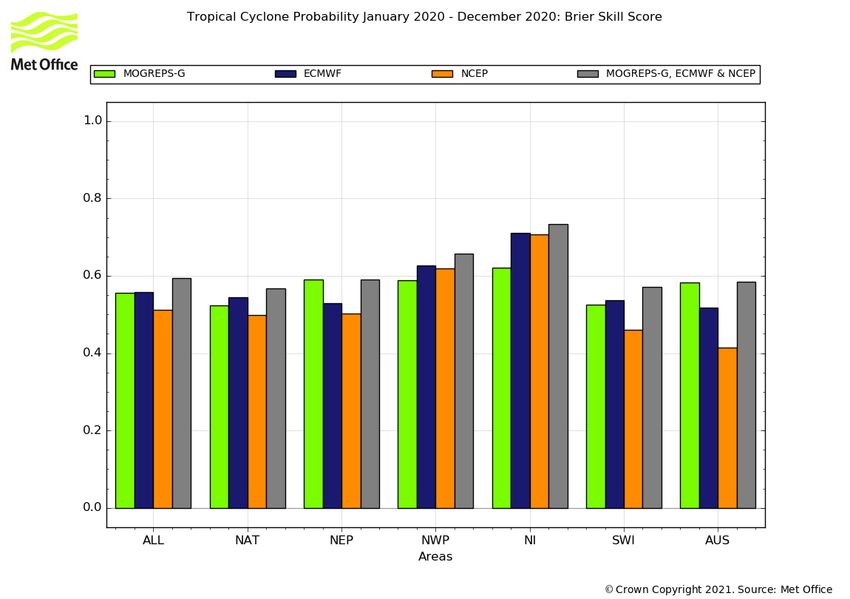
UK                                                                                                                          UK

Figure 5: Multi-model ensemble forecast tropical cyclone centres in the Atlantic basin from 00 UTC 6th September 2020, at a
lead time of T+168 (valid at 00 UTC 13th September 2020). Each identified tropical cyclone centre in the multi-model ensemble
is coloured according to which ensemble model it is found in. The observed storms have been overplotted in black to show where
a named storm did develop.
Verification of the named storm track probability forecasts from the multi-model ensemble (the probability that the storm will
pass within 120km within the next seven days), as described in Titley et al. (2020), continues to be carried out twice-yearly at
the end of the northern and southern hemisphere tropical cyclone seasons. The results for the 12-month period January-December
2020 are shown in Figure 6, which compares the Brier Skill Score for the track probability forecasts between each model and
between each tropical cyclone basin. ECMWF ENS is the most skilful of the three included global ensembles overall, with the
strongest performing ensemble varying from basin to basin (and from storm to storm, not shown). In all basins, using the multi-
model ensemble forecasts adds additional skill to the track probability forecasts. More details on the ensemble-based tropical
cyclone verification carried out at the Met Office can be found in Titley et al. (2020).

                                                         Page 6 of 8
UK UK
Figure 6. Brier Skill Score of MOGREPS-G, ECMWF ENS, NCEP GEFS and multi-model ensemble forecasts of named storm
track probability: All storms from January to December 2020 (left columns) and split by tropical cyclone basin (NAT=North
Atlantic, NEP=North East Pacific, NWP=North West Pacific, NI=North Indian, SWI=South West Indian, AUS=Australian).
3.1.3 Monthly and Seasonal forecasts
Nothing to add.
3.2 Subjective verification
3.2.1 Subjective scores
No formal, systematic subjective verification has taken place. However, feedback from the Met Office forecasting community
reveals a perception of biases in precipitation forecasts in some areas of the Tropics (such as in Africa) and some consistently
very high precipitation totals over the northwest Andes in South America.
3.2.2 Case studies
Nothing to add.
4. Requests for additional output
Requests for new/modified ECMWF outputs from the Met Office include incorporation of ERA5 into meteograms to add
additional context and annual and monthly climatological data and indices to help with forecasting extreme heat waves.
Page 7 of 8UK UK
5. References to relevant publications
Heming, J.T. 2017: Tropical cyclone tracking and verification techniques for Met Office numerical weather prediction models.
Meteorol. Appl., 24, 1–8.
Neal, R., Fereday, D., Crocker, R. and Comer, R., 2016: A flexible approach to defining weather patterns and their application
in weather forecasting over Europe. Meteorol. Appl., 23, 389-400.
Neal, R., Dankers, R., Saulter, A., Lane, A., Millard, J., Robbins, G. and Price, D., 2018: Use of probabilistic medium- to
long- range weather- pattern forecasts for identifying periods with an increased likelihood of coastal flooding around the UK.
Meteorol. Appl., 25, 534-547.
Richardson, D., Neal, R., Dankers, R., Mylne, K., Cowling, R., Clements, H. and Millard., J., 2020: Linking weather patterns
to regional extreme precipitation for highlighting potential flood events in medium- to long- range forecasts. Meteorol. Appl.,
27, e1931
Robbins, J. and Titley, H. 2018: Evaluating high-impact precipitation forecasts from the Met Office Global Hazard Map (GHM)
using a global impact database. Meteorol. Appl., 25, 548-560
Titley, H.A., Bowyer, R.L. and Cloke, H.L. 2020: A global evaluation of multi-model ensemble tropical cyclone track
probability forecasts. Q J R Meteorol Soc, 146, 531–545.
Page 8 of 8You can also read