FLOW REGIME DETECTION USING GAMMA-RAY-BASED MULTIPHASE FLOWMETER: A MACHINE LEARNING APPROACH
←
→
Page content transcription
If your browser does not render page correctly, please read the page content below
J. H. Zhu, et al., Int. J. Comp. Meth. and Exp. Meas., Vol. 10, No. 1 (2022) 26–37

FLOW REGIME DETECTION USING GAMMA-RAY-BASED
  MULTIPHASE FLOWMETER: A MACHINE LEARNING
                 APPROACH
  JIAN HUA ZHU1, RITESH MUNJAL1,2, ANI SIVARAM2, SANTHIYAPILLAI RAJEEVAN PAUL2, JING
                                   TIAN2 & GUILLAUME JOLIVET1
                        1 Singapore Well Testing Center, Schlumberger, Singapore.
              2 Institute of Systems Science, National University of Singapore, Singapore.

                                               ABSTRACT
The presence of intermittent flow regime such as slug flow could cause issues to oil-gas well pipe-
line-riser structures due to large fluctuations in pressure, leading to the production rate reduction and
damage in the pipe structure. Monitoring multiphase flow regimes in production pipe systems is thus
important. There are nowadays increasing use of multiphase flowmeter (MPFM) for well production
flowrate metering. The associated phase fraction and flowrate measurement sensors in MPFMs could
be potentially employed for multiphase-flow regime detection with no additional component required.
In this study, a machine learning model is proposed to infer multiphase-flow regime from the measure-
ments of a vertically installed gamma-ray and Venturi-based MPFM. Flow loop tests have been carried
out at Singapore Well Testing Center with flows of various flow regimes observed at the horizontal inlet
pipe section, such as dispersed bubbly, stratified, intermittent (slug) and annular flow regimes. The flow
regime has been determined by visualization from a side glass in the flow loop pipe section and from
real-time images reconstructed by an electrical-capacitance tomography system. The MPFM real-time
measurements and derived or calculated data (such as Venturi differential pressure and gamma-ray
mixture density) are then used as machine learning training data, with the flow regimes to be the train-
ing target. Various machine learning methods have been experimented, such as convolutional neural
network (CNN), long short-term memory (LSTM) and CNN-LSTM. It has been found that LSTM
method with regularization, balancing and logarithmic normalization of the calculated parameters can
achieve the highest accuracy on flow regime prediction (99.6%). This study is the first attempt to pre-
dict flow regime at horizontal entrance section upstream of an MPFM with measurements made at a
vertical Venturi throat section. The study also proves that flow regime could be accurately predicted by
a gamma-ray and Venturi-based MPFM.
Keywords: flow regime detection, gamma-ray, machine learning, multiphase flow, multiphase flowmeter.

                                     1 INTRODUCTION
In a gas/liquid two-phase flow, there exist a number of flow structures (or flow regimes) in
terms of phase distribution, from bubbly flow where gas presents as bubbles immersed in
liquid as the continuous phase, to mist flow where liquid presents as small droplets dispersed
in gas as the continuous phase. Flow regime depends on various parameters such as volume
fractions of the phases, densities of the phases, liquid viscosity and pressure. In petroleum,
knowing the flow regime of a multiphase flow is important in that it will help better predict
the pressure gradient and phase holdups in the pipeline for well management. The instability
of the flow caused by intermittent flow, i.e. slug flow, would impact on the measurement
accuracy of multiphase flowmeter (MPFM) since it requires pseudo steady-state flow. Prior
knowledge of multiphase flow regime would enhance MPFM’s performance. Knowing flow
regimes are beneficial to pipe system design as well. Parsi et al. [1] did several erosion exper-

© 2022 WIT Press, www.witpress.com
ISSN: 2046-0546 (paper format), ISSN: 2046-0554 (online), http://www.witpress.com/journals
DOI: 10.2495/CMEM-V10-N1-26-37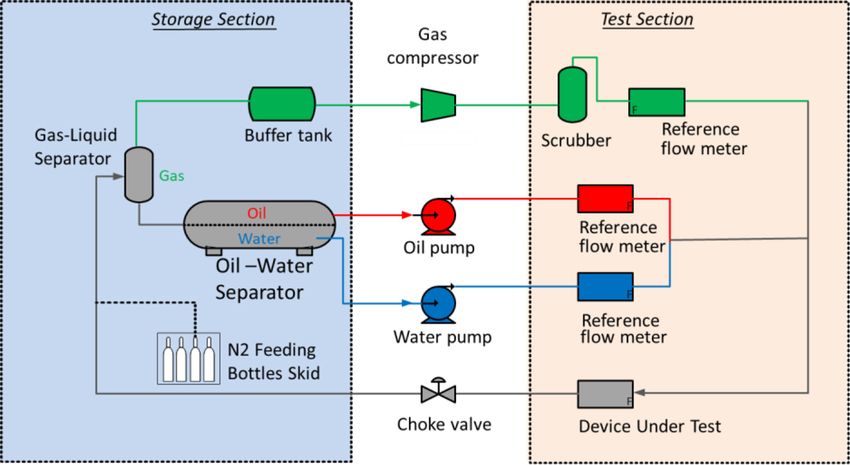
J. H. Zhu, et al., Int. J. Comp. Meth. and Exp. Meas., Vol. 10, No. 1 (2022)        27

iments and observed that the erosion in a vertical slug/churn flow is considerably higher than
that in horizontal slug/pseudo slug flow.
   In past few decades, attempts have been made to predict multiphase flow regimes by cre-
ating flow regime maps. Taitel and Dukler [2] derived a flow regime map for horizontal
two-phase flow according to a few non-dimensional parameters. Mandhane et al. [3] pro-
posed a flow regime map according to superficial velocities of liquid and gas in a horizontal
pipeline with air-water flow data. However, flow regime map requires inputs of flow proper-
ties such as flowrates of each individual phase which is often not available.
   Flow regime could also be determined by tracking the fluctuation of signals from meas-
urement sensor caused by fluctuation of phase fractions presented in the flow. A lot of
technologies have been used for flow regime detection by finding correlations between sta-
tistical features of the measurement data and actual flow regimes, such as capacitance probe,
pressure sensor, ultrasonic tomography, optical probe and microwave resonance frequency
measurement [4–8]. In above studies, flow regimes are correlated, directly or indirectly, with
the fluctuations of sensor measurements using PDF or similar statistical tool. In recent dec-
ade, machine learning techniques are further applied to the measurement data to explore
the correlation between the measurements and flow regimes mathematically [9–12]. These
studies prove that machine learning is a valid method for multiphase flow regime prediction
with fair accuracy.
   Gamma-ray-based MPFM is one of the most accurate flowmeters to measure oil-water-gas
three phase flowrates without the need of prior phase separation. As the gamma-ray sensor
directly measures the phase fractions and their dynamics, it could capture the fluctuating
patterns of the flow and thus has good potential to predict the flow regimes. Particularly, as
a flowmeter, those flow parameters that are required inputs for flow regime prediction are
usually available with MPFM. In this study, an attempt was made to derive upstream hori-
zontal multiphase flow regimes from measurements of a gamma-ray-based vertical MPFM,
using ANN modelling approach. As gamma-ray-based MPFM has been a new trending in
petroleum field, the current study would stretch its potential on flow regime detection with
no additional hardware cost.

                                      2 METHODOLOGY

2.1 Flow loop test data acquisition

A commercial MPFM (Vx Spectra 29 mm, Schlumberger) was used as measurement instru-
ment. It is a gamma-ray-based Venturi flowmeter. The measurement from Venturi provides
total flowrates of the flow, while the phase fractions of oil, water and gas phases measured
from gamma-ray sensor allow individual phase flowrate calculation from total flowrates. It is a
compact solution with only two main electrical components: multivariable transmitter (MVT)
and gamma-ray sensor. Below show the parameters measured by these two components:
                                        MVT: P, T, DP
                                    Gamma-ray sensor: CLE, CHE
where P is the line pressure of the fluid, T is the temperature of the fluid, DP is the differential
pressure between Venturi inlet and throat, CLE is the nuclear counts of low-energy level of the
28 J. H. Zhu, et al., Int. J. Comp. Meth. and Exp. Meas., Vol. 10, No. 1 (2022)
radioactive source and CHE is the high-energy level of the radioactive source. The source that
is used in Vx Spectra has three energy levels while two of them are used for phase fraction
measurement (CLE and CHE).
With inputs of densities of oil, water and gas (ρo, ρw, ρg), phase fractions of oil, water and
gas (αo, αw, αg) are derived from nuclear counts of the two energy levels.
The MPFM was tested in multiphase flow loop facility in Singapore Well Testing Centre
(SWTC, Schlumberger) to acquire data from flow of various flow regimes simulated by the
flow loop. Below shows the capacity of SWTC flow loop:
Gas rate: 5–1,140 Am3/h
Oil rate: 0.5–160 m3/h
Water rate: 0.5–160 m3/h
Pressure range: 3–28 barg
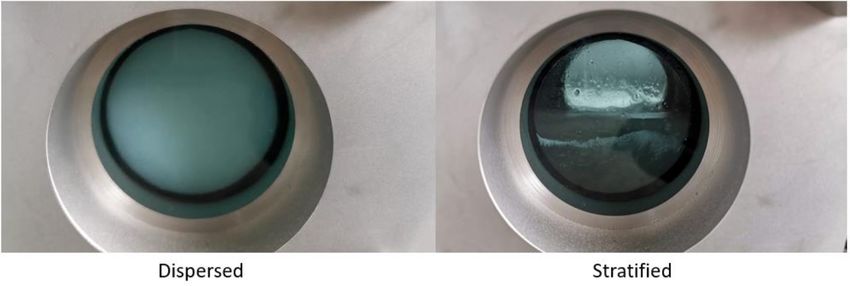
In flow loop (Fig. 1), liquid pumps are placed in single-phase oil and water lines; two two-
phase compressors are installed in the single-phase gas line. Water and oil flows are mixed
together at the liquid mixing point and then combined with gas flow at gas-liquid mixing
point to form an oil-water-gas three-phase flow. There are two parallel pipe lines with differ-
ent sizes (3″ and 6″) connected between gas-liquid mixing point and test section for devices
of different sizes. In current study, 3″ line was used for testing with the 3″ size Vx Spectra
29 mm. At upstream, from mixing point to the entrance of the device under test (DUT), the
length of pipeline is around 25 metres (equivalent to 321 D) to ensure a naturally developed
flow regime of the flow before entering DUT. After DUT, multiphase flow returns to liquid/
gas separator for liquid and gas separation and then to oil/water separator for oil and water
separation. The separated fluids are then returned to pumps (oil and water) and compressors
(gas) for recirculation.
As shown in Fig. 2, 31 gas-oil flow conditions were selected for four different flow regime
simulations according to Taitel-Dukler flow regime categorization [2]. Five test points are in
Figure 1: Schematic diagram of test setup in SWTC flow loop.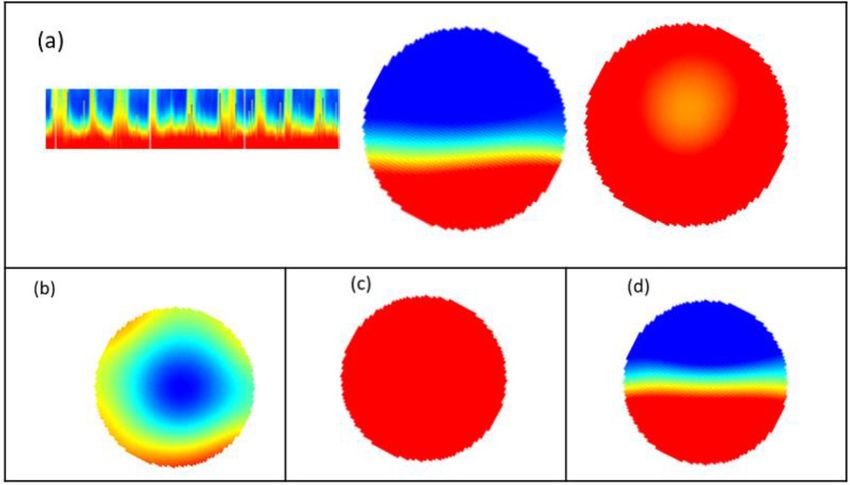
J. H. Zhu, et al., Int. J. Comp. Meth. and Exp. Meas., Vol. 10, No. 1 (2022)    29

                Figure 2: Test points on Taitel-Dukler flow regime map [2].

the regime of dispersed bubble flow, 5 in the regime of annular-dispersed liquid flow, 12 in
the regime of intermittent flow and 9 in the regime of stratified flow.

2.2 Flow regime validation

To validate the true flow regimes of proposed test points, two approaches are used. One is
from a side glass placed upstream of the DUT for flow regime visualization. Figure 3 shows
the views from side glass of dispersed bubble liquid flow and stratified flow. In a stratified
flow, gas phase and liquid phase are well separated due to gravity, and thus, the two phases
could be well identified from the side glass. In a dispersed bubble liquid flow, due to low gas
fraction and high velocity, gas and liquid phases are well mixed; hence, a uniform distribution
of the two phases is formed.
   Another approach for flow regime identification is from an electro-capacitance tomography
instrument. AC-based ECT system (ECT Instruments LTD) was used for flow visualization
of phase distribution structure over the cross section. ECT system measures capacitance
between pairs of electrodes placed over a pipe cross section. Capacitance is correlated to
permittivity of the fluid that fills between the two electrodes which reflects phase fraction

                 Figure 3: Flow phase distribution from side glass window.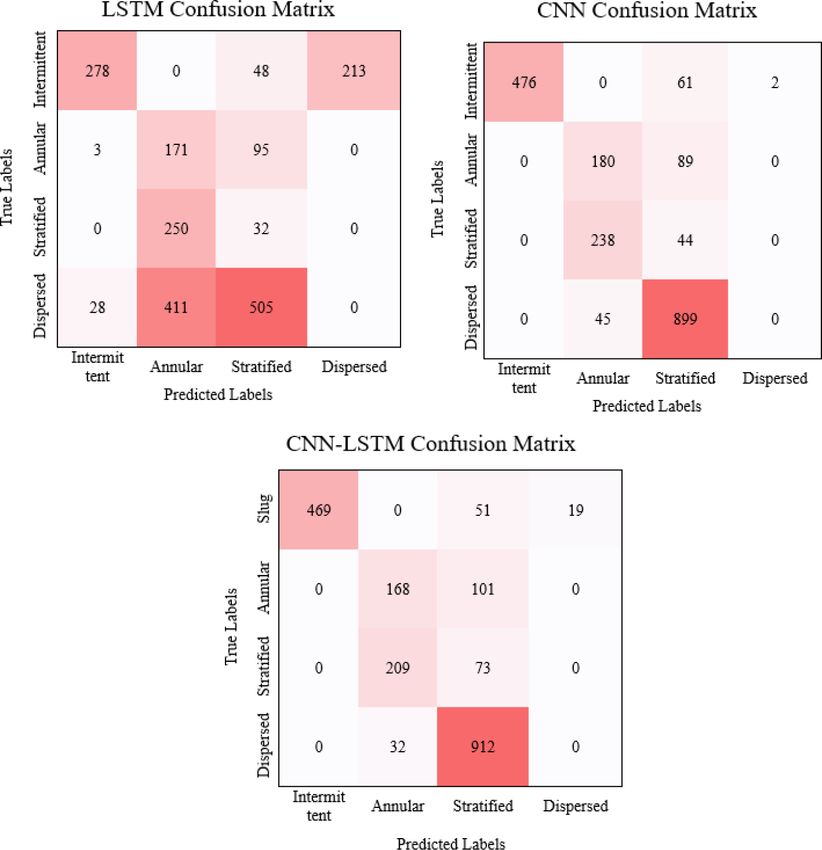
30           J. H. Zhu, et al., Int. J. Comp. Meth. and Exp. Meas., Vol. 10, No. 1 (2022)

of the fluid. With multiple pairs of electrodes, local permittivity and phase fraction could
be inverted. Tomography on phase distribution could be constructed from local fraction dis-
tribution. The tomography would then be used for flow regime analysing. Unlike side glass
visualization as a surface evaluation, ECT provides a non-intrusive way to peek on the flow
inside the pipeline. In this study, eight electrodes were placed over a cross section in the
horizontal pipe section at 6D before the entrance of the MPFM with 45 degree apart between
two adjacent electrodes.
   Figure 4 shows flow regimes detected by ECT with the four categories defined by Tait-
el-Dukler flow regime map [2]. Subplot (a) is the tomography representing intermittent flow
where the phase distribution periodically changes between liquid-rich fluid (red) and gas-
rich fluid (blue). The left side shows fraction change of liquid and gas phases with time at
cross-section centre line. The middle and right plots show phase distributions at gas-rich
instance and liquid-rich instance, respectively. Subplot (b) is an example of annular-dispersed
flow where the liquid forms a ring over the cross section and gas phase occupies the centre
of the cross section. Subplot (c) shows the dispersed bubble liquid flow where gas exists as
dispersed bubbles inside the liquid. Subplot (d) shows the stratified flow.
   According to the flow regime validation approaches described earlier, flow regimes of all
the 31 test points are confirmed to be the same as predicted from flow regime map shown in
Fig. 1.

2.3 Data pre-processing

Raw files from VxSpectra of each of the 31 test points were loaded according to actual
timeline to make a continuous waveform pattern. As mentioned earlier, the data from meas-
urement sensors of Vx Spectra contain P, T, DP, CLE and CHE. Besides above measurement
data, mixture density of the multiphase fluid was calculated as additional input as well, which
was defined as
                                        ρmix = αoρo + αgρg.                                  (1)

   Each of the 31 test points of different flow regimes contains 5- to 10-minute test data. In Vx
Spectra, gamma-ray system is reading the data at 45 Hz, while MVT at 1 Hz. Figure 5 shows the
number of data points at different flow regimes that are obtained (gamma-ray system), where
intermittent flow has most of the data points and dispersed bubble liquid flow has the least.

                          Figure 4: Flow regimes detected from ECT.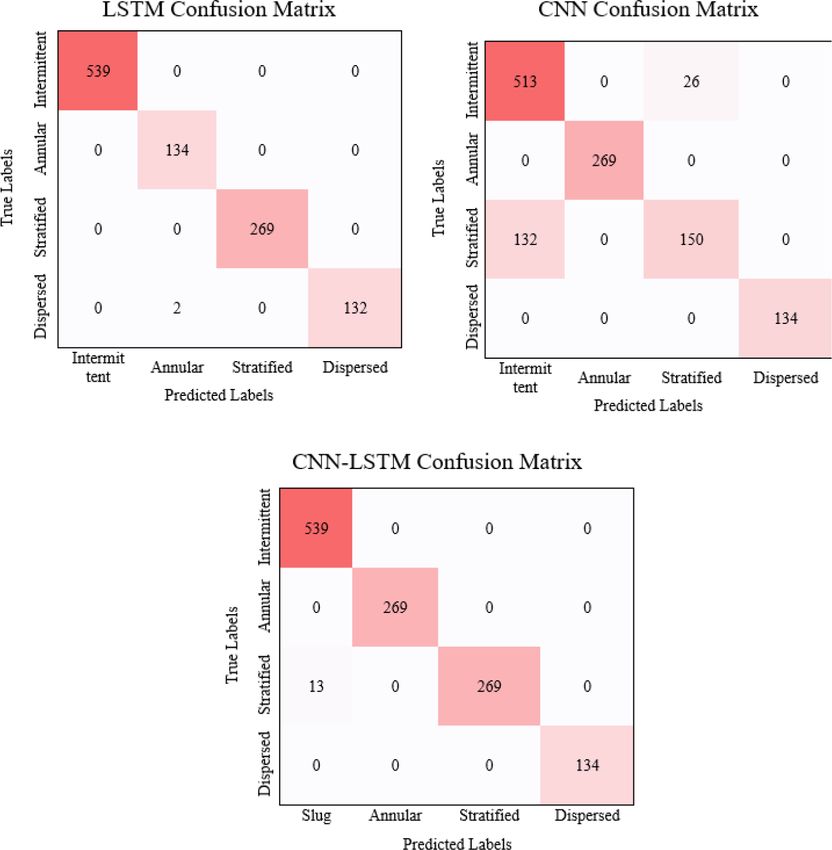
J. H. Zhu, et al., Int. J. Comp. Meth. and Exp. Meas., Vol. 10, No. 1 (2022)         31

                      Table 1: Number of data points after resampling.

 Flow regimes                    Intermittent        Annular         Stratified      Dispersed
 Number of data points           100,000             74,700          95,850          67,500

   To enhance the balance of the data among different flow regimes, down sampling of slug
class and up sampling of dispersed class were done using random Gaussian noise approach.
Table 1 shows numbers of data points after resampling, which are in the same order.
   As a first step, the data were scaled in the range of 0–10 and broken into rolling window
sequence of 200 data points with an overlap of 50% to be used as model inputs. Logarithmic
normalization was reported to significantly improve the performance and training stability
of neural network for multiphase flow pattern detection which is also applied to the data in
current study [9].
   The data were then divided into the training (80%) and validation (20%) data. Some of the
data collected was kept separated from the training and validation data to check the perfor-
mance of the model on unseen data.

2.4 Model design

The approach we took was to use the best methodology to capture time-series data, so long
short-term memory (LSTM) was selected as one of the methods. We also used convolutional
neural network (CNN) and CNN-LSTM as CNN helps to improve the training speed and
captures the spatial features effectively. Combination of CNN-LSTM was selected to try
capturing spatial and temporal features to get the best accuracy.
   CNN model was created using one-dimension convolution layers. The sequential model
had first layer of CNN with 32 filters, kernel size of 3 and activation layer as ReLU. The
next layer consisted of 16 filters, kernel size of 3 and activation layer as ReLU. The output
from second layer was passed to dropout layer and then max-pooled together and fed into the
dense layer to give output as 4 required classes using the SoftMax activation function.
   We used simple architecture of LSTM layers with dropout layer to prevent overfitting and
dense layer to consolidate the features from the input waveforms. The output of the model
was the confidence score of 4 output classes. Regularizer and Gaussian noise was added pro-

                   Figure 5: Number of data points versus flow regimes.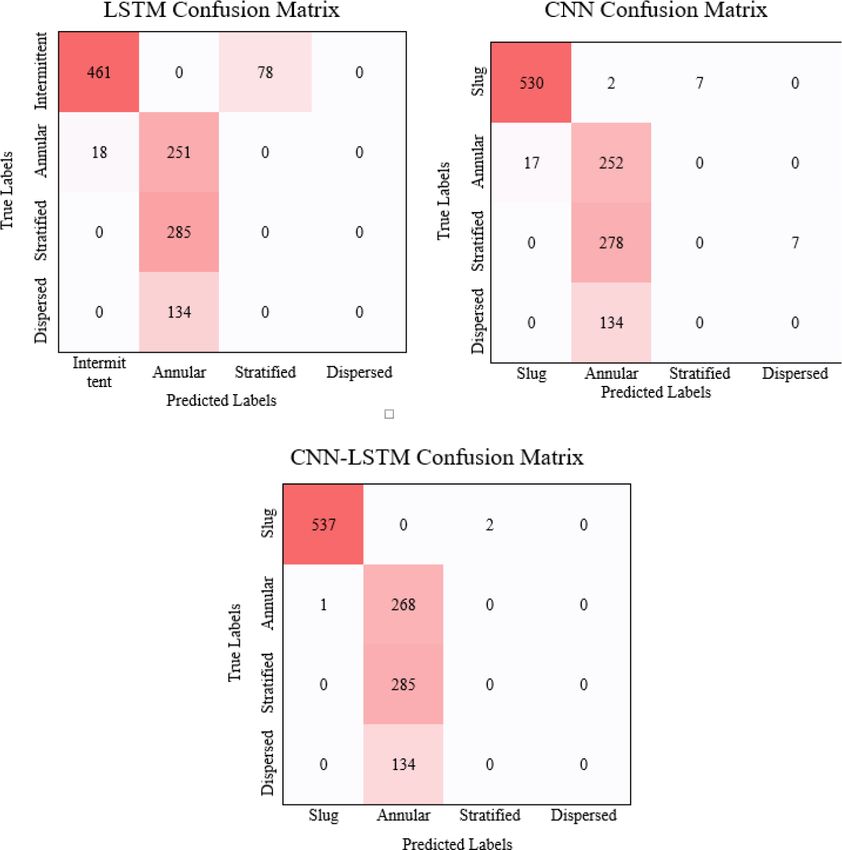
32           J. H. Zhu, et al., Int. J. Comp. Meth. and Exp. Meas., Vol. 10, No. 1 (2022)

                    Figure 6: Number of data points versus flow regimes.
gressively to generalize the model well on any kind of input waveforms. Experiments were
conducted by using these models on different input waveforms (as mentioned in Section 3)
to select the best model. The final model is as shown in Fig. 6:
   The combination of CNN and LSTM was formed by feeding the sensor input into the con-
volution layers to extract features, and the output features were fed into the dropout layer to
prevent overfitting and max-pool layer to consolidate the features. The output from max-pool
was flattened and fed into the LSTM layer which was consolidated using dense layers, and
output was obtained as 4 required classes using SoftMax activation function.

                                        3 RESULTS
Based on the above pre-processed data, extensive machine learning experiments were done
to explore model performance with various model inputs and modelling approaches. The
accuracy of the model is assessed by evaluating the proportion of test points that are correctly
categorized, such as
                     ∑ Number of samples with correct classification labels × 1000
       Accuracy =                                                                           (1)
                                   ∑Total number of samples
  First, DP, P and T were used as inputs with modelling approaches of LSTM, CNN and
CNN-LSTM. As shown in Fig. 7, with all the three modelling approaches, intermittent flow
has the highest prediction accuracy, followed by annular-dispersed and stratified flow. LSTM
outperforms CNN and CNN-LSTM with highest overall accuracy for flow regime detection
(Table 2), followed by CNN-LSTM and CNN.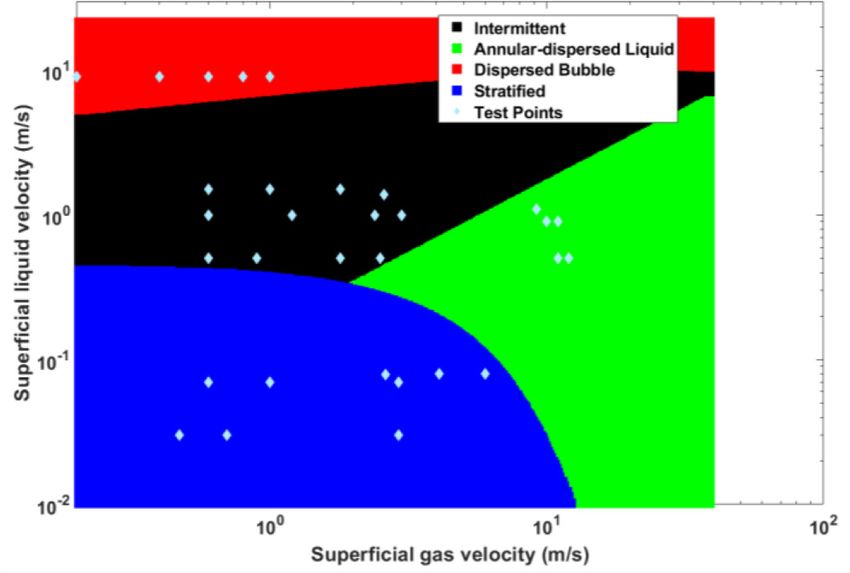
J. H. Zhu, et al., Int. J. Comp. Meth. and Exp. Meas., Vol. 10, No. 1 (2022)      33

Figure 7: Accuracy plots from LSTM, CNN, and CNN-LSTM with P, T and DP as inputs.

                Table 2: Accuracy on modelling with P, T and DP as inputs.
 Modelling approaches                    LSTM                 CNN                  CNN-LSTM
 Modelling accuracy (%)                  86.96                65.22                78.26

   In the second experiment, measurement from gamma-ray sensor was used as model inputs.
Normalization scale of 0–10 was applied to the inputs data, and LSTM, CNN and CNN-
LSTM were used as modelling approaches. In general, intermittent flow and annular flow
are well predicted. However, stratified flow and dispersed flow are poorly predicted (Fig. 8).
CNN-LSTM has the highest prediction accuracy, followed by CNN and LSTM, as shown in
Table 3.
   In another modelling experiment, gas fraction derived from gamma-ray sensor meas-
urements was used as model input. Overall, it is still intermittent and annular-dispersed
flows that are better predicted compared to stratified and dispersed bubble liquid flows
(Fig. 9 and Table 4). Among the three modelling approaches, CNN has the highest mod-
elling accuracy followed by CNN-LSTM and LSTM, which is worse than previous two
experiments.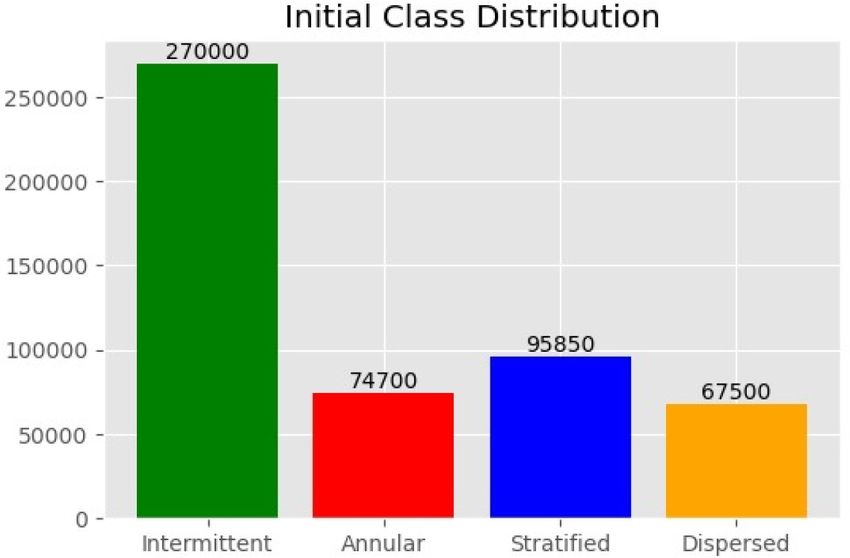
34          J. H. Zhu, et al., Int. J. Comp. Meth. and Exp. Meas., Vol. 10, No. 1 (2022)

 Figure 8: Accuracy plots from LSTM, CNN and CNN-LSTM with CLE and CHE as inputs.

                  Table 3: Accuracy on modelling with CLE and CHE as inputs.

 Modelling approaches                       LSTM               CNN                 CNN-LSTM
 Modelling accuracy (%)                     58.03              63.73               65.61

   Last attempt was done using DP and mixture density as modelling inputs. With these
approaches, all the four flow regimes are generally well predicted (Fig. 10). LSTM
provides the highest modelling accuracy (99.6%) followed by CNN-LSTM and CNN
(Table 5).
   From the above results, LSTM model provided the best accuracy and precision followed
by CNN-LSTM and CNN model subsequently. The LSTM model was selected as the model
to be deployed as not only it was the most accurate but also the size of the model was consid-
erably smaller (218 KB) than CNN-LSTM model (1,431 KB), which is a crucial factor to be
considered for deployment on edge device.
J. H. Zhu, et al., Int. J. Comp. Meth. and Exp. Meas., Vol. 10, No. 1 (2022) 35
Figure 9: Accuracy plots from LSTM, CNN and CNN-LSTM with gas fraction as input.
Table 4: Accuracy on modelling with gas fraction as input.
Modelling approaches LSTM CNN CNN-LSTM
Modelling accuracy (%) 23.65 46.41 34.91
Table 5: Accuracy on modelling with DP and mixture density as input.
Modelling approaches LSTM CNN CNN-LSTM
Modelling accuracy (%) 99.6 87.09 98.94
4 CONCLUSION
This study demonstrates that machine learning concepts such as LSTM can be effectively
applied to traditional industrial applications like estimating multiphase flow parameters to
proactively identify the flow patterns in well flows.36 J. H. Zhu, et al., Int. J. Comp. Meth. and Exp. Meas., Vol. 10, No. 1 (2022)
Figure 10: Accuracy plots from LSTM, CNN and CNN-LSTM with DP and mixture density
as input.
Inputs of the machine learning models have to be carefully selected in order to achieve
high accuracy model prediction. Inputs with mixture density and differential pressure were
proved to provide the best accuracy on flow regime prediction. Differential pressure reflects
the kinetical energy that is contained in the flow, while mixture density of the fluid provides
phase fractions which are the two essential elements to determine a flow regime: velocity and
phase fraction. This explains why it works so well.
The highest prediction accuracy is 99.6% over all the test points with four flow regimes.
This indicates that the model could be used for flow regime prediction with great accuracy.
Especially, gamma-ray-based MPFM is a well-established solution whose number keeps
growing in petroleum field. The model built could be easily applied to these MPFMs enabling
flow regime detection of upstream horizontal flow with no additional cost.
REFERENCES
[1] Parsi, M., Vieira, R., Sajeev, S.K., Mclaury, B.S. & Shirazi, S.A., Experimental study of
erosion in vertical slug/churn flow. Corrosion, 2015.J. H. Zhu, et al., Int. J. Comp. Meth. and Exp. Meas., Vol. 10, No. 1 (2022) 37
[2] Taitel, Y. & Dukler, A.E., A model for predicting flow regime transitions in horizontal
and near horizontal gas-liquid flow. AIChE Journal, 22, pp. 47–55, 1976. https://doi.
org/10.1002/aic.690220105
[3] Mandhane, J.M., Gregory, G.A. & Aziz, K., A flow pattern map for gas-liquid flow in
horizontal pipes. International Journal of Multiphase Flow, 1(4), pp. 537–553, 1974.
https://doi.org/10.1016/0301-9322(74)90006-8
[4] Omebere-lyari,N.K. & Azzopardi, B.J., A study of flow patterns for gas/liquid flow in
small diameter tubes. Chemical Engineering Research and Design, 85(2), pp. 180–192,
2007. https://doi.org/10.1205/cherd05059
[5] Lin, S. & Kew, P.A., Pressure fluctuation and flow regimes of air-water flow in
a small tube. Experimental Heat Transfer, 14(2), pp. 135–144, 2001. https://doi.
org/10.1080/08916150121275
[6] Xu, L.J. & Xu, L.A., Gas/liquid two-phase flow regime identification by ultrasonic
tomography. Flow Measurement and Instrumentation, 8, pp. 145–155, 1997. https://
doi.org/10.1016/s0955-5986(98)00002-8
[7] Mukherjee, T., Das, G. & Ray, S., Sensor-based flow pattern detection–gas-liquid-liq-
uid upflow through a vertical pipe. AIChE Journal, 60, pp. 3362–3375, 2014. https://
doi.org/10.1002/aic.14488
[8] Oon, C.S., Ateeq, M., Shaw, A., Wylie, S., AI-Shamma’a, A. & Kazi, S.N., Detection of
the gas-liquid two-phase flow regimes using non-intrusive microwave cylindrical cav-
ity sensor. Journal of Electromagnetic Waves and Applications, 30(17), pp. 2241–2255,
2016. https://doi.org/10.1080/09205071.2016.1244019
[9] Naser, M.A., Elshafei, M. & Sarkhi, A.A., Artificial neural network application for
multiphase flow patterns detection: a new approach. Journal of Petroleum Science and
Engineering, 145, pp. 548–564, 2016. https://doi.org/10.1016/j.petrol.2016.06.029
[10] Rosa, E.S., Salgado, R.M., Ohishi, T. & Mastelari, N., Performance comparison of arti-
ficial neural networks and expert systems applied to flow pattern identification in verti-
cal ascendant gas and liquid flows. International Journal of Multiphase Flow, 36(9), pp.
738–754, 2010. https://doi.org/10.1016/j.ijmultiphaseflow.2010.05.001
[11] Wu, H., Zhou, F. & Wu, Y., Intelligent identification system of flow regime of oil-gas-
water multiphase flow. International Journal of Multiphase Flow, 27(3), pp. 459–475,
2001. https://doi.org/10.1016/s0301-9322(00)00022-7
[12] Hernandez, L., Julia, J.E., Chiva, S., Paranjape, S. & Ishii, M., Fast classification
of two-phase flow regimes based on conductivity signals and artificial neural net-
works. Measurement Science and Technology, 17, pp. 1511–1521, 2006. https://doi.
org/10.1088/0957-0233/17/6/032You can also read