Wheat Outlook: March 2022 - Andrew Sowell, coordinator Bryn Swearingen, contributor - USDA ERS
←
→
Page content transcription
If your browser does not render page correctly, please read the page content below
Economic Research Service | Situation and Outlook Report

                                     WHS-22c | March 11, 2022                                     Next release is April 12, 2022

Wheat Outlook: March 2022
Andrew Sowell, coordinator                                                   In this report:
                                                                             - Domestic Outlook
Bryn Swearingen, contributor                                                 - International Outlook

U.S. Wheat Prices Surging
Wheat prices are surging globally in the wake of the conflict between Russia and Ukraine. Prior to this
development, prices were already elevated, influenced by relatively tight supplies in key exporting
countries. Major exporter ending stocks (Argentina, Australia, Canada, the European Union,
Kazakhstan, Russia, Ukraine, and the United States) are collectively projected as the lowest since
2012/13. Prices are surging even higher as the conflict is raising significant questions about the ability
of Russia and Ukraine to continue exporting. U.S. prices have been particularly underpinned by this
development with quotes for Hard Red Winter (HRW) and Soft Red Winter (SRW) commanding the
largest price increases (up more than 80 percent from last year) as these classes are the most directly
in competition with Russian and Ukrainian wheat. HRW prices have also been impacted by concerns of
drought in major producing areas. U.S. Hard Red Spring (HRS), typically the highest priced U.S. wheat,
is currently priced lower than both HRW and SRW (figure 1).

Figure 1
U.S. wheat export prices on selected dates
 Dollars per metric ton
    550
    500
    450
    400
    350
    300
    250
    200
                       HRW, Gulf*                            SRW, Gulf*                      HRS, Pacific Northwest*
                                                 3/8/2021     2/8/2022  3/8/2022
 *All quotes are freight-on-board. HRW = Hard Red Winter, 11.5 percent protein. SRW = Soft Red Winter. HRS = Hard Red
 Spring, 14 percent protein. The price quote for HRS refers to Dark Northern Spring (DNS), a subclass of HRS.
 Source: International Grains Council.

 Approved by USDA’s World Agricultural Outlook Board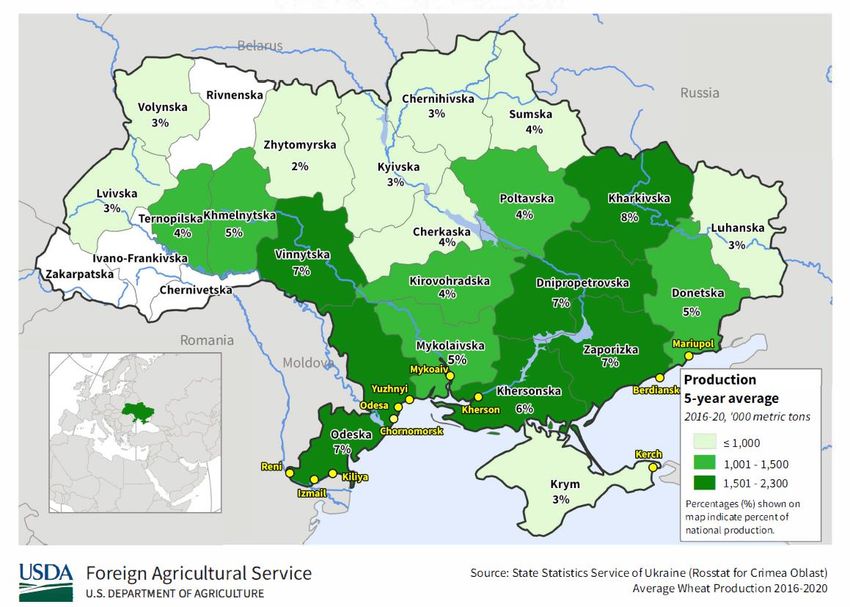
Domestic Outlook
Domestic Changes at a Glance:

•   The 2021/22 all-wheat export forecast is reduced 10 million bushels to 800 million on a
    weak pace of export sales and shipments to date, combined with sharp price increases for
    U.S. wheat in recent months. Major competitor wheat prices have also surged given the
    conflict between Russia and Ukraine, but U.S. wheat prices have remained at a steep
    premium to other key origins, with additional support from continued drought conditions in
    major Hard Red Winter (HRW) producing states (further details in later section).
•   Official exports for June 2021 through January 2022 total 553 million bushels, down 16
    percent from the same period last year, based on calculations from U.S. Bureau of the
    Census data. This 8-month total is 69 percent of the revised marketing year (June-May)
    projection. Export sales (both new sales and shipments) have remained slow throughout
    February, as reported by USDA’s Foreign Agricultural Service (FAS) in the U.S. Export
    Sales report.
•   Projected exports for both HRW and Soft Red Winter (SRW) exports are lowered 5 million
    bushels each to 320 million and 115 million, respectively. These two classes are the most
    impacted by recent price increases.
•   The 2021/22 all-wheat import forecast is reduced 5 million bushels to 95 million based on a
    lower-than-expected pace. Imports during June-January total 63 million bushels, down 14
    percent from the same period last year.
       o   U.S. imports of Hard Red Spring (HRS) are reduced 5 million bushels to 40. Imports
           of this class during June through January total 27 million bushels, representing 68
           percent of the revised marketing year projection for this class.
       o   Projected U.S. Durum imports were not adjusted this month. Durum imports total 26
           million bushels during June-January, representing 65 percent of the marketing year
           forecast of 40 million bushels.
•   The 2021/22 season-average farm price is raised $0.20 per bushel to $7.50 based on the
    strong farmgate prices through January as reported in the February 28 National Agricultural
    Statistics Service (NASS) Agricultural Prices. The January 2022 all-wheat farmgate price
    was estimated at $8.48, which is down slightly from $8.58 in December 2021, but well above
    the $5.48 for January 2021. Futures prices have soared in recent weeks mainly based on
    global trade disruptions related to the Russia-Ukraine conflict, but the full effect of these

                                                2
                        Wheat Outlook: March 2022, WHS-22c, March 11, 2022
                                USDA, Economic Research Service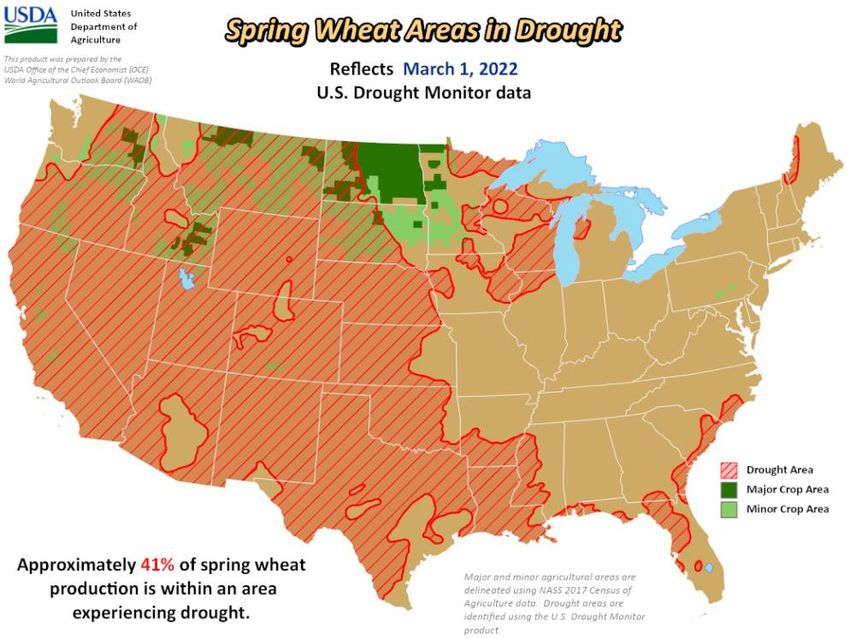
increases is not yet reflected in cash prices in many locations. These recent price
       movements are dampened as a significant majority of wheat marketings have been
       completed this marketing year (MY). On average in the last five years, about 83 percent of
       wheat is marketed in the first 8 months of the MY.
•      The major changes to the U.S. all-wheat balance sheet are summarized in table 1.

    Table 1
    U.S. wheat supply and use at a glance 2021/22 (in million bushels)
                                                                                 2021/22
      Balance             2020/21           2021/22           2021/22            Change
                                                                                                            Comments
     sheet item            March           February            March            month-to-
                                                                                  month
                                                                                                       June-May marketing
    Supply, total
                                                                                                              year
     Beginning
                            1,028              845               845
       stocks
     Production             1,828             1,646             1,646
                                                                                                     Lower imports of Hard Red
       Imports               100               100                95                  -5             Spring (HRS) on weak pace
    Supply, total           2,957             2,591             2,586                 -5
    Demand
         Food                961               959               959
        Seed                  64                64                64
      Feed and
                              95               110               110
       residual
      Domestic,
                            1,120             1,133             1,133
         total
                                                                                                     High U.S. prices are
                                                                                                     expected to reduce
       Exports               992               810               800                 -10             competitiveness in some
                                                                                                     markets
      Use, total            2,111             1,943             1,933                -10
       Ending                                                                                        Ending stocks still lowest
                             845               648               653                  +5             since 2013/14
       stocks
                                                                                                     USDA, National Agricultural
      Season-                                                                                        Statistics Service price data
                                                                                                     through January and
    average farm            $5.05             $7.30             $7.50              +$0.20            expectations for continued
        price                                                                                        strong futures and cash
                                                                                                     prices in the coming months
    Source: USDA, World Agricultural Outlook Board World Agricultural Supply and Demand Estimates.

                                                       3
                               Wheat Outlook: March 2022, WHS-22c, March 11, 2022
                                       USDA, Economic Research Service
U.S. Exports Reduced on Pace and High Prices
U.S. export commitments (the sum of total accumulated exports and outstanding sales) as of
February 24 represent around 84 percent of the revised 2021/22 marketing year export forecast
(figure 2).1 This percentage is below the 5-year average of 88 and indicates that a larger-than-
normal percentage of sales are yet to be accounted for in order for the United States to reach
even the revised marketing year export forecast. There is increasing uncertainty in global wheat
trade regarding the effects of the ongoing conflict between Russia and Ukraine. With global
wheat prices historically elevated and volatile, it is expected that importers will ration demand by
at least delaying some purchases. It is also possible that some importers may eventually turn to
U.S. wheat when other exporters lack sufficient supplies. However, the current large price
premium for U.S. wheat over other key competitors (discussed in the international section of this
report) reduces the likelihood of a significant pivot towards U.S. wheat in the near-term.
Weighing these considerations, U.S. exports have been lowered 10 million bushels to 800
million this month, which would be the lowest U.S. exports since 2015/16.
Figure 2
Cumulative exports sales through February 24 and full marketing year exports
Million metric tons Percent
35 89
30 88
87
25
86
20
85
15
84
10
83
5 82
0 81
2015/16 2016/17 2017/18 2018/19 2019/20 2020/21 2021/22 (F)
Accumulated exports Outstanding sales Shipments remaining Percent of full marketing year
Note: Accumulated exports and outstanding sales are as of week 39, exact dates vary by year. Shipments remaining is the
difference between total commitments as of that date and the full marketing year exports.
Source: USDA, Economic Research Service calculations; USDA, Foreign Agricultural Service, Export Sales Reporting.
1
Note that this comparison is between USDA/FAS Export Sales data and official USDA forecasts for the
full marketing year. The official marketing year forecasts (as well as final data) are calculated with flour
and product trade included (converted to grain equivalent).
4
Wheat Outlook: March 2022, WHS-22c, March 11, 2022
USDA, Economic Research ServiceDrought Update
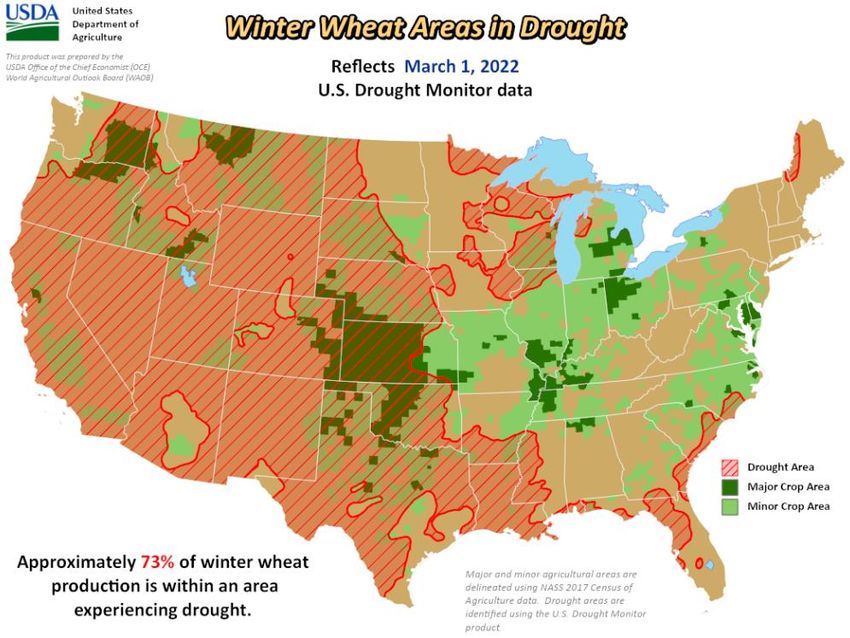
According to USDA analysis and data from U.S. Drought Monitor, 73 percent of U.S. winter
wheat areas are in areas of drought as of March 1 (figure 3), up slightly from what was reported
last month in the Wheat Outlook publication. Much of this area covers key HRW growing
regions of western Kansas, Colorado, Oklahoma, and Texas. The effect of dry conditions during
winter wheat dormancy is evident in the USDA/NASS Crop Condition ratings, which show that
conditions in key states have deteriorated in the last few months. As of March 6, 24 percent of
winter wheat in Kansas is rated as being in good or excellent conditions, compared with 62
percent as of November 28. For Oklahoma, only 15 percent of the winter wheat is in good or
excellent condition, compared with 48 percent on November 28. Conditions in Texas are only
rated 7 percent good or excellent, compared with 20 percent on November 28. Further, much of
the White wheat production area in the Pacific Northwest is still experiencing prolonged drought.
However, spring weather conditions will have a larger effect on the 2022 wheat crop and winter
conditions alone are not a reliable determinant of harvest potential.
5
Wheat Outlook: March 2022, WHS-22c, March 11, 2022
USDA, Economic Research ServiceFigure 3
Large portions of winter wheat area in drought
Notes: This product was prepared by the USDA, Office of the Chief Economist (OCE), World Agricultural Outlook Board (WAOB).
Major and minor agricultural areas are delineated using National Agricultural Statistics Service (NASS) 2017 Census of Agriculture
data. Drought areas are identified using the U.S. Drought Monitor product.
Source: USDA, World Agricultural Outlook Board, Agricultural Weather and Assessments Group.
Conversely, the conditions for Spring wheat areas have improved from last month. The percent
of production located in areas of drought has reduced from 55 to 41 percent with large portions
of North Dakota and Eastern Minnesota not reporting drought conditions (figure 4).
6
Wheat Outlook: March 2022, WHS-22c, March 11, 2022
USDA, Economic Research ServiceFigure 4
Spring wheat areas in drought
Notes: This product was prepared by the USDA, Office of the Chief Economist (OCE), World Agricultural Outlook Board (WAOB).
Major and minor agricultural areas are delineated using National Agricultural Statistics Service (NASS) 2017 Census of Agriculture
data. Drought areas are identified using the U.S. Drought Monitor product.
Source: USDA, World Agricultural Outlook Board, Agricultural Weather and Assessments Group.
7
Wheat Outlook: March 2022, WHS-22c, March 11, 2022
USDA, Economic Research ServiceInternational Outlook
Overview of the 2021/22 Global Wheat Market
For 2021/22, global wheat production is up 2.1 million metric tons (MT) to 778.5 million as
Australia is projected to have a larger crop than expected based on an updated government
estimate and is the second-consecutive record. The European Union is up slightly with a
100,000 MT increase to Poland as yields were higher than expected. Based on final
government data, Russian production is lowered 342,000 MT to 75.2 million with much of the
change coming from winter wheat. Winter wheat production is lowered 306,000 MT to 52.2
million as the decrease in yield offsets the increase in area harvested. Table 2 shows an
overview of the global balance sheet for the 2021/22 trade year.
Table 2
Global trade year wheat balance sheet, March 2022 (in million tons)
2020/21 2021/22 2021/22 2021/22 Change
Balance sheet item
March February March month to month
Supply
Beginning stocks 296.8 289.9 290.3 0.4
Production 776.0 776.4 778.5 2.1
Trade year imports 194.9 204.6 201.1 -3.5
Supply, total 1,267.6 1,271.0 1,270.1 -1.0
Demand
Feed and residual use 157.7 160.7 162.1 1.5
Food, seed, and industrial use 617.0 625.5 623.3 -2.2
Domestic, total use 774.7 786.1 785.4 -0.7
Trade year exports 198.7 208.4 204.8 -3.6
Use, total 1,267.6 1,271.0 1,270.1 -1.0
Ending stocks 290.3 278.2 281.5 3.3
Source: USDA, Economic Research Service; USDA, Foreign Agricultural Service, Production, Supply, and Distribution database.
As the Russia-Ukraine conflict continues, the global wheat market is experiencing historically
high global prices. Average monthly freight-on-board (FOB) bids for major wheat exporters have
surged amid the Russian-Ukraine conflict (figure 5). As of March 8, the United States (U.S.) had
the highest average March FOB bid out of the major exporters while Australia posted the lowest,
excluding Russia and Ukraine whose prices are dampened by lack of purchases, ability to
export, and depreciation of currency. The U.S. average March FOB bid is 85 percent higher
than last March as lower production in 2021/22 put additional upward pressure on price. With a
8
Wheat Outlook: March 2022, WHS-22c, March 11, 2022
USDA, Economic Research Servicerecord 2021/22 crop, the Australian bid only rose 40 percent compared to last March. In
previous years, when production was sufficient, the United States was more price competitive in
the market. Given the current conditions, however, U.S. wheat is less likely to gain demand from
importers that can get supplies from lower-price sources, such as Australia or India.
Figure 5
International average monthly freight-on-board bids, June 2015–March 2022
Dollars per ton
550 Argentina
500
Australia
450
400 Canada
350 European
300 Union
250 Russia
200 Ukraine
150
United
100 States
Notes: Freight-on-board (FOB) quotes calculated as monthly averages, March 2022 partial average through March 8,
Quotes used: Argentina - 12.0 percent, Up River; Australia - average of APW (Kwinana, Newcastle, and Port Adelaide); Canada
- CWRS (13.5 percent) St. Lawrence; European Union - France grade 1; Russia - Milling 12.5 percent; Ukraine -primary artery for wheat exports for both Ukraine and Russia. Along with decreased trade flows
through the Black Sea, Russia is facing financial sanctions that creates an unstable banking
system as well as depreciating the value of the Russian ruble. All of these factors contribute to
expectations of substantial disruptions in exports for both countries, although some trade may
continue by rail to nearby markets. Russia will also be able to export some shipments via the
Caspian Sea to markets such as Iran, but the ramifications of financial sanctions still loom large.
With substantial disruptions to trade in this region, part of the global demand will be picked up
by India and Australia, who have ample tradable supplies and are competitively priced.
Figure 6
Ukraine port locations and wheat production by oblast, 2016–20
Indian trade year (TY) exports are adjusted up 3.0 million MT to a record 10.0 million. In
previous periods of tight supplies and higher prices, India was able to step up and export to
additional markets. With a record production, Australia will export an additional 1.0 million MT
to 27.0 million MT this TY. Along with higher production, Australia remains the most price
competitive among the major exporters with an average March freight on board (FOB) quote of
$390 per ton. TY exports from Canada and Brazil are also forecasted up 0.3 and 0.2 million
tons, respectively, as higher global prices provide extra incentives to export.
10
Wheat Outlook: March 2022, WHS-22c, March 11, 2022
USDA, Economic Research ServiceWith global exports down 3.6 million MT to 204.8 million, major wheat importers will have to
ration demand if they are unable to find alternative suppliers or willing to pay the higher prices.
Egypt is one of the major importers of both Russian and Ukrainian wheat. In the 2020/21 trade
year, Egypt accounted for 15 percent of Ukraine’s wheat exports and 21 percent of Russia’s
shipments. Egypt has canceled their two latest tenders due to high prices and lack of offers.
Egypt is likely to delay shipments and wait for harvest to begin in mid-April. Imports for Egypt
are revised down 0.5 million MT to 12.5 million. In 2020/21, Turkey accounted for 18 percent of
Russian exports. Rising global prices and the depreciation of the Turkish lira (down 48 percent
year-over-year relative to the U.S. dollar) will make it very difficult for Turkey to continue to
import wheat. Turkey imports are lowered 1.0 million MT to 10.0 million. For more information
refer to the March 2022 Grain: World Markets and Trade by the Foreign Agricultural Service.
Outside the major importers, the European Union imports are lowered 0.4 million MT to 4.8
million as they were behind trend import pace. Kenya, Sudan, Tanzania, and North Korea
imports are lowered 0.2 million MT each as slow shipments have put them behind pace of the
previous projection and higher wheat prices are expected to reduce purchases. While Algeria
remains active in their tenders, imports are reduced by 0.2 million MT to 7.5 million with the
expectation that they will try to ration demand amid these high prices. Imports for Tunisia are
expected lower (-0.1 million MT to 1.8 million MT) as they rejected all offers of their recent
tender for wheat as the price was regarded as too high. Russia imports are reduced 0.2 million
MT to 0.3 million based on lower-than-expected imports from Kazakhstan.
Offsetting part of these revisions is an increase in imports for Belarus (+300,000 MT to
400,000) and Kazakhstan (+200,000 MT to 1.4 million) as they are a part of the Eurasian
Economic Union (EAEU) which is excluded from the Russian wheat export quota and can
receive imports by rail. Vietnam is also revised up 300,000 MT to 4.1 million MT as they are
expected to import more feed-quality wheat from Australia. Table 3 displays all the trade
changes for the 2021/22 trade year.
11
Wheat Outlook: March 2022, WHS-22c, March 11, 2022
USDA, Economic Research Service2021/22 Global Wheat Consumption Down
With global trade reduced, consumption of wheat is revised down 0.7 million MT to 787.3
million. Food, seed, and industrial (FSI) use is lowered (-2.2 million MT to 623.3 million) with
partially offsetting reductions to feed and residual use (+1.5 million MT to 162.1 million). FSI use
is lowered for quite a few countries as importers demand ration amid higher prices and other
exporters decrease their FSI use to increase exports to meet the import demand. Most notably,
FSI use in India is lowered 0.8 million MT to 96.5 million as they increase exports to the global
market.
12
Wheat Outlook: March 2022, WHS-22c, March 11, 2022
USDA, Economic Research ServiceFeed and residual use partially offset these reductions with an increase of 1.5 million MT to
162.1 million as part of the grain in Ukraine is expected to be lost as a result of the conflict. With
higher production, more grain is allocated to feed and residual in Australia (+0.5 million MT to
5.5 million). Vietnam is importing more feed quality wheat from Australia resulting in more going
into feed and residual (+0.3 million MT to 1.7 million). As a result of lower expected supplies,
Turkey feed and residual is adjusted down 0.3 million MT to 2.3 million.
An adjustment is also made to total consumption based on the local marketing year (MY) trade
adjustments for 2021/22. The unaccounted trade is remains steady (-96,000 MT) at 1.8 million
MT as MY exports and imports were lowered by relatively similar magnitudes. By adding this
updated calculation of unaccounted trade to total consumption, the total adjusted consumption
in 2021/22 is projected at 787.3 million MT.
Global Ending Stocks Raised 3.3 Million MT
Global ending stocks are higher this month (+3.3 million MT to 281.5 million) as the increase for
major exporters’ ending stocks offsets the reduction for other exporting and importing countries.
Major exporters’ ending stocks are projected to increase 5.0 million MT to 56.0 million as
Ukraine and Russia are unable to export their supplies. Ukraine’s ending stocks are up 3.0
million MT to 5.0 million and Russia is up 2.5 million MT to 13.1 million. These revisions were
partially offset with reductions for Canada (-0.2 million MT to 2.9 million), the European Union
(-0.3 million MT to 9.6 million), and Australia (-0.2 million MT to 4.3 million). Major exporters’
ending stocks remain the tightest since 2012/13, despite the additional stocks for Ukraine,
Russia, and the United States (+0.1 million MT to 17.8 million). Figure 7 shows the major
exporters’ ending stocks with Russia and Ukraine rising the most in 2021/22.
Outside the major exporting countries, India is revised down 0.7 million MT to 25.4 million as
exports are higher than expected. With lower imports, importing countries will rely on their
stocks for part of their decrease in supply. Algeria, Egypt, Pakistan, Sudan, and Turkey all
are expected to see tighter supplies going into the 2022/23 trade year.
13
Wheat Outlook: March 2022, WHS-22c, March 11, 2022
USDA, Economic Research ServiceFigure 7
Major exporters' ending stocks, 2016/17 to 2021/22
Million metric tons
80
70
60
United States
50
Ukraine
Russia
40
Kazakhstan
30 European Union
Canada
20 Australia
Argentina
10
-
2016/17 2017/18 2018/19 2019/20 2020/21 2021/22
Source: USDA, Economic Research Service; USDA, Foreign Agricultural Service, Production, Supply, and Distribution database.
14
Wheat Outlook: March 2022, WHS-22c, March 11, 2022
USDA, Economic Research ServiceSuggested Citation
Sowell, Andrew R. and Bryn Swearingen. Wheat Outlook: March 2022, WHS-22c, U.S. Department of
Agriculture, Economic Research Service, March 11, 2022.
Use of commercial and trade names does not imply approval or constitute endorsement by USDA.
In accordance with Federal civil rights law and U.S. Department of Agriculture (USDA) civil rights regulations and
policies, the USDA, its Agencies, offices, and employees, and institutions participating in or administering USDA
programs are prohibited from discriminating based on race, color, national origin, religion, sex, gender identity
(including gender expression), sexual orientation, disability, age, marital status, family/parental status, income derived
from a public assistance program, political beliefs, or reprisal or retaliation for prior civil rights activity, in any program
or activity conducted or funded by USDA (not all bases apply to all programs). Remedies and complaint filing
deadlines vary by program or incident.
Persons with disabilities who require alternative means of communication for program information (e.g., Braille, large
print, audiotape, American Sign Language, etc.) should contact the responsible Agency or USDA's TARGET Center
at (202) 720-2600 (voice and TTY) or contact USDA through the Federal Relay Service at (800) 877-8339.
Additionally, program information may be made available in languages other than English.
To file a program discrimination complaint, complete the USDA Program Discrimination Complaint Form, AD-3027,
found online at How to File a Program Discrimination Complaint and at any USDA office or write a letter addressed to
USDA and provide in the letter all of the information requested in the form. To request a copy of the complaint form,
call (866) 632-9992. Submit your completed form or letter to USDA by: (1) mail: U.S. Department of Agriculture,
Office of the Assistant Secretary for Civil Rights, 1400 Independence Avenue, SW, Washington, D.C. 20250-9410;
(2) fax: (202) 690-7442; or (3) email: program.intake@usda.gov.
USDA is an equal opportunity provider, employer, and lender.
15
Wheat Outlook: March 2022, WHS-22c, March 11, 2022
USDA, Economic Research ServiceYou can also read