CEVA Logistics AG - Investor Call Third Quarter/First 9 Months 2018 - 13 November 2018

Page created by Stanley Morgan
 
CONTINUE READING
CEVA Logistics AG - Investor Call Third Quarter/First 9 Months 2018 - 13 November 2018
CEVA Logistics AG – Investor Call
    Third Quarter/First 9 Months 2018

    13 November 2018

1       CEVA Logistics AG – Q3 2018
CEVA Logistics AG - Investor Call Third Quarter/First 9 Months 2018 - 13 November 2018
Highlights Third Quarter of 2018

     Revenue up 4.7% year on year in constant currency
     FM growth +6.8% in constant currency, with good Ocean volumes and flat in Air
     CL growth +2.8% in constant currency
     Adjusted EBITDA down US$30 million in Q3 / Q3 EBITDA negatively impacted by
     Italy CL (US$ -26 million) out of which US$20 million one-time provisions
     Progress on many strategic initiatives / Excellence & cost-saving programs
     intensified
     Strong new business momentum
     Broadening of CMA CGM partnership

 2     CEVA Logistics AG – Q3 2018
CEVA Logistics AG - Investor Call Third Quarter/First 9 Months 2018 - 13 November 2018
Highlights First Nine Months of 2018

     Revenue up 5% year on year in constant currency
       - FM growth +6.9% in constant currency,
       - CL growth +3.4% in constant currency,
     Adjusted EBITDA down US$8 million year on year, in constant currency
     EBITDA negatively impacted by Italy CL (US$ -42 million)
     Strong new business momentum
     Refinancing now complete

 3     CEVA Logistics AG – Q3 2018
CEVA Logistics AG - Investor Call Third Quarter/First 9 Months 2018 - 13 November 2018
Strengthened Partnership with CMA-CGM

CEVA Logistics broadens strategic partnership with CMA CGM

                                   CEVA Logistics and CMA CGM have agreed that
                                   CEVA Logistics will remain a listed company with an
                                   arm's length business relationship with CMA CGM
                                   Partnership with CMA CGM opening more
                                   opportunities than expected
                                   Synergies between CEVA and CMA CGM under
                                   review, new medium-term guidance to be
                                   disclosed
                                   CMA CGM will offer to CEVA Logistics' shareholders
                                   wishing to exit their investment in CEVA Logistics to
                                   purchase their shares for CHF 30.00 per share

 4   CEVA Logistics AG – Q3 2018                                    The photo is credited to CMA CGM
CEVA Logistics AG - Investor Call Third Quarter/First 9 Months 2018 - 13 November 2018
Agenda

                                   1   Business Update and Strategic Progress

                                   2   Q3/9M 2018 Financial Results

                                   3   Outlook

 5   CEVA Logistics AG – Q3 2018
CEVA Logistics AG - Investor Call Third Quarter/First 9 Months 2018 - 13 November 2018
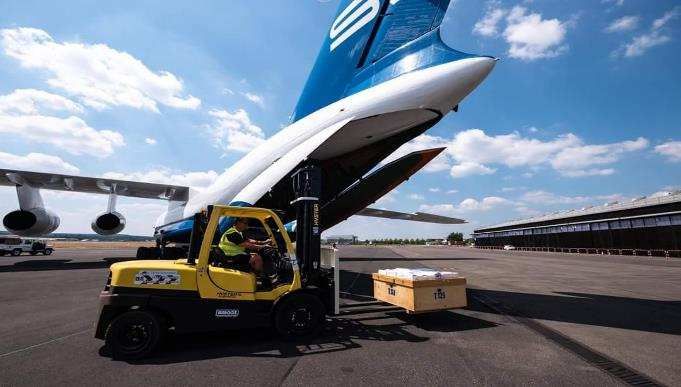
Business Development Momentum

     Investments in Sales, e.g. headcount increase by 10%, to accelerate sustainable
     growth in strategic geographies and segments
     Continued strong momentum across all business lines
     New Business wins up nearly 8% YTD across all Freight Management products,
     with highest growth in Ocean, and in Contract Logistics
     Significant new contracts and extensions won in Q3:
       - Several >US$10 million new Air and Ocean freight contracts in Technology
          and Automotive and >US$10 million new contracts in Contract Logistics in
          Automotive, Healthcare, Consumer & Retail

 6     CEVA Logistics AG – Q3 2018
CEVA Logistics AG - Investor Call Third Quarter/First 9 Months 2018 - 13 November 2018
Business line overview: Freight Management

                                                           Q3 Highlights
                                                           Air
                                                                 Overall flat volumes with strong performance on Intra Asia and
                                                                 Far East westbound trade lanes
                                                                 Further productivity improvements resulting in a 6.6%
                                                                 improvement in Files/Operator ratio during the first nine months
                                                           Ocean
                                                                 Good volumes with significant growth out of India, Middle East
                                                                 and Southeast Asia
                                                                 Productivity gains through increased focus and standardization:
Key Figures                                                      Files/Operator ratio improved by 5.4% in the first nine months
                                       Q3 2018   YoY %
(in US$ m unless otherwise stated)
                                                           Ground
Air tons (‘000)                         123       -0.2%
                                                                 North America driver shortage resulting in approx. 25% rise YoY
Air NR/t (US$)                          656       -0.2%          in cost per mile for independent contractors
Ocean TEUs (‘000)                       204      +6.3%           Cost increase not fully mitigated by price increases and creating
Ocean NR/TEU (US$)                      262       -7.1%          a US$3 million impact on EBITDA

Revenue                                 881      +6.8%*    Other FM

EBITDA                                   22      -12.0%*         Improved performance in US VAS (US$7 million improvement
                                                                 YTD in EBITDA)
EBITDA Margin                           2.5%     -50bps*

  * At constant FX
  7      CEVA Logistics AG – Q3 2018
CEVA Logistics AG - Investor Call Third Quarter/First 9 Months 2018 - 13 November 2018
Quarterly Air and Ocean Volume and Yield Development

                Air export volumes (t) quarterly growth (YoY, in %)          Yield: Net Revenue/t (US$)
                   15,6                                                                                   772
                           11,8                                                        657                      711     656
                                     10,2                                      641             626

                                             1,6                     ~2%

                                                     -1,3    -0,2
                  Q2 17   Q3 17     Q4 17   Q1 18   Q2 18   Q3 18   Market    Q2 17   Q3 17   Q4 17   Q1 18     Q2 18   Q3 18
                                                                    Q3 18*
                Volumes (thousand t)
                 121.8    122.9     129.6   107.3   120.2   122.6

                Ocean volumes (TEU) quarterly growth (YoY, in %)             Yield: Net Revenue/TEU (US$)

                                                                               289     282     266        285   274     262
                                     6,9     8,5     8,3
                                                             6,3
                   3,5     2,8                                      2-3%

                  Q2 17   Q3 17     Q4 17   Q1 18   Q2 18   Q3 18   Market    Q2 17   Q3 17   Q4 17   Q1 18     Q2 18   Q3 18
                                                                    Q3 18*
                Volumes (thousand TEU)
                 180.0    192.4     189.1   181.6   194.9   204.5

 * Company’s estimate

 8    CEVA Logistics AG – Q3 2018
CEVA Logistics AG - Investor Call Third Quarter/First 9 Months 2018 - 13 November 2018
Update on Tariffs

     US-China trade for CEVA (combined east-and-westbound) represents 14% of Air &
     Ocean revenues
     The contemplated tariff increase on US$200 billion of goods should not affect
     more than 13% of our business in the US-China trade lane, driven in particular by
     Consumer & Retail
     Switching procurement from China to alternative countries in Southeast Asia (e.g.
     Vietnam, Cambodia, Myanmar, Thailand) will likely shift volumes over time from
     CEVA China to CEVA operations in those countries
     Internal consumption in China affected

 Base: H1 2018 revenues

 9     CEVA Logistics AG – Q3 2018
CEVA Logistics AG - Investor Call Third Quarter/First 9 Months 2018 - 13 November 2018
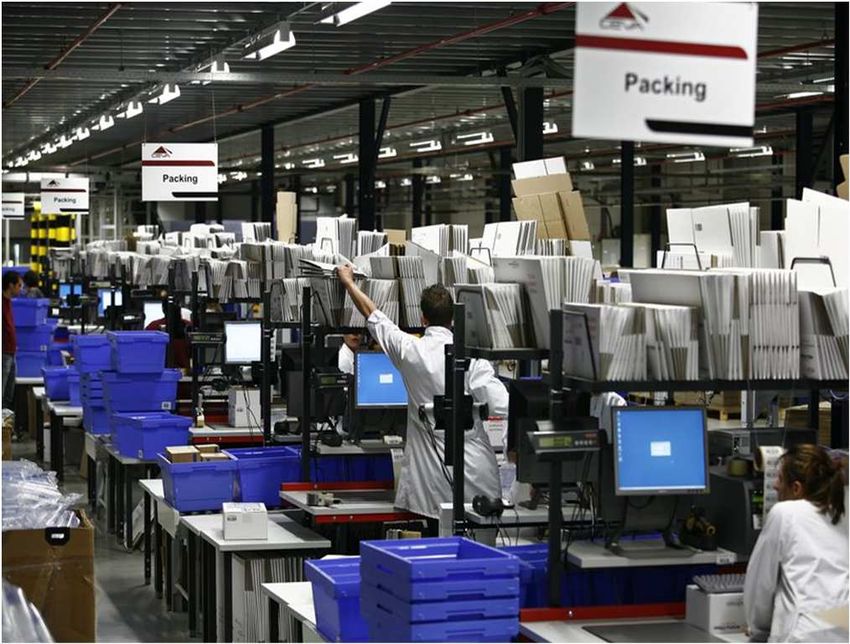
Business line overview: Contract Logistics

                                                            Q3 Highlights
                                                               Good volumes across existing contract portfolio and
                                                               implemented new businesses, e.g., Consumer, Retail,
                                                               e-commerce and Healthcare
                                                               Productivity improvements across contracts and
                                                               clusters, continued productivity gains at focus
                                                               contracts:
                                                            - 50% of low margin contracts (out of 110 contracts in
                                                              total) already terminated, repriced or improved
                                                            - Focus contracts EBITDA improved by 30 bps in Q3 YoY
                                                               104 customers live on WMS Express and Standard
                                                               (Matrix OFS solution). Additional 20% customer rollout
Key Figures as reported
                                       Q3 2018   YoY %
                                                               expected by end of 2018
(in US$ m)
                                                               Italy continued to be challenging (US$26 million
Revenue                                    929    +2.8%*
                                                               impact, including US$20 million one-time provisions)
EBITDA                                       7   -82.5%*
                                                               More new contract start-up costs
EBITDA Margin                             0.8%   -360bps*

  * At constant FX
 10      CEVA Logistics AG – Q3 2018
Focus on Italy

      Two contracts with significant issues (incl. change of business scope, higher
      operating costs)
      A local partner company (cooperativa) went bankrupt.

      The negative impact of these items is as follows:
      EBITDA impacts (in US$ m)                    Q3 2018   9M 2018
      Provision for onerous contracts               (16)      (26)

      Trading losses and additional labour costs     (6)      (12)

      Provision for risk/ bankrupt partner           (4)       (4)

      Total                                         (26)      (42)

      Plan to address these issues being implemented

 11     CEVA Logistics AG – Q3 2018
Anji CEVA Business Performance

      Revenues up 17.6% in 9M 2018 in constant currency to US$1,069 million
        - Automotive Division: Revenue up 15.7% in constant currency
        - Non-Automotive Division gathering pace: significant new business activity
           and strong pipeline. Non-Automotive diversification underway
      YTD EBITDA reached US$99 million, including a gain from a fixed asset disposal of
      US$28 million in Q3 2018 (CEVA’s share US$14 million). In Q3 2017, there was a
      gain of US$12 million (CEVA’s share US$6 million).

 12     CEVA Logistics AG – Q3 2018
Agenda

                                   1   Business Update and Strategic Progress

                                   2   Q3/9M 2018 Financial Results

                                   3   Outlook

13   CEVA Logistics AG – Q3 2018
Key figures

  Quarter Ending                                     Delta       9 Months Ending                          Delta
  30 September 2018                             at constant FX   30 September 2018                   at constant FX
                               Q3 2018              (%/US$                             9M 2018           (%/US$
                             (US$ million)          million)                         (US$ million)       million)

  Revenue                        1,810              +4.7%        Revenue                5,448            +5.0%

  EBITDA1                          29               -55.4%       EBITDA1                 148            -11.9%

  EBITDA Margin                  1.6%              -220bps       EBITDA Margin           2.7%           -50bps

      Underlying EBITDA, excluding Italy CL issues was:
        - US$ 55 million in Q3
        - US$190 million for the first nine months

 1 Before specific items and Share-Based Compensation (SBC)

 14     CEVA Logistics AG – Q3 2018
Group P&L
All figures above EBITDA are before specific items and SBC1
                                                                                                                      Comments
9 Months Ending                             9M 2018           9M 2017            Delta          Delta at
30 September 2018                                                                                                      Strong revenue growth in both
                                                                                              constant FX
                                          (US$ million) (US$ million)          (%/US$           (%/US$
                                                                                                                       FM and CL vs. the same period
                                                                               million)         million)               in 2017
Revenue                                       5,448            5,099            +6.8%            +5.0%                 Specific Items: higher due to
                                                                                                                       IPO (+US$19 million) / SBC
Net Revenue                                   2,721            2,571            +5.8%            +3.7%
                                                                                                                       (+US$7 million) whilst
Operating Expenses                           (2,573)          (2,398)                                                  restructuring cost much
EBITDA before specific items & SBC             148              173             -14.5%           -11.9%                reduced (US$ -12 million)
EBITDA Margin                                 2.7%              3.4%            -70bps           -50bps                D&A : accelerated amortization
   Specific items and SBC                      (51)             (31)             (20)              (20)                of acquisition intangibles,
                                                                                                                       higher capex
   Depreciation & Amortization                 (96)             (83)             (13)              (10)
                                                                                                                       Net Finance Expense still mostly
   Net Finance Expense                        (199)            (170)             (29)              (31)
                                                                                                                       reflects pre IPO capital
   Net Result from joint venture                25               15               10               10                  structure before the refinancing
   Tax                                         (25)             (28)               3                                   in August 2018 – also includes
                                                                                                                       US$56 million IPO/ Refinancing
Net Income                                    (198)            (124)             (74)
                                                                                                                       one-time costs
   Share in Anji-CEVA EBITDA                    50               36               14
                                                                                                                       FX impact related to translation
Adjusted EBITDA2                               198              209             -5.3%             -3.9%                of BRL and TRY mainly in Q3,
                                                                                                                       but < US$3 million in 9M 2018.

   1 SBC: Share-Based Compensation
   2 Adjusted EBITDA includes the Group’s share of EBITDA from the Anji-CEVA joint venture, and excludes specific items and SBC

  15     CEVA Logistics AG – Q3 2018
Results Freight Management

Quarter ending                                                                      Delta
30 September 2018                                                     Delta    at constant FX
                                    Q3 2018           Q3 2017       ( %/US$       ( %/US$
                                  (US$ million)     (US$ million)   million)       million)
Revenue                                881                840        4.9%          +6.8%
Net Revenue                            225                224       +0.4%          +3.2%
Operating Expenses                    (203)              (198)      +2.5%          +4.1%
EBITDA1                                 22                26          -4             -3
EBITDA Margin                          2.5%              3.1%       -60bps        -50bps

9 Months Ending                                                                     Delta
30 September 2018                                                     Delta    at constant FX
                                    9M 2018           9M 2017       ( %/US$       ( %/US$
                                  (US$ million)     (US$ million)   million)       million)
Revenue                               2,537              2,331      +8.8%          +6.9%
Net Revenue                            679                644       +5.4%          +4.0%
Operating Expenses                    (615)              (588)      +4.6%          +2.8%
EBITDA1                                 64                56           8             9
EBITDA Margin                          2.5%              2.4%       +10bps        +20bps

  1 Before specific items and Share-Based Compensation (SBC)

 16    CEVA Logistics AG – Q3 2018
Revenue of Air, Ocean and other FM – Q3 and 9M 2018

Revenue of FM Products
                                                                    YoY Growth
Quarter ending
                                        Q3 2018       YoY Growth   at constant FX
30 September 2018
                                      (US$ million)       ( %)          ( %)
Air                                       374           +7.5%          +9.5%
Ocean                                     271           +3.4%          +5.0%
Other FM                                  236           +2.6%          +4.3%

Revenue of FM Products                                              YoY Growth
9 Months Ending                         9M 2018       YoY Growth   at constant FX
30 September 2018                     (US$ million)       ( %)          ( %)
Air                                      1,074          +12.5%         +9.8%
Ocean                                     774           +8.4%          +5.6%
Other FM                                  689           +4.0%          +4.2%

 17     CEVA Logistics AG – Q3 2018
Results Contract Logistics

                                                                                                 Comments
Quarter ending                                                                       Delta
30 September 2018                                                      Delta    at constant FX
                                                                                                 Italy CL significantly impacting
                                    Q3 2018            Q3 2017       ( %/US$       ( %/US$       Q3 numbers.
                                  (US$ million)      (US$ million)   million)       million)     Underlying EBITDA, excluding
Revenue                                929                942         -1.4%         +2.8%        Italy issues was US$33 million in
Net Revenue                            656                657         -0.2%         +2.8%        Q3 2018 and US$126 million for
                                                                                                 9M 2018.
Operating Expenses                     (649)             (614)        +5.9%         +8.5%
EBITDA1                                  7                43           -36           -33
EBITDA Margin                          0.8%              4.6%        -380bps       -360bps

9 Months Ending                                                                      Delta
30 September 2018                                                      Delta    at constant FX
                                    9M 2018           9M 2017        ( %/US$       ( %/US$
                                  (US$ million)     (US$ million)    million)       million)
Revenue                               2,911              2,768       +5.2%          +3.4%
Net Revenue                           2,042              1,928       +5.9%          +3.5%
Operating Expenses                   (1,958)            (1,811)      +8.1%          +5.3%
EBITDA1                                 84                117          -33           -29
EBITDA Margin                          2.9%              4.2%        -130bps       -110bps

  1 Before specific items and Share-Based Compensation (SBC)

 18    CEVA Logistics AG – Q3 2018
Results Anji-CEVA – not consolidated

                                                                                          Comments
Quarter ending
                                                                              Delta       Strong revenue growth from
30 September 2018
                                         Q3 2018         Q3 2017         at constant FX
                                                                                          existing contracts, new
                                       (US$ million)   (US$ million)   ( %/US$ million)
                                                                                          implementations and transfer
Revenue                                     336             331              2.1%         of CEVA China CL business (July
EBITDA                                      52              33                18          2017)
EBITDA Margin                             15.5%             10%            +520bps        US$28 million gain from
Net Income                                  46              26                19          property sale in Q3 in total (for
                                                                                          100%) compared with US$12
CEVA’s share of EBITDA                      26              16                 9
                                                                                          million in 2017 (for 100%)

9 Months Ending                                                               Delta
30 September 2018                        9M 2018         9M 2017         at constant FX
                                       (US$ million)   (US$ million)   ( %/US$ million)
Revenue                                   1,069            870             +17.6%
EBITDA                                      99              73               23
EBITDA Margin                              9.3%            8.4%            +90bps
Net Income                                  58              37               20
CEVA’s share of EBITDA                      50              36               12

 19      CEVA Logistics AG – Q3 2018
Specific Items affecting EBITDA

                                                                             Comments
9 Months Ending
30 September 2018                                                            Much lower restructuring cost
                                               9M 2018         9M 2017
                                             (US$ million)   (US$ million)   compared to prior year
Restructuring                                     10              22         Litigation in PY benefitted from
Litigation & legacy tax                           6               (2)        a US$10 million cargo claim
                                                                             compensation and in 2018, this
Other                                             2               4
                                                                             mainly includes a claim in South
Sub-Total excl. IPO/ Refinancing                  18              24         America
                                                                             Share-based compensation cost
IPO and refinancing costs affecting EBITDA        19               -         increase reflects one-time
                                                                             option grants issued in relation
Share-based compensation                          14              7
                                                                             to IPO

 20     CEVA Logistics AG – Q3 2018
Net Working Capital

      NWC development impacted particularly         NWC Evolution (end of period)

      by                                            US$ million
                                                              Q1                      Q2                        Q3              Q4
           - Increase of Receivables due to lower        0
                                                                                                                (0.4)%

              factoring primarily in Italy and         (50)                          (1.1)%
                                                              (1.2)%

             Turkey                                   (100)
                                                                                                                  (1.7)%
                                                              (1.8)%                 (2.2)%
           - Payables lower than year end             (150)                                                     (2.4)%
                                                                                     (2.0)%                                     (2.7)%

      Continued focus on underlying structural        (200)
                                                              (2.4)%

      improvements, e.g. since year end               (250)
                                                                                                                                (3.6)%

        - Customer terms improved by 1 day            (300)
                                                                                      2018              2017             2016

        - Supplier payment terms increased                             as % of LTM            as % of LTM      as % of LTM
                                                                                                                Revenue
                                                                        Revenue                Revenue

              by 2 days

 21        CEVA Logistics AG – Q3 2018
Cash Flow

                                         9M 2018         9M 2017          Delta        Comments
                                       (US$ million)   (US$ million)   (US$ million)
                                                                                       Operating cash flow is impacted
EBITDA                                      97             142             (45)
                                                                                       by US$7 million of paid costs
Gain on disposal of PP&E                    0               (1)             1          relating to the IPO and
Retirement Benefit Obligations              (5)             (2)             (3)        Refinancing
Provisions                                  16              (1)             15         Working Capital change due to
                                                                                       comparative, growth, lower non
Change in working capital                 (135)            (55)            (80)
                                                                                       recourse factoring in Italy and
Other                                       (4)             3               (7)        Turkey and earlier payment
SBC                                         14              7               7          terms, e.g., US payroll
Operating cash flow                        (17)             93            (110)        Finance expense increased due
                                                                                       to higher debt in H1 and rates
Net finance expenses                      (160)           (119)            (41)
                                                                                       as well as a US$32 million
Tax                                        (21)            (27)             6          impact from the IPO and
Divestments                                 0               0               0          Refinancing
Capital expenditure                        (80)            (75)             (5)
Dividends received                          0               0               0
Free cash flow                            (278)           (128)           (150)
Proceeds from sale of PP&E                  2               3               (1)
Net Fund movement                         (276)           (125)           (151)

  22     CEVA Logistics AG – Q3 2018
$1.4bn Refinancing Completed

      We have repaid significant debt with proceeds from IPO
      Comprehensive refinancing completed including
        - US$475 million Term Loan
        - €300 million Notes,
        - US$585 million Revolver and ancillary facility1
      Key benefits from new facilities
      Higher flexibility to pursue strategy; public company style covenants
      Longer maturities – 5-7 year tenor
      Enhanced liquidity
      Much lower interest cost
      US$100 million reduction in finance expenses confirmed, on a full-year basis

 1 c.US$180 million for guarantees

 23     CEVA Logistics AG – Q3 2018
Refinancing Q3 2018

New Facilities                        Amount           Currency       Maturity               Rates
                                  (US$ equivalent)

                                                                                             L+3.75%
Term Loan B                             475              USD           2025
                                                                                 (leverage step down to L+3.50%)

                                         350
Notes                                                    EUR           2025                  5.25%
                                      (EUR 300)

Revolving Credit and
                                        585          multi currency    2023                L+2.375%
Ancillary Facility

      Refinancing of 9% PIK Notes (US$438 million), Term Loans (c.US$584 million) and Revolver (US$250
      million) completed 3 August 2018
      Ancillary Facilities within the Revolver primarily used for guarantees (c.US$180 million)
Hedging
      In October 2018, CEVA entered into interest rate hedging contracts to fix the interest rate on the
      majority of its floating rate debt for a period of 5 years
      Entered into a 3-year cross-currency swap of US$150 million principal debt from USD to EUR

 24     CEVA Logistics AG – Q3 2018
Agenda

                                   1   Business Update and Strategic Progress

                                   2   Q3/9M 2018 Financial Results

                                   3   Outlook

25   CEVA Logistics AG – Q3 2018
CEVA Strategic Targets*
EBITDA
Margin1       3.3%                                                                > 4.0%

                                                                                                 Margin Improvement Initiatives
                                                                                                 Freight Management

                                                                                                    1   Narrow Air & Ocean productivity gap with
                                                                                                        peers ( process improvement and technology)
                                                                                                    2   Improve Net revenue : procurement, pricing
            US$280 M
                                                                                                    3   Strengthen Ocean and grow through solutions
                                                                                                    4   Address low margin/loss-making operations
                                        FM Margin: 2.3% to c.3.5%
                                                                                                 Contract Logistics
                                        CL Margin: 4.1% to 4.5% – 5.0%
                                                                                                    1    Improve performance on focus contracts
                                                                                                    2    Address low margin contracts and sites
                                                                                                    3    Win new business more effectively/
            Adj. EBITDA    Growth       FM Margin2 CL Margin2       Anji JV    Adj. EBITDA
                                                                                                         standardized solutions
              FY 17A                                                             Target             4    Commercial acumen (discipline in pricing,
                                                                                Medium                   capital employed)
                          Contribution to EBITDA improvement – illustrative       Term

   * Set at IPO, excluding any additional benefits from the closer cooperation with CMA CGM
   1 EBITDA margin excludes share of Anji-CEVA JV EBITDA and is before specific items and Share-Based Compensation (SBC)
   2 Including SG&A

  26      CEVA Logistics AG – Q3 2018
Outlook

                                    Confirming medium-term EBITDA margin target of 4%
                                    and growth above market resulting in US$100 million
                                    adjusted EBITDA improvement, excluding any
                                    additional benefits from the closer cooperation with
                                    CMA CGM
                                    CL operations in Italy expected to be fixed in the next
                                    few months
                                    Strong productivity momentum and process
                                    improvement have a high priority
                                    New sales organization delivering strong returns

 27   CEVA Logistics AG – Q3 2018
Wrap-Up

                                   CEVA continues to deliver productivity and to execute
                                   on its medium-term plan
                                   Q3 excluding Italy CL was broadly in line with
                                   management expectations
                                   CEVA is on track to deliver its medium-term ambition
                                   CMA CGM partnership will provide more upside.

28   CEVA Logistics AG – Q3 2018
Appendix
Balance sheet
All figures in actual currency

   US$ million                         30.09.2018   30.09.2017   US$ million                    30.09.2018   30.09.2017
   Assets                                                        Liabilities and equity
   Property, plant and equipment          167          168
                                                                 Equity (parent company)           271         (625)
   Goodwill                              1,325        1,333
   Other intangibles                      67           122       Non-controlling interests          2            3
   Others                                 384          316       Total equity                      273         (622)
   Non-current assets                    1,943        1,939      Non-current liabilities          1,883        2,475
   Trade receivables                     1,163        1,061      Trade and other payables         1,394        1,391
   Cash and cash equivalents              368          261       Borrowings                        32           184
   Others                                 240          251       Others                            132          84
   Current assets                        1,771        1,573      Current liabilities              1,558        1,659
   Total assets                          3,714        3,512      Total liabilities and equity     3,714        3,512

  30     CEVA Logistics AG – Q3 2018
Debt maturity profile
All figures in US$ million at actual Fx rates

       Drawn Facilities          Undrawn Facilities

                                                    17                                                             167
                                                                                                                                                     823

                                                    393                                                            360

         2018                2019                 2020*                 2021                 2022               2023**                 2024          2025

   * Includes only ABL facilities. Refinancing of ABL facilities underway, maturities of all ABL facilities will be extended after the refinancing
   ** Includes ancillary facilities of up to USD 250 million

  31      CEVA Logistics AG – Q3 2018
Quarterly financial performance – actual currency
2017 figures in actual currency

                                       2018 (US$ million)                        2017 (US$ million)                               Delta (%)
                              Q1       Q2     Q3      Q4     YTD         Q1      Q2      Q3      Q4     YTD         Q1     Q2        Q3       Q4   YTD
 Freight Management
         Revenue             803     853      881      -    2,537       702      789     840      -     2,331       14.4   8.1       4.9      -    8.8
         Net Revenue         224     230      225      -     679        203      216     224      -      643        10.3   6.5       0.4      -    5.6
         EBITDA1              15       27     22       -      64         10      20      26       -      56         50.0   35.0     -15.4     -    14.3

 Contract Logistics
         Revenue             987     995      929      -    2,911       894      932     942      -     2,768       10.4   6.8      -1.4      -    5.2
         Net Revenue         691     695      656      -    2,042       624      647     657      -     1,928       10.8   7.4      -0.2      -    5.9
         EBITDA1              38       39      7       -      84         35      39      43       -      117        8.6    0.0      -83.7     -    -28.2

 Group
         Revenue            1,790   1,848    1,810     -    5,448       1,596   1,721   1,782     -     5,099       12.2   7.4       1.6      -    6.8
         Net Revenue         915     925      881      -    2,721       827      863     881      -     2,571       10.7   7.2        0       -    5.8
         EBITDA1              53       66     29       -     148         45      59      69       -      173        17.8   11.9     -58.0     -    -14.5
         Adjusted
                              66       77     55       -     198         54      70      85       -      209        22.2   10.0     -35.3     -    -5.3
         EBITDA2

   1 Excluding specific items and share-based compensation
   2 Adjusted EBITDA includes the Group’s share of Anji-CEVA but excludes specific items and share-based compensation

  32     CEVA Logistics AG – Q3 2018
Quarterly financial performance – Constant 2018 currency
2017 figures in constant currency

                                       2018 (US$ million)                        2017 (US$ million)                                 Delta (%)
                             Q1        Q2     Q3      Q4     YTD         Q1      Q2      Q3      Q4     YTD             Q1   Q2        Q3       Q4   YTD
 Freight Management
         Revenue             803     853      881      -    2,537       739      809     825      -     2,373       8.7      5.4       6.8      -    6.9
         Net Revenue         224     230      225      -     679        212      223     218      -      653        5.7      3.1       3.2      -    4.0
         EBITDA1              15       27     22       -      64         10      20      25       -      55         50.0     35.0     -12.0     -    16.4

 Contract Logistics
         Revenue             987     995      929      -    2,911       960      950     904      -     2,814       2.8      4.7       2.8      -    3.4
         Net Revenue         691     695      656      -    2,042       671      663     638      -     1,972       3.0      4.8       2.8      -    3.5
         EBITDA1              38       39      7       -      84         35      38      40       -      113        8.6      2.6      -82.5     -    -25.7

 Group
         Revenue            1,790   1,848    1,810     -    5,448       1,699   1,759 1,729       -     5,187       5.4      5.1       4.7      -    5.0
         Net Revenue         915     925      881      -    2,721       883      886     856      -     2,625       3.6      4.4       2.9      -    3.7
         EBITDA1              53       66     29       -     148         45      58      65       -      168        17.8     13.8     -55.4     -    -11.9
         Adjusted
                              66       77     55       -     198         55      69      82       -      206        20.0     11.6     -32.9     -    -3.9
         EBITDA2

   1 Excluding specific items and share-based compensation
   2 Adjusted EBITDA includes the Group’s share of Anji-CEVA but excludes specific items and share-based compensation

 33      CEVA Logistics AG – Q3 2018
Safe harbor statement

      This news release contains specific forward-looking statements. These forward-looking statements include, but are not
      limited to, discussions regarding the proposed private offering of the Notes described above, its guidance for 2018 and
      beyond, discussions regarding industry outlook, CEVA's expectations regarding the performance of its business or joint
      ventures, its liquidity and capital resources, and other non-historical statements. These statements can be identified by the
      use of words such as "believes" "anticipates," "expects," "intends," "plans," "continues," "estimates," "predicts," "projects,"
      "forecasts," and similar expressions. All forward-looking statements are based on management's current expectations and
      beliefs only as of the date of this news release and, in addition to the assumptions specifically mentioned in the above
      paragraphs, there are a number of factors that could cause actual results and developments to differ materially from those
      expressed or implied by these forward-looking statements, including the effect of local and national economic, credit and
      capital market conditions, a downturn in the industries in which we operate (including the automotive industry and the air
      freight business), risks associated with CEVA's global operations, fluctuations and increases in fuel prices, CEVA's substantial
      indebtedness, restrictions contained in its debt agreements and risks that it will be unable to compete effectively. Further
      information concerning CEVA and its business, including factors that potentially could materially affect CEVA's financial
      results, is contained in the annual and quarterly reports of CEVA Logistics AG (and its predecessor CEVA Holdings LLC),
      available on the Company's website, which investors are strongly encouraged to review. Should one or more of these risks or
      uncertainties materialise or the consequences of such a development worsen, or should underlying assumptions prove
      incorrect, actual outcomes may vary materially from those forecasted or expected. CEVA disclaims any intention or obligation
      to update publicly or revise such statements, whether as a result of new information, future events or otherwise.

      This presentation includes certain non-GAAP financial information. Because not all companies calculate non-IFRS financial
      information identically (or at all), the presentations herein may not be comparable to other similarly titled measures used by
      other companies. Further, such non-GAAP financial information of the Company should not be considered a substitute for the
      information contained in the historical financial information of the Company, if any, prepared in accordance with IFRS
      included herein.

 34   CEVA Logistics AG – Q3 2018
Contact

Investors:
Pierre Bénaich
SVP Investor Relations
pierre.benaich@cevalogistics.com
+41 41 547 00 48

Media:
Matthias Hochuli
Group Head of Marketing and Communications
matthias.hochuli@cevalogistics.com
+41 41 547 00 52

 35   CEVA Logistics AG – Q3 2018
You can also read