WE GET YOU NEW YORK NON-METRO - Media Across The Market - OUTFRONT Media
←
→
Page content transcription
If your browser does not render page correctly, please read the page content below
WE GET
YOU NEW YORK
    NON-METRO.
Media Across The Market

COPYRIGHT © 2018 OUTFRONT MEDIA INC. ALL RIGHTS RESERVED LAST REVISED 1/6/2022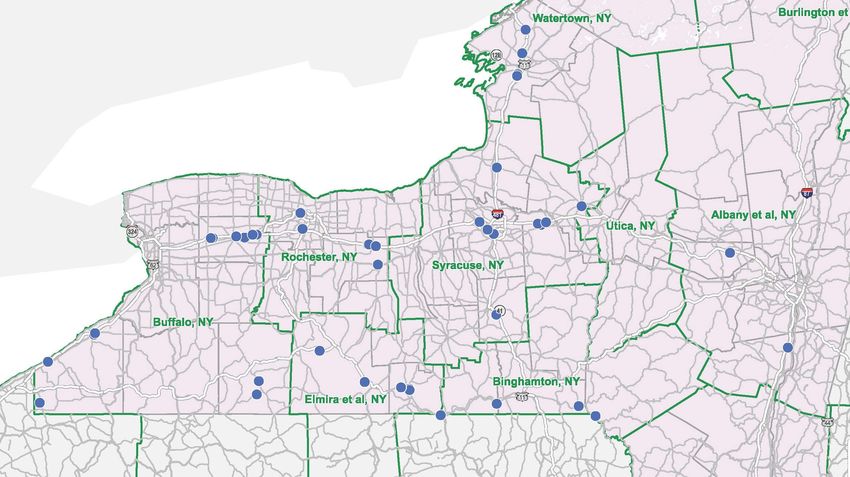
OUTFRONT BY
NAME
OUTFRONT by nature.

At OUTFRONT, we understand that to brands, audiences are
everything. The pandemic has accelerated the change of nearly
everything, including all of us. Our media continues to impact
people where and when it matters. As the most visible media
platform in America, we understand our role in creating cultural
impact. That’s why we are dedicated to helping people, places,
and business grow stronger.

We are adding intelligence to OOH, making our media more
accurate, more agile, and more accountable. We have an insights
suite and attribution solution designed to reach and measure
impact against your desired audience.

We blend the visibility and creative impact of real-world media
with the versatility of digital, infused with the power of audience
data. We champion the power of the biggest canvases in America
to drive engagement, fame, and trust.

We are front and center in the places where people live, work, and
play. From neighborhoods and communities, to urban centers and
transit hubs, to busier than every highways and roads.

We are everywhere. We empower smart brands to leverage our
ubiquity (500K canvases), our national footprint (25 top markets),
and our local community connections (and relevance).

Welcome to America’s most visible and most versatile media
network.

Welcome to OUTFRONT. We get you America.

NEW YORK NON-METRO
781.792.2123
                                                                      COPYRIGHT © 2018 OUTFRONT MEDIA INC. ALL RIGHTS RESERVED LAST REVISED 1/6/2022   2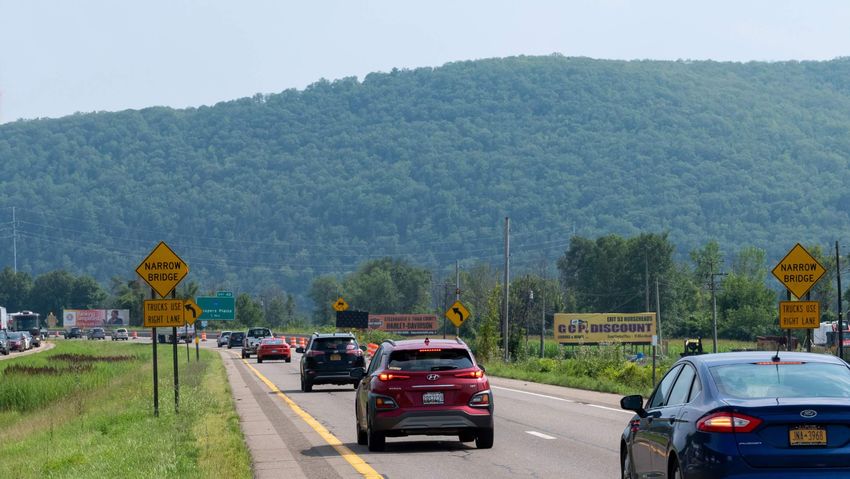
IMPACT WHERE
IT MATTERS
     WE LEVERAGE THE POWER OF
     TECHNOLOGY, LOCATION, AND CREATIVITY
     TO DRIVE IMPACT AND ENGAGEMENT
     BETWEEN BRANDS AND AUDIENCES.

TECHNOLOGY                                                                         LOCATION                                                      CREATIVITY
Technology is a priority for OUTFRONT. We have the right                           At its heart, OOH is a location based medium allowing         Creative drives 70% of an ad’s effectiveness and OOH is
hardware, software, and data to make your campaigns                                smart brands to leverage contextual relevance. With over      the most creative media out there. OUTFRONT delivers
targeted, efficient, and trackable. We know reaching the                           500K canvases & presence in highly trafficked transit hubs,   the best assets in the country, serving as the perfect blank
right people is a top priority. That’s why we use syndicated                       OUTFRONT has national breadth with deep local depth.          canvas for your brand story, illustrated through big, bold,
research, proprietary geospatial data, and real time mobile                        This scale allows all brands, national or local, to make an   and beautiful creative. Leverage our award winning in-
data to find people IRL. We also know that measurement                             impact and maintain a national presence (7 out of 10          house creative agency, STUDIOS, for best in class creative
matters. So, we have developed an attribution model that is                        Americans weekly*), with targeted messaging by market or      services or tap into XLabs to bring dynamic capabilities to
scalable to meet different business needs.                                         demographic.                                                  your digital creative.

NEW YORK NON-METRO
781.792.2123
SOURCE: GEOPATH (OUTFRONT MARKETS), 2021. JIM SPAETH: CREATIVE ACCOUNTS FOR 70% OF OUT OF HOME AD ROI.
                                                                                                                                                 COPYRIGHT © 2018 OUTFRONT MEDIA INC. ALL RIGHTS RESERVED LAST REVISED 1/6/2022   3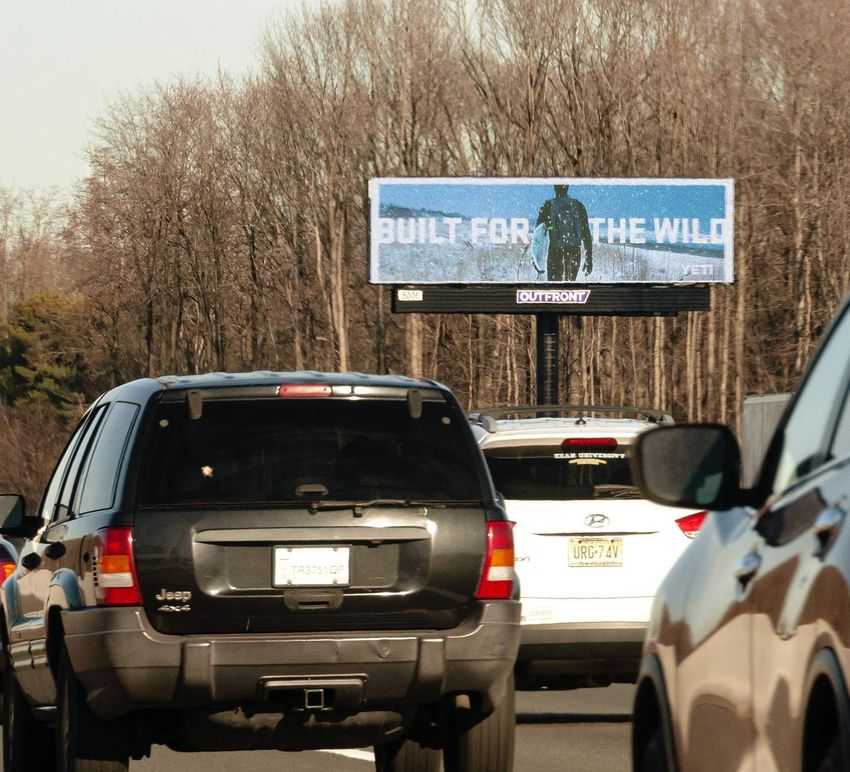
TIME TO
MIX IT UP
THE PANDEMIC ACCELERATED BEHAVIORAL
CHANGES, HIGHLIGHTING AND INCREASING
OUTFRONT’S PROXIMITY MARKETING POWER.
AS YOUR AUDIENCE MIXES UP THEIR ROUTINE,
SO DO WE. OUR ABILITY TO INTEGRATE
INTO COMMUNITIES, DRIVE CONTEXTUAL
AND SITUATIONAL RELEVANCE, AND
AMPLIFY DIGITAL MEDIA’S EFFECTIVNESS
UNIQUELY POSITIONS OUTFRONT (AND YOUR
MESSAGING) TO IMPACT CONSUMERS.

ALL EYES ON OUTDOOR                                                                  MOST TRUSTED MEDIUM                                           DIGITAL BURNOUT
The demand for outdoor and real life experiences remains                             Trust is key for brands today. OOH remains the most           People are experiencing digital fatigue, with 71% reporting
high. Whether on the roads or in transit systems, OOH’s                              trusted medium, seeing the largest increase in consumer       tuning out digital ads and 33% already spending less time
impact is higher than ever before. In fact, 53% of people                            trust during the pandemic. We believe this is due to its      with their various screens. Advertisers see OOH as a viable
reported noticing OOH ad more now than pre-pandemic. It                              tangible in real life nature. This is especially true among   solution, due to its real life impact and creativity that
doesn’t stop there. People take action after OOH exposure,                           the younger generations, with OOH being the #1 preferred      amplifies digital connections. That’s why 87% of advertisers
with top actions including search, website visitation, talking                       media format for Millennials and Gen Z. And it continues      are recommending digital OOH in the next 12 months.
about the brand, and in-store purchases. Brands are taking                           to drive action, with 92% of Millennials and 77% of Gen Z     Leverage the core strengths of OOH with the connectivity
note, with 77% increasing their knowledge of the sector in the                       responding that they were extremely likely to purchase a      of mobile to provide more touchpoints of engagement and
past 18 months.                                                                      product after seeing an OOH ad.                               inspire people to search, shop, or share.

NEW YORK NON-METRO
781.792.2123
SOURCE: THE HARRIS POLL AND OAAA, 2021. DPAA & XASIS ANNUAL MEDIA DECISION MAKER STUDY, 2021. QUOTIENT, GREER BINGHAM, 2021.
                                                                                                                                                   COPYRIGHT © 2018 OUTFRONT MEDIA INC. ALL RIGHTS RESERVED LAST REVISED 1/6/2022   4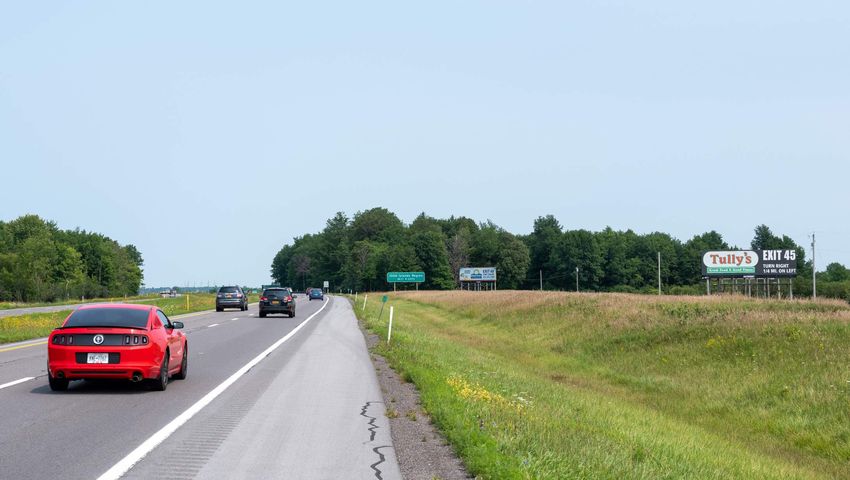
LEVERAGE
OUR EDGE
                                                                                                                          CONSULTATION

                                                                                                                      CREATIVE
    OUTFRONT’S 360˚ PARTNERSHIP
    APPROACH ENSURES YOU GET
    THE EDGE ON YOUR COMPETITION.                                                                                 PRODUCTION

                                                                                                              AMPLIFICATION

                                                                                                            ATTRIBUTION

CONSULTATION                        CREATIVE                             PRODUCTION                           AMPLIFICATION                                         ATTRIBUTION
DEFINING YOUR                       THE MOST CREATIVE                    LAUNCHING                            TAKING YOUR MESSAGE                                   TRACKING
CAMPAIGN                            OF ALL MEDIUMS                       YOUR CAMPAIGN                        FROM IRL TO URL                                       SUCCESS
Tap into smartSCOUT™, Geopath,      Leverage our award winning           Let’s launch your brand story!       OOH is the best primer for                            Our suite of attribution
or StreetMetrics to find the best   in-house creative agency,            With a full in-house operations      all things digital, including                         solutions can track the
canvases to reach your audience.    OUTFRONT STUDIOS, to aid with        team, your campaign will hit the     search, social, and mobile. Our                       successes of your campaign
Prefer to buy programmatically?     anything from best practices to      streets in an impactful way.         communications team can assist                        based on particular KPIs like
1000+ canvases available to be      full campaign development. Utilize                                        in press, social campaigns, and                       Foot Traffic, Web Traffic, Phone
bought programmatically on top      XLABS to bring dynamic digital                                            digital engagement tracking.                          Calls, Tune In, and Brand Affinity.
SSP & DSP platforms.                elements to your campaign.

NEW YORK NON-METRO
781.792.2123
                                                                                                                          COPYRIGHT © 2018 OUTFRONT MEDIA INC. ALL RIGHTS RESERVED LAST REVISED 1/6/2022   5
AMPLIFICATION
MATTERS
OUTFRONT is the best primer for digital engagement.
14.28 377
360 369
341 338 349
WITH
OOH
+40%
BANNER AD ON COMPUTER
BANNER AD ON COMPUTER
BANNER AD ON COMPUTER
48% TO CLICK AFTER
BEING EXPOSED
5.97 MORE LIKELY TO OOH
5.57
DIGITAL 130 135 135
4.58
SEARCH
3.73 92 93 96
2.94
OOH
43
RADIO
RADIO
RADIO
1.37 41 38
PRINT
PRINT
PRINT
OOH
OOH
DIGITAL DIGITAL
TV
TV
TV
RADIO VIDEO DISPLAY PRINT TV OOH
SEARCH SOCIAL MOBILE
When OOH is added to the media mix, it increases OOH drives nearly 4x more social/digital activations, Consumers are 48% more likely to engage with a mobile
search’s return on ad spend by 40%. per ad dollar spent, than any other media. In addition, ad after being exposed to the same ad on OOH first.
1 in 4 Americans has posted an OOH ad onto Instagram.
OOH drove 300% increase in search for an innovative A single subway wrap for Supreme reached 2.2 billion OOH & mobile increased purchase intent for
insulin company. people on Twitter. Bounce Curl by 18%.
SCAN OR CLICK FOR SCAN OR CLICK SCAN OR CLICK FOR
THE AFREZZA FOR THE SUPREME BOUNCE CURL
CASE STUDY CASE STUDY CASE STUDY
NEW YORK NON-METRO
781.792.2123
SOURCE: SEARCH: BENCHMARKETING: NIELSEN, MOBILE: OCEAN NEURO INSIGHTS.
COPYRIGHT © 2018 OUTFRONT MEDIA INC. ALL RIGHTS RESERVED LAST REVISED 1/6/2022 6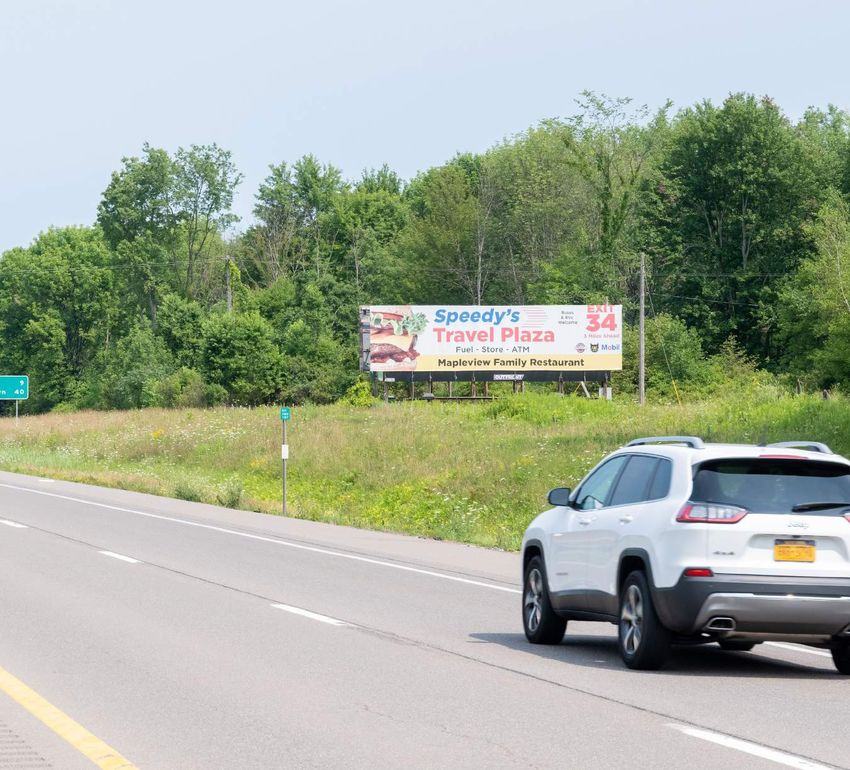
ATTRIBUTION
  MATTERS
      OUTFRONT’S COMPREHENSIVE
      SOLUTIONS STACK PROVIDES CLIENTS
      WITH THE FLEXIBILITY TO CHOOSE
      ATTRIBUTION PRODUCTS BASED
      ON SPECIFIC CAMPAIGN KPIs.

               FOOTFALL
               Footfall uses a consumer’s physical behavior to
               track incremental store and on-site visits to OOH
               campaigns they have viewed.

               ONLINE
               Online conversion tracking identifies when a consumer
               is exposed to OOH advertising and then visits the
               corresponding brand’s website or mobile app.

               TUNE-IN
               Devices exposed to OOH ads are mapped to
               households that viewed a specific program,
               measuring tune-in lift.

               LOCATION SURVEYING
               On site surveying provides brands with the opportunity
               to understand how audiences are responding to OOH
               creative. Awareness, ad recall, interest, and intent to
               buy attributes are measured, providing valuable insight
               around ROI and the true impact of the OOH buy.
NEW YORK NON-METRO
781.792.2123
                                                                         COPYRIGHT © 2018 OUTFRONT MEDIA INC. ALL RIGHTS RESERVED LAST REVISED 1/6/2022   7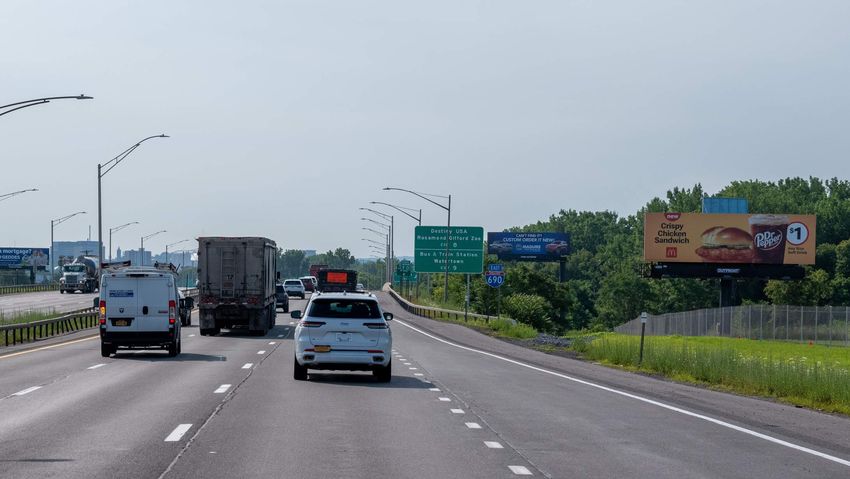
OOH IS SET FOR
CONTINUED GROWTH
US Media Forecast

                                                         2023 FORECAST
       2022 FORECAST

               16%                                            12%
             DIGITAL                               11%
                                                            DIGITAL
                                                   OOH

                                            5%                                                                                               3%
                              3%           RADIO                                                                                            OOH
                              TV

                                                                                                                  4%
                                                                                                                 RADIO

                                                                         11%
                                                                         TV
                                    17%
                                   PRINT
                                                                                          19%
                                                                                         PRINT

NEW YORK NON-METRO
781.792.2123
SOURCE: MAGNA GLOBAL, 2021.
                                                                               COPYRIGHT © 2018 OUTFRONT MEDIA INC. ALL RIGHTS RESERVED LAST REVISED 1/6/2022   8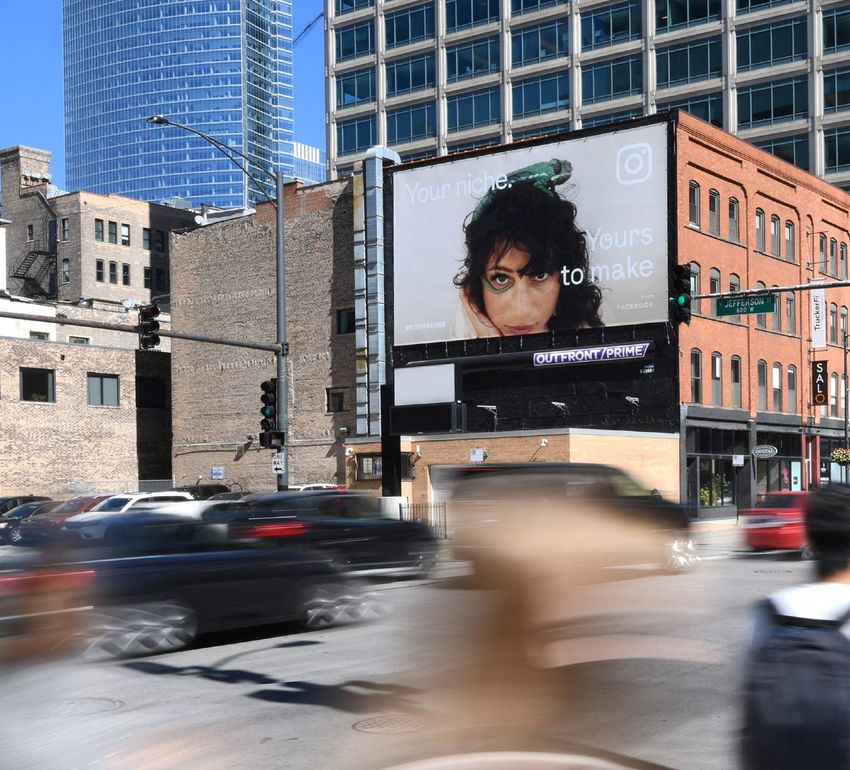
IMPACT WHERE IT MATTERS:
MEDIA ACROSS THE U.S.A.

YOUR STORY & YOUR AUDIENCE. OUR CANVAS.

                                                                                                                           9
NEW YORK NON-METRO
781.792.2123                              COPYRIGHT © 2018 OUTFRONT MEDIA INC. ALL RIGHTS RESERVED LAST REVISED 1/6/2022
TOP 50 MARKETS
CBSA POPULATION POSTERS & COMMUTER RAIL MOBILE + SOCIAL
TOP 50 MARKETS AGE 18+
BULLETINS WALLSCAPES
JUNIOR POSTERS & SUBWAY
BUSES STREET FURNITURE SPECIALTY
NETWORKS
1 New York-Newark et al, NY-NJ-PA 15,756,268 ●● ● ●● ●●● ● ●● ●● ●
2 Los Angeles-Long Beach et al, CA 10,403,667 ●● ● ●● ●● ●●● ●● ●
3 Chicago et al, IL-IN-WI 7,428,442 ●● ● ●● ●● ●● ●
4 Dallas-Fort Worth-Arlington, TX 5,865,419 ●● ● ●● ● ●
5 Houston-The Woodlands et al, TX 5,389,712 ●● ● ●● ●
6 Washington et al, DC-VA-MD-WV 4,983,627 ● ● ●●● ●● ● ●
7 Miami-Fort Lauderdale et al, FL 4,975,502 ●● ●● ●●● ●● ●●● ●
8 Philadelphia et al, PA-NJ-DE-MD 4,932,029 ●● ● ● ●●● ●
9 Atlanta-Sandy Springs et al, GA 4,752,714 ●● ●● ●●● ●● ●●● ●
10 Boston-Cambridge-Newton, MA-NH 4,032,782 ●● ● ● ●●● ●● ●● ● ●
11 San Francisco-Oakland et al, CA 3,827,557 ●● ● ● ●●● ●● ●● ●
12 Phoenix-Mesa-Scottsdale, AZ 3,790,320 ●● ● ● ●●● ●● ●● ● ●
13 Riverside et al, CA 3,542,301 ●● ● ●
14 Detroit-Warren-Dearborn, MI 3,412,676 ●● ● ● ●● ●
15 Seattle-Tacoma-Bellevue, WA 3,235,687 ● ● ●
16 Minneapolis-St. Paul, MN 2,872,781 ●● ● ● ●● ●
17 San Diego-Carlsbad, CA 2,642,192 ●● ● ● ●● ●
18 Tampa St. Petersburg, FL 2,638,887 ●● ● ●
19 Denver-Aurora-Lakewood, CO 2,379,094 ●● ● ● ●
20 Baltimore-Columbia-Towson, MD 2,249,834 ● ●
21 St. Louis, MO-IL 2,207,607 ●● ● ●● ●
22 Orlando-Kissimmee-Sanford, FL 2,119,083 ●● ● ●
23 Portland-Vancouver et al, OR-WA 2,028,866 ●● ●
24 San Antonio-New Braunfels, TX 1,990,817 ●● ●
25 Pittsburgh, PA 1,904,900 ● ●
● INDICATES OUTFRONT MEDIA AVAILABLE ● INDICATES DIGITAL MEDIA AVAILABLE ● INDICATES WRAPPED MEDIA AVAILABLE
10
NEW YORK NON-METRO
781.792.2123 COPYRIGHT © 2018 OUTFRONT MEDIA INC. ALL RIGHTS RESERVED LAST REVISED 1/6/2022
NOTE: TOP 50 MARKETS BASED ON OUTFRONT INVENTORY AND POPULATION COUNT
SOURCE: CENSUS DATA (2021 UPDATE).TOP 50 MARKETS
CBSA POPULATION POSTERS & COMMUTER RAIL MOBILE + SOCIAL
TOP 50 MARKETS AGE 18+
BULLETINS WALLSCAPES
JUNIOR POSTERS & SUBWAY
BUSES STREET FURNITURE SPECIALTY
NETWORKS
26 Sacramento--Roseville et al, CA 1,868,176 ●● ●● ●
27 Las Vegas-Henderson-Paradise, NV 1,816,899 ●● ●● ●
28 Cincinnati, OH-KY-IN 1,747,915 ● ●
29 Kansas City, MO-KS 1,685,604 ●● ● ● ●
30 Columbus, OH 1,680,497 ●● ● ● ●
31 Cleveland-Elyria, OH 1,633,258 ●● ●
32 Indianapolis-Carmel-Anderson, IN 1,618,427 ●● ● ●
33 San Jose-Sunnyvale et al, CA 1,570,775 ●● ● ●● ● ●● ●
34 Nashville-Davidson et al, TN 1,558,528 ●● ●
35 Virginia Beach et al, VA-NC 1,406,361 ● ●● ●
36 Providence-Warwick, RI-MA 1,354,161 ●● ●● ●
37 Jacksonville, FL 1,256,747 ●● ●
38 Raleigh, NC 1,097,311 ● ●
39 Richmond, VA 1,040,950 ● ●
40 Memphis, TN-MS-AR 1,026,675 ●● ●
41 Louisville et al, KY-IN 1,001,624 ●● ● ● ●● ●
42 New Orleans-Metairie, LA 1,000,128 ●● ● ● ●
43 Hartford-West Hartford et al, CT 978,154 ●● ●● ● ●
44 Buffalo-Cheektowaga et al, NY 943,573 ● ● ●
45 Rochester, NY 891,865 ● ●
46 Grand Rapids-Wyoming, MI 845,634 ●● ●● ●
47 Worcester, MA-CT 772,237 ● ●
48 Bridgeport-Stamford-Norwalk, CT 749,957 ● ● ●
49 Albany-Schenectady-Troy, NY 744,134 ● ●
50 Fresno, CA 735,818 ●● ●● ●
● INDICATES OUTFRONT MEDIA AVAILABLE ● INDICATES DIGITAL MEDIA AVAILABLE ● INDICATES WRAPPED MEDIA AVAILABLE
11
NEW YORK NON-METRO
781.792.2123 COPYRIGHT © 2018 OUTFRONT MEDIA INC. ALL RIGHTS RESERVED LAST REVISED 1/6/2022
NOTE: TOP 50 MARKETS BASED ON OUTFRONT INVENTORY AND POPULATION COUNT
SOURCE: CENSUS DATA (2021 UPDATE).MEDIA ACROSS
NEW YORK NON-METRO
12
NEW YORK NON-METRO
781.792.2123 COPYRIGHT © 2018 OUTFRONT MEDIA INC. ALL RIGHTS RESERVED LAST REVISED 1/6/2022WE GET
YOU NEW YORK NON-METRO.
Known for its great outdoors, New York Non Metro, commonly
referred to as Upstate New York, is the area north of New York City.
This large geographic area, consisting mostly of forest and farms, has
a population of 8.4 million people. The region supports a strong
agricultural industry and is notable for its milk and dairy products,
apple orchards, vineyards, and wine making. The region also has
a robust industrial and tourism industry. The major cities in the
region are Buffalo, Rochester, Syracuse, Albany, Schenectady, and
Binghamton.
WHY NEW YORK NON-METRO?
— The New York region is home to several popular tourist and SCAN OR CLICK TO
LEARN MORE
recreational destinations including Niagara Falls, Adirondack and
Catskill Mountains, Saratoga Springs, and Finger Lakes.
— Hiking, biking, camping, hunting, fishing, and boating are all popular
activities drawing tourists to the region.
— The Adirondack Park is the largest publicly protected area in
the contiguous United States greater in size than Yellowstone,
Everglades, Glacier, and Grand Canyon National Park combined.
NEW YORK NON-METRO
781.792.2123
SOURCE: US CENSUS 2016, US CENSUS AMERICAN COMMUNITY SURVEY, APTA, NYGOV, GEOPATH COPYRIGHT © 2018 OUTFRONT MEDIA INC. ALL RIGHTS RESERVED LAST REVISED 1/6/2022 13
2018.NEW YORK NON-METRO
Profile
ALBANY
African American
8%
Asian
26 87% $102K
min. $104K
5%
Hispanic/Latino
6%
White
78% Average HHI
Avg One Way Drive alone/carpool
Other/Mixed Commute to work
3%
ROCHESTER
African American
11%
Asian 24 89% $92K
3% min.
Hispanic/Latino
8%
White
75%
Avg One Way Drive alone/carpool Average HHI
Other/Mixed Commute to work
3%
SYRACUSE
African American
8%
Asian 24 88% $113K
3% min. $91K
Hispanic/Latino
5%
4.1 MILLION - NY NON-METRO POPULATION
White
81%
Avg One Way Drive alone/carpool Average HHI
NEW YORK NON-METRO Other/Mixed Commute to work
781.792.2123 3%
SOURCE: CENSUS DATA (2022 UPDATE) ALBANY, ROCHESTER, AND SYRACUSE, NY CBSA MARKETS
*NY NON METRO TOTAL POPULATION INCLUDES ALBANY, BINGHAMTON, BUFFALO, ELMIRA-CORNING, ROCH-
ESTER, SYRACUSE, & WATERTOWN COMBINED CBSA POPULATIONS (APRIL 2020 CENSUS DATA)MEDIA FORMATS
BILLBOARDS 16
BULLETINS 17
DIGITAL BULLETINS 19
SECOND SCREEN MEDIA 21
MOBILE NETWORK 22
SOCIAL INTEGRATION 23
15
NEW YORK NON-METRO
781.792.2123 COPYRIGHT © 2018 OUTFRONT MEDIA INC. ALL RIGHTS RESERVED LAST REVISED 1/6/2022BILLBOARDS
BACK TO MEDIA FORMATS
COPYRIGHT © 2018 OUTFRONT MEDIA INC. ALL RIGHTS RESERVED LAST REVISED 1/6/2022 16BULLETINS
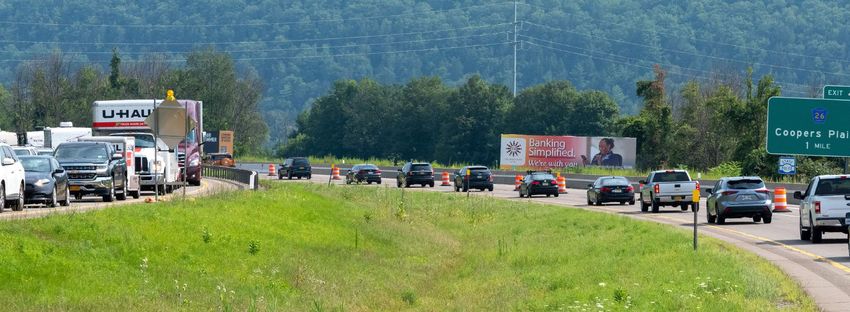
Bulletins offer the most powerful PRODUCT COVERAGE
impact of all outdoor advertising INFORMATION
formats. Located on key highways, — See map for
intersections and integral choke points — 14’H x 48’W complete coverage
throughout the New York non-metro — Odd Sizes
area, our bulletins are uniquely situated
— Sizes very by
to communicate your brand message in
location
close proximity to tourist destinations,
prompting action. — Extensions allowed
17
NEW YORK NON-METRO BACK TO MEDIA FORMATS
781.792.2123 COPYRIGHT © 2018 OUTFRONT MEDIA INC. ALL RIGHTS RESERVED LAST REVISED 1/6/2022BULLETIN COVERAGE
18
NEW YORK NON-METRO BACK TO MEDIA FORMATS
781.792.2123 COPYRIGHT © 2018 OUTFRONT MEDIA INC. ALL RIGHTS RESERVED LAST REVISED 1/6/2022DIGITAL BULLETINS
Digital Bulletins are located on highway Digital Bulletins add an extra PRODUCT INFORMATION COVERAGE
I-690 in the Syracuse area of upstate layer of timeliness and relevance
New York. This media format offers to a campaign allowing — 14’H x 48’W — Syracuse
brands unavoidable presence of their advertisers to easily change — Loop Length :80
ad message that reaches millions of creative messaging based on
— Spot Length :10
commuters every month. triggers such as time of day,
weather, or sports scores.
19
NEW YORK NON-METRO BACK TO MEDIA FORMATS
781.792.2123 COPYRIGHT © 2018 OUTFRONT MEDIA INC. ALL RIGHTS RESERVED LAST REVISED 1/6/2022DIGITAL BULLETIN COVERAGE
20
NEW YORK NON-METRO BACK TO MEDIA FORMATS
781.792.2123 COPYRIGHT © 2018 OUTFRONT MEDIA INC. ALL RIGHTS RESERVED LAST REVISED 1/6/2022SECOND
XXXXXXXX
SCREEN MEDIA
XXXXXXXX
WASHINGTON DC
21
202.775.9115 BACK TO MEDIA FORMATS
SOURCE / LEGAL COPYRIGHT © 2018 OUTFRONT MEDIA INC. ALL RIGHTS RESERVED LAST REVISED 1/6/2022
NEW
RHODE YORK NON-METRO
ISLAND
781.792.2123
781.792.2123MOBILE NETWORK
SCAN OR CLICK
TO LEARN MORE
Combine the power of OOH with mobile to create PRODUCTS LOCATED IN THE
new engagement opportunities with your target
— Proximity Targeting
TOP 50 MARKETS
audience. Targets the right users by geofencing your
OOH and strategic locations, target by behavior,
— Retargeting
then create message frequency with this audience
through retargeting. Proximity targeting technology — Behavioral or
enables mobile ad activation for users within a Brand Targeting
geographical boundary. These virtual perimeters are
— Transit System
created around real-world locations defined as lat/
Audience Targeting
longs, addresses, points of interest, zip codes, cities,
DMAs, states, or nationwide.
NEW YORK NON-METRO
781.792.2123
BACK TO MEDIA FORMATS
COPYRIGHT © 2018 OUTFRONT MEDIA INC. ALL RIGHTS RESERVED LAST REVISED 1/6/2022 22SOCIAL MEDIA
INTEGRATION
DRIVING CLIENT RESULTS ENGAGEMENT OPPORTUNITIES LOCATED IN THE SCAN OR CLICK
TOP 50 MARKETS
TO LEARN MORE
Social monitoring tracks lifts in location Organic
based social conversation and search — Snapcodes + Filters
with geofencing, plus social conversation
around specific campaigns using — QR Codes
keywords, hashtags, phrases, etc. Social — Shazam Codes
listening metrics include: Reach, Spread, — Spotify Codes
Mentions, Sentiment, and Trends.
Paid
NEW YORK NON-METRO — AR
781.792.2123
— Influencers
BACK TO MEDIA FORMATS
COPYRIGHT © 2018 OUTFRONT MEDIA INC. ALL RIGHTS RESERVED LAST REVISED 1/6/2022 23WEGETYOU.COM 781.792.2123 40 WATER ST., LM BOSTON, MA 02109 INSTAGRAM | YOUTUBE | LINKEDIN | TWITTER | FACEBOOK
You can also read