Virginia COVID-19 Surveillance Data Update - January 12, 2022
←
→
Page content transcription
If your browser does not render page correctly, please read the page content below
Virginia
COVID-19 Surveillance Data
         Update

        January 12, 2022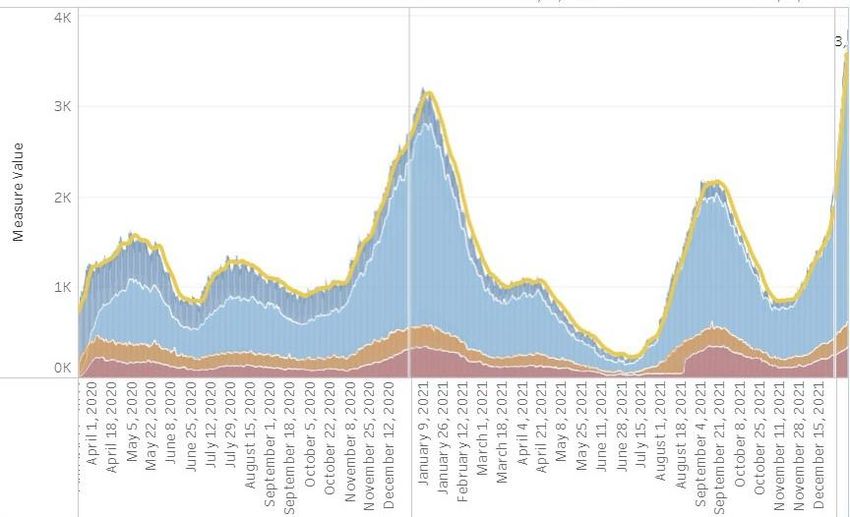
National: Weekly COVID-19 Case Rate
Updated 1/12/22
Cases in the Last 7
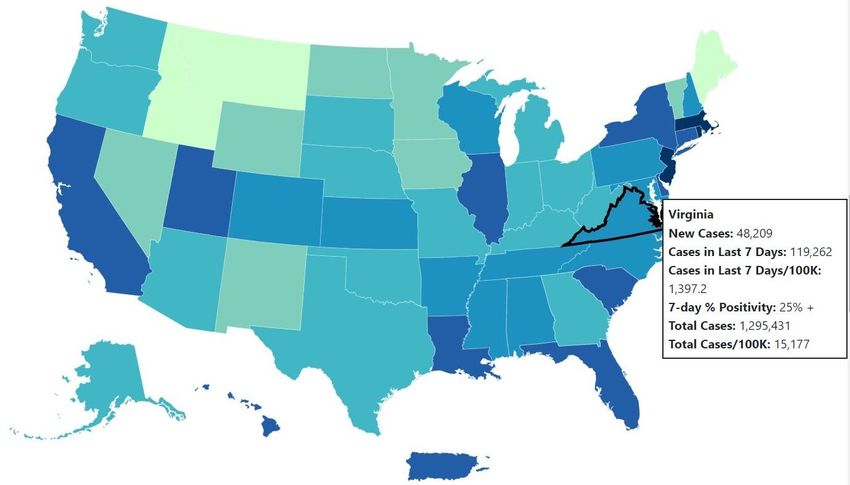
US COVID-19: 7-Day Case Rate per 100,000, by State/Territory Days
Per 100k Population
Virginia 1,397.2 (+19.8%)
U.S. 1,583.5 (+35.3%)
Rhode Island 3,459.4 (+62.6%)
New York City* 3,270.1 (+0.46%)
New York 2,131.7 (+18.6%)
New Jersey 2,498.2 (+8.0%)
Our Neighbors
Rates Higher than Virginia
District of Columbia, 1,812.4 (-13.9%)
North Carolina, 1477.8 (+50.0%)
Tennessee, 1409.5 (+28.4%)
Rates Lower than Virginia:
Maryland, 1,395.6 (-6.3%)
West Virginia, 1,280.2 (+42.1%)
Kentucky, 1188.2 (+55.1%)
Source CDC COVID Data Tracker Please note rate change comparisons are from the previous week’s data. 2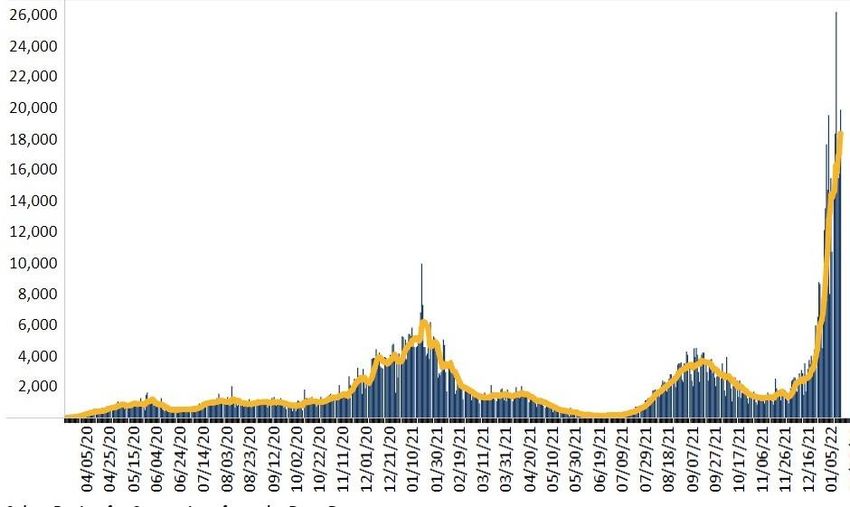
National: Cases, Hospitalizations, and Deaths                                              Updated 1/12/22

                                                   • Compared to last week, cases increased to 750,996
                                                     (7-day MA) per day (+47%)
                                                        • 200% higher than the January peak of 2021
                                                        • 357% higher than the September high of 2021
                                                        • Hospitalizations increased to 19,768 (7-day
                                                          MA) per day (+32.5%)
                                                   • Deaths increased to 1,633 (7-day MA) per day
                                                     (+40%)

Source: CDC COVID Data Tracker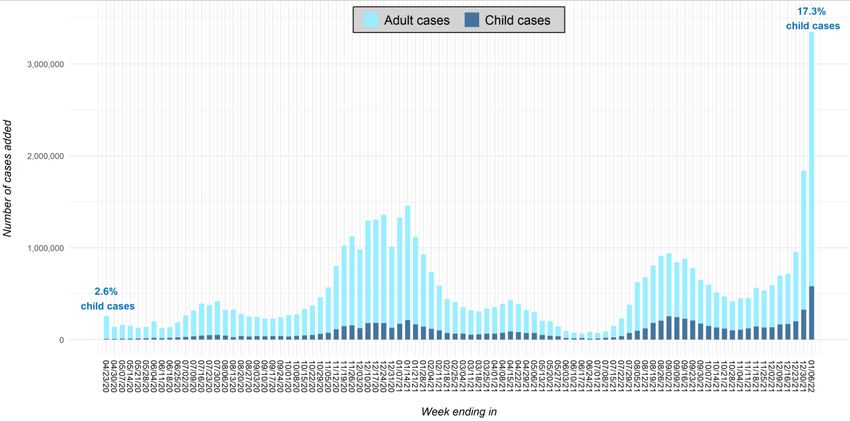
American Academy of Pediatrics Children and COVID-19 Report                                               Updated 1/11/22

                 Total Number of Child COVID-19 Cases (as of 1/6/22)

                                                                       Total Number of Children and Adult
                                                                         COVID-19 Cases (as of 1/6/22)

Source: Children and COVID-19: State-Level Data Report (aap.org)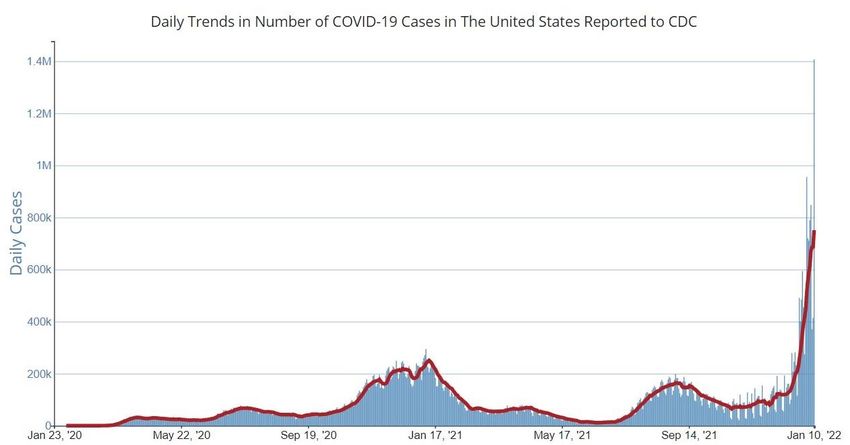
New York State Department of Health Pediatric Hospitalizations                                                                                        Updated 1/11/22

                                                         New York State released report based on data from Dec 5th - Jan 1st among children 0-18.
                                                         Major Findings included:
                                                         •     Hospital admissions for or with COVID-19 among people aged ≤ 18 years increased more than 7-fold
                                                               statewide
                                                         •     Seven out of ten children across New York State who contracted COVID-19 and were hospitalized
                                                               were symptomatic and 54% had no comorbidities

                                 0-18 Years, Hospital Admissions

Source: Full Report - Pediatric COVID-19 update: January 7, 2022 (ny.gov)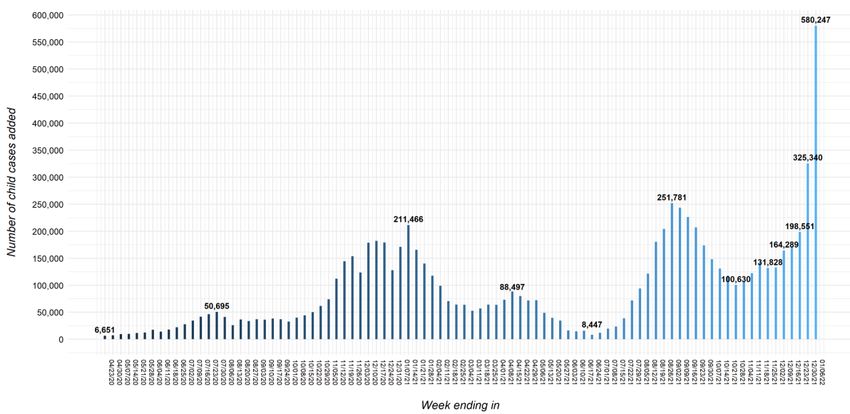
Virginia: Cases, Hospitalizations, and Deaths                                                                                                            Updated 1/12/22

                                                                                                              Compared to last week, cases increased to 18,338 (7-day MA)
           Cases by Date of Symptom Onset, Past 13 weeks                                                      from 14,212 per day (+29%)
                                                                                                                   • 197% higher than the January peak of 2021
                                                                                                                   • 397% higher than the September high of 2021

                                                                                                              • Hospitalizations increased to 3,554 per day (+43%)
                                                                                                              • *Deaths increased to 17 confirmed deaths last week (+32%)

                                                                                                                    Cases by Date Reported, All Reporting Timeline

                                                    Gray shaded area illness may not have been reported yet

*VDH received cumulative death data on 12/28 totaling 185 deaths
Source: Cases – Coronavirus (virginia.gov), Cases and Deaths - Coronavirus (virginia.gov), VHHA
Hospitalizations – Coronavirus (virginia.gov), Data represent a 7-day moving average                                                                                          6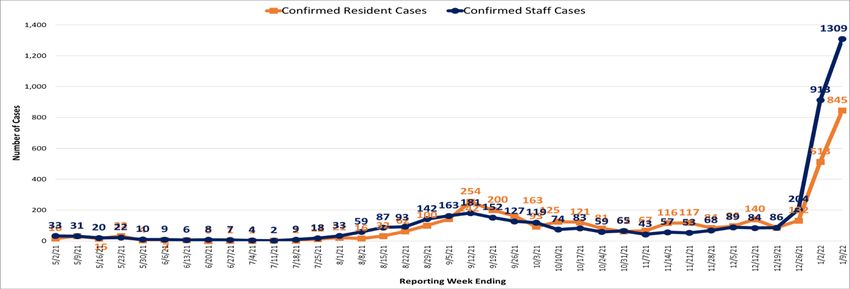
Virginia: Pediatric Cases                                                    Updated 1/11/22

                                                            Click to add text

Source: Cases Among Children - Coronavirus (virginia.gov)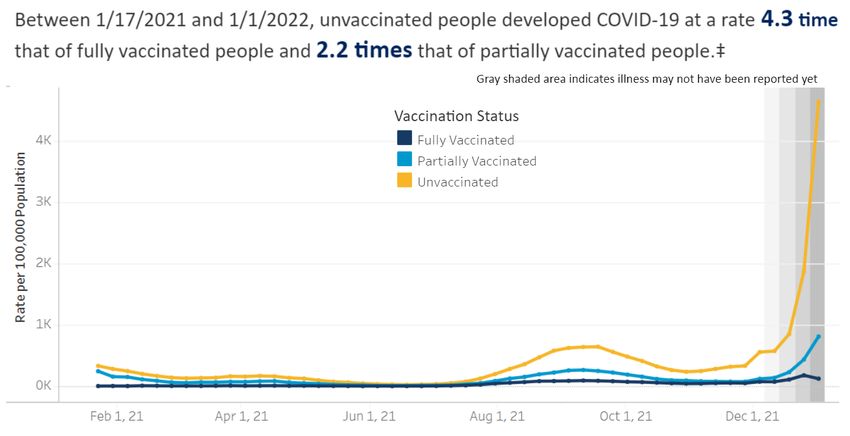
Virginia: Rate of Hospitalizations Per 100,000 by Vaccine Status (1/17/21-1/1/22)   Updated 1/11/22

Source: VDH Hospitalizations by Vaccine Status
Virginia Hospitalization Trends                                                                               Updated 1/12/22

                                               COVID-19 in Virginia Hospitals

                                                                                Compared to last week hospitalizations
                                                                                increased to 3,554 (7-day MA) from
                                                                                1,650 (+43%)
                                                                                •   64% higher than the September high of
                                                                                    2021
                                                                                Compared to last week. ICU
                                                                                hospitalizations have increased to 621
                                                                                from 499 (+24%)
                                                                                345 patients are currently on ventilator
                                                                                support (+23%)
                                                                                •   2% lower than the September high of
                                                                                    2021

Source: VHHA Hospitalizations - Coronavirus (virginia.gov)
COVID-19 Burden in Virginia LTCFs                                                                                                            Questions can be directed to: hai@vdh.virginia.gov                                                  Updated 1/11/2022

Key Trends                                                                                                                                    Number and Region of LTCF COVID-19 Outbreaks by Date VDH Notified
• There were 154 LTCF COVID-19 outbreaks reported in the past 30 days: 57 in Eastern,
  36 in Northwest, 24 in Central, 21 in Northern, and 16 in Southwest (see figure top right).
• The number of reported resident and staff cases have dramatically increased in the past
  few weeks (see figure bottom right).
   • For the reporting week ending January 9, 2022, 845 resident and 1,309 staff cases
     were reported to NHSN. Data for this reporting week are preliminary.
   • This is the highest number of resident cases reported during a week since January
     2021 and the highest number of staff cases reported since nursing homes began
     reporting to NHSN.
• For reporting week ending January 2, 2022, data reported from 282 nursing homes
  showed 89% of residents were fully vaccinated; data reported from 281 nursing homes
  showed 89% of staff were fully vaccinated (see figures bottom left).
   • Of the 19,476 residents eligible to receive an additional dose or booster, 13,472 (69%)
     have received an additional dose or booster of COVID-19 vaccine.
   • Of the 24,421 healthcare personnel eligible to receive an additional dose or booster,                                                     Outbreaks reported from nursing homes, assisted living facilities, and multicare facilities to VDH with a confirmed or suspected
     9,719 (40%) have received an additional dose or booster of COVID-19 vaccine.                                                              etiologic agent of SARS-CoV-2. Data are from the Virginia Outbreak Surveillance System as of 1/10/2022 and are subject to change.
                                                                                                                                               Please note that five SW outbreaks had been reported for the current week (week beginning 1/9/22) at the time of the data pull.

                                                                                                                                              Nursing Home Resident and Staff COVID-19 Cases
COVID-19 Booster Vaccination in Virginia Nursing Homes (n=286)
                 Nursing Home Residents                                                             Nursing Home Staff

Data are from the National Healthcare Safety Network (NHSN) as of 1/11/2022 and are subject to change, including booster eligibility per
updated vaccine guidance. In Virginia, 282 nursing homes reported resident vaccination data for reporting week ending 1/2/2022; 281 nursing    Data are from NHSN as of 1/11/2022 and are subject to change. For reporting information,
homes reported staff vaccination data for reporting week ending 1/2/2022. For staff type definitions, refer to NHSN Table of Instructions.     please refer to the NHSN data collection forms: residents, staff.
Virginia: Regional Metric Summary Updated 1/11/22
Metrics date: 1/9/2022
Central Eastern Far Southwest Near Southwest Northern Northwest
New cases per 100k
within the last 7 1,288.9 1,515.3 696.4 1,006 1,392.5 1208.2
days
% Positivity 7-day
moving average 33.2% 44.7% 24.4% 30.7% 33.4% 36.9%
COVID-like ED visits
rate per 100k 61.3 59.7 27.1 40.9 28.4 35.2
Symbol Trend
Burden Level 0 Level 1 Level 2 Level 3 Level 4 Please note: the methods used this
Increasing week have changed slightly; data is now
New Cases 100
% Positivity 10 Decreasing compared from Sunday to Sunday
CLI ED 6 instead of Wednesday to Wednesday
Fluctuating
Visits
Source: Region Metrics – Coronavirus
*Data represents a 7-day moving average, trends compared to 1 week ago comparing end of week totals from Sunday to Sunday 11Influenza Like Illness (ILI) Trends in the Commonwealth Updated 1/11/22
Region 3 Percentage of Visits for ILI (ending 1/1)
Region 3 Influenza Positive Tests from most
recent 3 weeks (ending 1/11)
A (H3) - 223
A (subtyping not performed) - 43
B (Lineage Unspecified) - 4
Source: National, Regional, and State Level Outpatient Illness and Viral Surveillance (cdc.gov)
UVA Biocomplexity InstituteLiterature Review: “Flurona” Coinfection of the Influenza and COVID-19 Updated 1/10
Coinfection by Severe Acute Respiratory Syndrome Coronavirus 2 and Influenza A(H1N1)pdm09 Virus Enhances the Severity of
Pneumonia in Golden Syrian Hamsters: November 20, 2020
A clinical study in hamsters observing the interaction between the co-circulating COVID-19 and seasonal Influenza.
• Simultaneous or sequential coinfection by COVID-19 and influenza caused more severe disease than monoinfection by either virus in
hamsters.
• Coinfected hamsters had more weight loss, more severe lung damage, body tissue inflammation, and intestinal inflammation.
• Simultaneous coinfection was associated with delay in resolution of lung damage, lower COVID-19 neutralizing antibody, and longer
COVID-19 shedding in oral swabs compared to that of COVID-19 monoinfection.
COVID-19 and Influenza Co-infection: A Systematic Review and Meta-Analysis: June 25, 2021
A systematic review and meta-analysis study analyzed the rate of coinfection of COVID-19 and Flu from Mar-Sept 2020, eleven prevalence
studies with total of 3,070 patients with COVID-19, and 79 patients with concurrent COVID-19 and influenza were selected for evaluation
• The prevalence of influenza infection was 0.8% in patients with confirmed COVID-19.
• Fever, cough, and shortness of breath were the most common clinical manifestations reported for COVID-19 and Flu coinfection.
• Further breakdown: eight case reports and seven case series with a total of 123 patients with COVID-19 were selected where 29
patients had coinfection with influenza viruses A/B. Within this sample 2 patients died (6.9%), and 17 out of 29 patients recovered
(58.6%)Literature Review: Omicron Hospitalization Updated 1/10
Comparison of Outcomes from COVID Infection in Pediatric and Adult Patients Before and After the Emergence of Omicron: January 2, 2022
A retrospective cohort study comparing severity of patient outcomes (ED visit, hospitalization, ICU admission, and mechanical ventilation) in
early Omicron (12/15/21-12/24/21) and Delta (9/1/21-11/15/21) waves within their first 3 days of infection:
• SARS-CoV-2 infections during early Omicron phase were associated with significantly less severe outcomes than first-time infections when
the Delta variant predominated (see tables below)
Comparison of 3 day Outcomes in Omicron and Age Stratified Comparison of 3 day Outcomes in Omicron and Delta Cohorts
Delta Cohorts (Across Ages)You can also read