Vehicle-based in situ observations of the water vapor isotopic composition across China: spatial and seasonal distributions and controls
←
→
Page content transcription
If your browser does not render page correctly, please read the page content below
Research article
Atmos. Chem. Phys., 23, 3409–3433, 2023
https://doi.org/10.5194/acp-23-3409-2023
© Author(s) 2023. This work is distributed under
the Creative Commons Attribution 4.0 License.

          Vehicle-based in situ observations of the water vapor
            isotopic composition across China: spatial and
                   seasonal distributions and controls
            Di Wang1,2,3 , Lide Tian1,3 , Camille Risi2 , Xuejie Wang1,3 , Jiangpeng Cui4 , Gabriel J. Bowen5 ,
                               Kei Yoshimura6 , Zhongwang Wei7 , and Laurent Z. X. Li2
          1 Institute of International Rivers and Eco-security, Yunnan University, Kunming 650500, Yunnan, China
                          2 Laboratoire de Météorologie Dynamique, IPSL, CNRS, Sorbonne Université,

                                         Campus Pierre et Marie Curie, Paris 75005, France
                       3 Yunnan Key Laboratory of International Rivers and Transboundary Eco-security,

                                                   Kunming 650500, Yunnan, China
               4 Sino-French Institute for Earth System Science, College of Urban and Environmental Sciences,

                                              Peking University, Beijing 100871, China
                    5 Department of Geology and Geophysics, and Global Change and Sustainability Center,

                                        University of Utah, Salt Lake City, Utah 84108, USA
                        6 Institute of Industrial Science, The University of Tokyo, Tokyo 113-8654, Japan
             7 School of Atmospheric Sciences, Sun Yat-sen University, Guangzhou 510275, Guangdong, China

                   Correspondence: Di Wang (di.wang@lmd.ipsl.fr) and Lide Tian (ldtian@ynu.edu.cn)

                                    Received: 22 March 2022 – Discussion started: 4 May 2022
                        Revised: 6 February 2023 – Accepted: 13 February 2023 – Published: 20 March 2023

      Abstract. Stable water isotopes are natural tracers in the hydrological cycle and have been applied in hydrology,
      atmospheric science, ecology, and paleoclimatology. However, the factors controlling the isotopic distribution,
      both at spatial and temporal scales, are debated in low and middle latitude regions, due to the significant influence
      of large-scale atmospheric circulation and complex sources of water vapor. For the first time, we made in situ ob-
      servations of near-surface vapor isotopes over a large region (over 10 000 km) across China in both pre-monsoon
      and monsoon seasons, using a newly designed vehicle-based vapor isotope monitoring system. Combined with
      daily and multiyear monthly mean outputs from the isotope-incorporated global spectral model (Iso-GSM) and
      infrared atmospheric sounding interferometer (IASI) satellite to calculate the relative contribution, we found
      that the observed spatial variations in both periods represent mainly seasonal mean spatial variations, but are
      influenced by more significant synoptic-scale variations during the monsoon period. The spatial variations of
      vapor δ 18 O are mainly controlled by Rayleigh distillation along air mass trajectories during the pre-monsoon
      period, but are significantly influenced by different moisture sources, continental recycling processes, and con-
      vection during moisture transport in the monsoon period. Thus, the North–South gradient observed during the
      pre-monsoon period is counteracted during the monsoon period. The seasonal variation of vapor δ 18 O reflects
      the influence of the summer monsoon convective precipitation in southern China and a dependence on temper-
      ature in the North. The spatial and seasonal variations in d-excess reflect the different moisture sources and the
      influence of continental recycling. Iso-GSM successfully captures the spatial distribution of vapor δ 18 O during
      the pre-monsoon period, but the performance is weaker during the monsoon period, maybe due to the underesti-
      mation of local or short-term high-frequency synoptic variations. These results provide an overview of the spatial
      distribution and seasonal variability of water isotopic composition in East Asia and their controlling factors, and
      they emphasize the need to interpret proxy records in the context of the regional system.

Published by Copernicus Publications on behalf of the European Geosciences Union.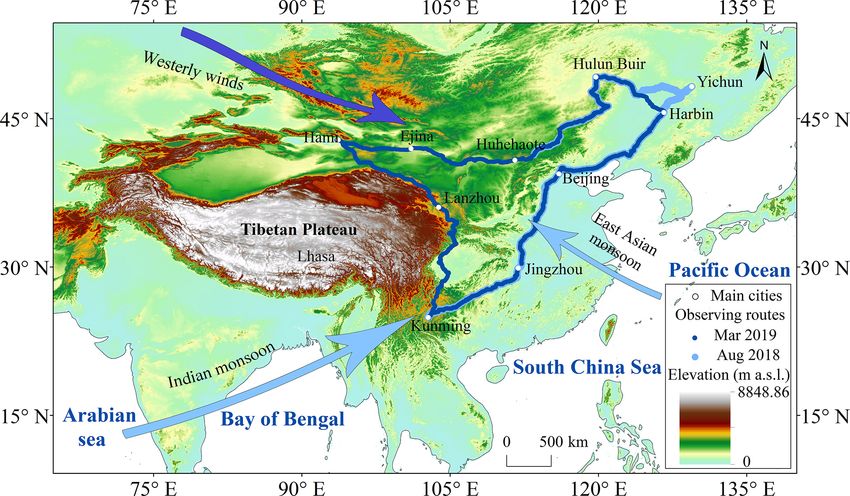
3410                   D. Wang et al.: Vehicle-based in situ observations of the water vapor isotopic composition in China

1   Introduction                                                  source, transport, convection, and mixing processes (Klein et
                                                                  al., 2015; Sánchez-Murillo et al., 2019; Wang et al., 2021),
                                                                  which requires higher frequency observations. For example,
Stable water isotopes have been applied to study a wide range     some studies found the impact of tropical cyclones (Gedzel-
of hydrological and climatic processes (Gat, 1996; Bowen          man, 2003; Bhattacharya et al., 2022), the boreal summer
et al., 2019; West et al., 2009). This is because water iso-      intraseasonal oscillation (BSISO) (Kikuchi, 2021), local or
topes vary with the water phases (e.g., evaporation, conden-      large-scale convections (Shi et al., 2020), cold front passages
sation), and therefore produce a natural labeling effect within   (Aemisegger et al., 2015), depressions (Saranya et al., 2018),
the global water cycle. Stable isotopic signals recorded in       and anticyclones (Khaykin et al., 2022) on water isotopes in
natural precipitation archives are used in the reconstructions    the Asian region. Additional data and analysis refining our
of ancient continental climate and hydrological cycles due        understanding of controls on the spatial and temporal vari-
to their strong relationship with local meteorological condi-     ation of water isotopes in low-latitude regions therefore are
tions. Examples include ice cores (Thompson, 2000; Yao et         needed.
al., 1991; Tian et al., 2006), tree-ring cellulose (Liu et al.,      Unlike precipitation, water vapor enters all stages of the
2017), stalagmites (Van Breukelen et al., 2008), and lake de-     hydrological cycle, experiencing frequent and intensive ex-
posits (Hou et al., 2007). However, unlike in polar ice cores,    change with other water phases; in particular, it is directly
isotopic records in ice cores from low and middle latitude        linked with water isotope fractionation. Furthermore, vapor
regions have encountered challenges as temperature proxies        isotopes can be measured in regions and periods without pre-
(Brown et al., 2006; Thompson et al., 1997).                      cipitation, and therefore have significant potential to trace
   The East Asian country of China is the main distribution       how water is transported, mixed, and exchanged (Galewsky
area of ice cores in the low and middle latitudes (Schneider      et al., 2016; Noone, 2008), as well as to diagnose large-
and Noone, 2007), where the interpretation of isotopic varia-     scale water cycle dynamics. Water vapor isotope data have
tions in natural precipitation archives are debated, because      been applied to various applications ranging from the ma-
they can be interpreted as recording temperature (Thomp-          rine boundary layer to continental recycling and to various
son et al., 1993, 1997, 2000; Thompson, 2000), regional-          geographical regions from tropical convection to polar cli-
scale rainfall or strength of the Indian monsoon (Pausata         mate reconstructions (Galewsky et al., 2016). The develop-
et al., 2011), or the origin of air masses (Aggarwal et al.,      ment of laser-based spectroscopic isotope analysis made the
2004; Risi et al., 2010). This is because China has a typical     precise, high-resolution, and real-time measurements of both
monsoon climate, and moisture from several sources mix in         vapor δ 18 O and δ 2 H available in recent decades. However,
this region (Wang, 2002; Domrös and Peng, 2012). In gen-          most of the in situ observations of water vapor isotopes are
eral, large parts of the country are affected by the Indian       also station based (e.g., Li et al., 2020; Tian et al., 2020;
monsoon and the East Asian monsoon in summer, which               Steen-Larsen et al., 2017; Aemisegger et al., 2014) or per-
bring humid marine moisture from the Indian Ocean, South          formed during ocean cruises (Thurnherr et al., 2020; Bonne
China Sea, and northwestern Pacific Ocean (Fig. 1). Dur-          et al., 2019; Liu et al., 2014; Kurita, 2011; Benetti et al.,
ing the non-monsoon seasons, the westerlies influence most        2017). One study made vehicle-based in situ observations
of northern China (Fig. 1). Westerlies brings extremely cold      to document spatial variations, but this was restricted to the
and dry air masses. Occasional moisture flow from the In-         Hawai’i island (Bailey et al., 2013). These observations pro-
dian Ocean and/or Pacific Ocean brings moisture to southern       vided new insight on moisture sources, synoptic influences,
China. Continental recycling, i.e., the moistening of the near-   and sea surface evaporation fractionation processes. How-
surface air by the evapotranspiration from the land surface       ever, in situ observations documenting continuous spatial
(transpiration by plants, evaporation of bare soil or stand-      variations at the large continental scale do not exist. This pa-
ing water bodies; Brubaker et al., 1993), is also an impor-       per presents the first isotope dataset documenting the spatial
tant source of water vapor in both seasons. Some of the spa-      variations of vapor isotopes over a large continental region
tial and seasonal patterns of water vapor transport are im-       (over 10 000 km), both during the pre-monsoon and monsoon
printed in the observed station-based precipitation isotopes      periods, based on vehicle-based in situ observations.
(Araguás-Araguás et al., 1998; Tian et al., 2007; Gray and           After describing our observed time series along the route
Wright, 1993; Mei’e et al., 1985; Tan, 2014). However, pre-       (Sect. 3.1 and 3.2), we quantify the relative contributions
cipitation isotopes can only be obtained at a limited num-        of seasonal mean spatial variations and synoptic-scale varia-
ber of stations and only on rainy days. The lack of con-          tions that locally disturb the seasonal mean to our observed
tinuous information makes it limited to analyze the effects       time series (Sect. 3.3). We show that our observed variations
of water vapor propagation and alternating monsoon and            in both seasons are dominated by spatial variations but are
westerlies. In addition, the seasonal pattern and the spa-        influenced by significant synoptic-scale variations during the
tial variation of water isotopes can strongly influenced by       monsoon period. On the basis of this we then focus on an-
synoptic-scale processes, through their influence on moisture

Atmos. Chem. Phys., 23, 3409–3433, 2023                                            https://doi.org/10.5194/acp-23-3409-2023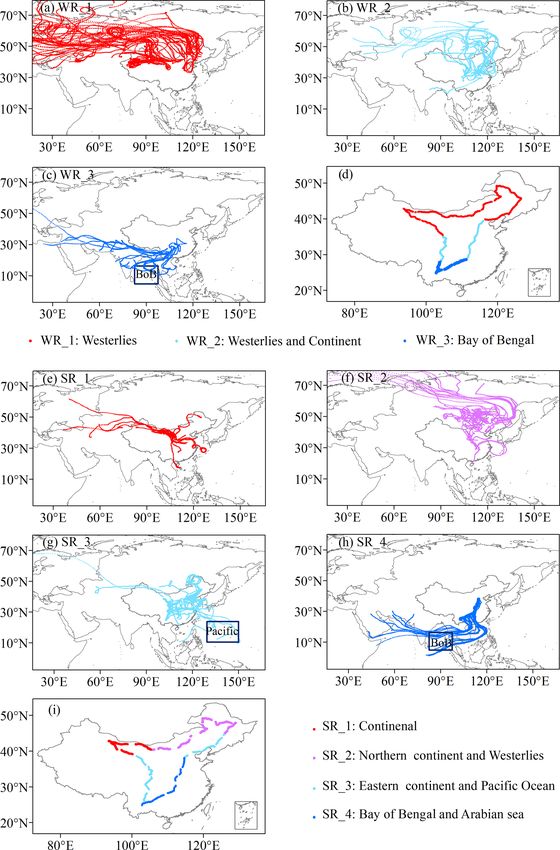
D. Wang et al.: Vehicle-based in situ observations of the water vapor isotopic composition in China                                        3411

alyzing the main mechanisms underlying these distributions         with a waterproof cover to keep large liquid droplets from en-
(Sect. 4). Collectively, these data and analyses provide a re-     tering. A portable GPS unit was used to record position data
fined understanding of how the interaction of the summer           along the route. The measured water vapor mixing ratio and
monsoon and westerly circulation controls water isotope ra-        the δ 18 O and δ 2 H were obtained with a temporal resolution
tios in East Asia.                                                 of ∼ 1 s. The dataset present in this study had been averaged
                                                                   to a 10 min temporal resolution after calibration, with a hori-
                                                                   zontal footprint of about 15 km.
2     Data and methods
                                                                      A standard delivery module (SDM) was used for the va-
2.1     Geophysical description                                    por isotope calibration during the surveys. The calibration
                                                                   protocols consist of humidity calibration (Sect. 2.2.3), stan-
We conducted two campaigns to monitor vapor isotopes               dard water calibration (Sect. 2.2.4), and error estimation
across a large part of China during the pre-monsoon (3             (Sect. 2.2.5), following the methods of Steen-Larsen et al.
to 26 March 2019) and the monsoon (28 July to 18 Au-               (2013).
gust 2018) periods, using a newly designed vehicle-based
vapor isotope monitoring system (Fig. S1). The two cam-            2.2.3    Humidity-dependent isotope bias correction
paigns run along almost the same route, with slight devia-
tion in the far northeast of China (Fig. 1). Our vehicle started   The measured vapor isotopes are sensitive to air humidity
from Kunming city in southwestern China, traveled north-           (Liu et al., 2014; Galewsky et al., 2016), which varies sub-
east to Harbin, then turned to northwestern China (Hami),          stantially across our sampling route. The specific humidity
and returned to Kunming. The expedition traversed most of          measured by Picarro is very close to that measured by an
East Asia, with a total distance of above 10 000 km for each       independent sensor installed in the vehicle (Fig. 4). The cor-
campaign.                                                          relation between the humidity measured by the Picarro and
                                                                   the independent sensor are over 0.99, the slopes are approx-
                                                                   imately 1, and the average deviations are less than 1 g kg−1
2.2     Vapor isotope measurements
                                                                   both during pre-monsoon and monsoon periods. We develop
2.2.1    Isotopic definitions                                      a humidity-dependent isotope bias correction by measuring a
                                                                   water standard at different water concentration settings using
Isotopic compositions of samples were reported as the rel-         the SDM. We define a reference level of 20 000 ppm of va-
ative deviations from the standard water (Vienna Standard          por humidity for our analysis (Eq. 3), since the water vapor
Mean Ocean Water, VSMOW), using the δ notion (McKin-               isotope measurement by Picarro is generally most accurate
ney et al., 1950), where Rsample and RVSMOW are the isotopic       at this humidity. The calibrated vapor isotope with different
ratios (H18      16       18        1 2 16    16
          2 O/H2 O for δ O and H H O/H2 O for δ H)
                                                        2
                                                                   air humidity would be as follows (Liu et al., 2014; Schmidt
of the sample and of the VSMOW, respectively, as follows:          et al., 2010):
δ = (Rsample /RVSMOW − 1) × 1000.                           (1)    δ_measured − δ_humidity calibration = f (humidity_measured − 20 000),    (3)
The second-order d-excess parameter is computed based on           where δ_measured represents the measured vapor isotopes
the commonly used definition (Dansgaard, 1964). The d-             (the raw data), δ_humidity calibration denotes the calibrated
excess is usually interpreted as reflecting the moisture source    vapor isotopes, f is the equation of δ as a func-
and evaporation conditions (Jouzel et al., 1997), since the d-     tion of humidity , and humidity is in ppm. For ex-
excess is more sensitive to non-equilibrium fractionation oc-      ample, if we measured that f is δ = a × ln(humidity) +
curring than δ 18 O:                                               b) by measuring standard water with different humid-
                                                                   ity, then the full equation for humidity-dependent isotope
d-excess = δ 2 H − 8 × δ 18 O.                              (2)    bias correction would be δ_measured −δ_humidity calibration = a×
                                                                   ln(humidity_measured ) + b − (a × ln(20 000) + b).
2.2.2    Instrument                                                   We performed the humidity calibration before and after
                                                                   each campaign. In the calibration, the setting of humidity
We used a Picarro 2130i cavity ring-down spectroscopy
                                                                   covered the actual range of humidity in the field. In the dry
(CRDS) water vapor isotope analyzer fixed on a vehicle to
                                                                   pre-monsoon period of 2019, the humidity was less than
obtain large-scale in situ measurements of near-surface va-
                                                                   5000 ppm along a large part of the route. In this case, we
por isotopes along the route. The analyzer was powered by
                                                                   performed additional calibration tests with the humidity less
a lithium battery on the vehicle, enabling over 8 h operation
                                                                   than 5000 ppm after the field observations, to guarantee the
with a full charge. Therefore, we only made measurements
                                                                   accuracy of the calibration results. The humidity-dependence
in daytime and recharged the battery at night. The ambient
                                                                   calibration function is considered constant throughout each
air inlet of the instrument was connected to the outside of the
                                                                   campaign (which each lasted less than 24 d).
vehicle, which was 1.5 m a.g.l. (meters above ground level),

https://doi.org/10.5194/acp-23-3409-2023                                              Atmos. Chem. Phys., 23, 3409–3433, 2023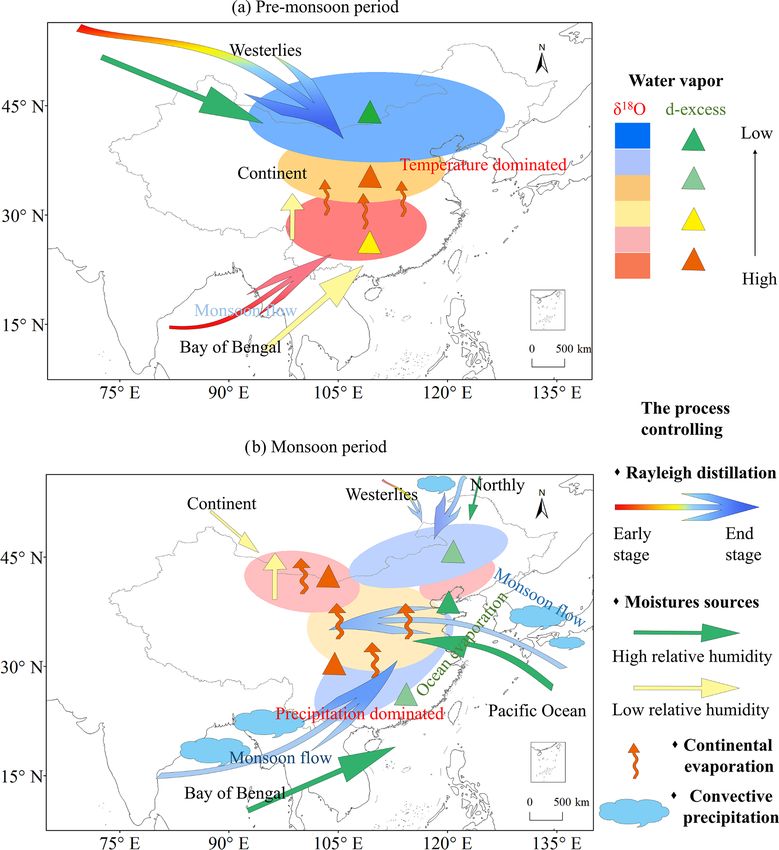
3412                     D. Wang et al.: Vehicle-based in situ observations of the water vapor isotopic composition in China

Figure 1. Topographical map of China, showing survey routes and the main atmospheric circulation systems (arrows). Dark blue dots
indicate the observation route for the 2019 pre-monsoon period, and light blue dots show the observation route for the 2018 monsoon period,
with a slight deviation in the northeast.

2.2.4   Measurement normalization                                       2.2.6   Data processing

All measured vapor isotope values were calibrated                       A few isotope measurements with missing GPS information
to the VSMOW scale using two laboratory stan-                           were excluded from the analysis. Since we want to focus on
dard waters (δ 18 O = −10.33 ‰ and δ 2 H = −76.95 ‰,                    large-scale variations, we also removed the observations dur-
δ 18 O = −29.86 ‰ and δ 2 H = −222.84 ‰) covering the                   ing rain or snow, to avoid situations where hydrometeor evap-
range of the expected ambient vapor values. We made the                 oration significantly influenced the observations (Tian et al.,
normalization test prior to the daily measurements (two                 2020). Such data represent only 0.03 % and 0.05 % of our
humidity levels for each standard water). We adjusted the               observations, respectively (totally, 48 data during the pre-
amount of the liquid standard injected everyday to keep                 monsoon season and 59 data during the monsoon season).
the humidity of the standard waters consistent with the                 We observed several d-excess pulses with extremely low val-
outside vapor measurements. Our calibration shows that no               ues, as low as −18.0 ‰, during the pre-monsoon period and
significant drift of the standard values were observed over             −4.9 ‰ during the monsoon period. These low values are un-
time in the observation periods. For two standard waters, the           usual in previous natural vapor isotope studies and occurred
standard deviation of standard measurements are 0.2 ‰ and               mostly when the measurement vehicle was entering or leav-
0.11 ‰ for δ 18 O, and 1.16 ‰ and 1.2 ‰ for δ 2 H during the            ing cities and/or stuck in traffic jams, and they have a much
pre-monsoon period of 2019. During the monsoon period                   lower intercept in the linear δ 18 O–δ 2 H relationship (Fig. S6).
of 2018, the standard deviation of standard measurements                Previous studies on urban vapor isotopes (Gorski et al., 2015;
are 0.09 ‰ and 0.06 ‰ for δ 18 O and 0.6 ‰ and 0.33 ‰ for               Fiorella et al., 2018, 2019) showed that the vapor d-excess
δ 2 H).                                                                 closely tracked changes in CO2 through inversion events and
                                                                        during the daily cycle dominated by patterns of human ac-
2.2.5   Error estimation                                                tivity, and combustion-derived water vapor is characterized
                                                                        by a low d-excess value due to its unique source. We also
We estimate the uncertainty based on the error between                  find that the d-excess values are especially low when the ve-
the measured (after calibration) and true values of the two             hicle was in cities in the afternoon. The values increased to
standards used during the campaigns. The estimated uncer-               normal during the night. This diurnal cycle is likely related
tainty is in the range of −0.05 to 0.17 for δ 18 O, 0.11 to             to the emission intensity and atmospheric processes (Fiorella
1.19 for δ 2 H, and −0.81 ‰ to 1.23 ‰ for d-excess dur-                 et al., 2018). Some of these d-excess anomalies are not ex-
ing the pre-monsoon period of 2019, with the humidity                   cluded from being affected by the baseline effects emerging
ranges from 2000 to 29 000 ppm. During the monsoon pe-                  from rapid changes in concentrations of different trace gases
riod of 2018, the range of uncertainty is −0.10 ‰–0.55 ‰ for            (Johnson and Rella, 2017; Gralher et al., 2016). We therefore
δ 18 O, −0.94 ‰–3.74 ‰ for δ 2 H, and −1.18 ‰–1.49 ‰ for                excluded these data (133 data points during the pre-monsoon
d-excess, with the humidity ranges from 4000 to 34 000 ppm.             period and 62 data points during the monsoon period repre-

Atmos. Chem. Phys., 23, 3409–3433, 2023                                                   https://doi.org/10.5194/acp-23-3409-2023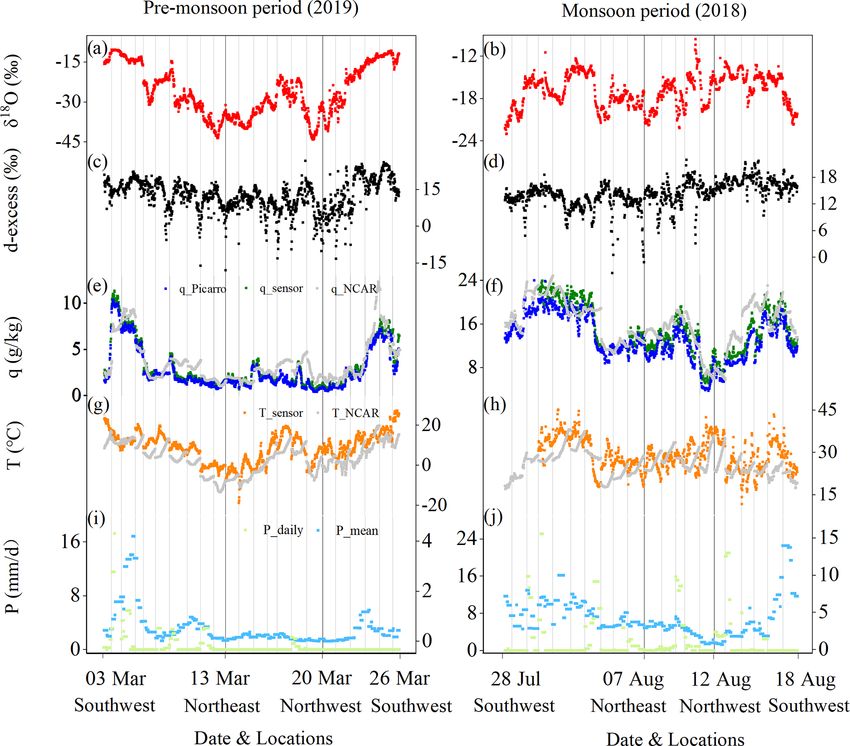
D. Wang et al.: Vehicle-based in situ observations of the water vapor isotopic composition in China                       3413

sent 0.10 % and 0.06 % of our observations, respectively) in     observed spatial–temporal distribution of vapor isotopes, we
the discussion on the general spatial feature (except Fig. 4).   start with a diagnosis of the geographical origin of the air
Outside of towns, country sources, such as irrigation, farms,    masses and then analyze the processes along the back trajec-
and power plants, cannot be completely ruled out. However,       tories.
we expect their influence to be much smaller than large-scale       To trace the geographical origin of the air masses, the
spatial variations.                                              HYSPLIT-compatible meteorological dataset of the global
                                                                 data assimilation system (GDAS) is used (available at
2.3   Meteorological observations
                                                                 ftp://arlftp.arlhq.noaa.gov/pub/archives/gdas1/, last access:
                                                                 March 2022). We select the driving locations every 2 h as
We fixed a portable weather station on the roof of the vehicle   starting points for the backward trajectories and make 10 d
to obtain air temperature (T ), dew-point temperature (Td ),     back trajectories from 1000 m a.g.l. using the Hybrid Sin-
air pressure (Pres), and relative humidity (RH). All sensors     gle Particle Lagrangian Integrated Trajectory model 4 (HYS-
were located near the ambient air intake. The specific hu-       PLIT4) (Draxler and Hess, 1998). This is representative of
midity (q) of the near-surface air was calculated from Td and    the water vapor near the ground (Guo et al., 2017; Bershaw
Pres. Meteorological data, GPS location data, and vapor iso-     et al., 2012), since most water vapor in the atmosphere is
tope data were synchronized according to their measurement       within 0–2 km a.g.l. (Wallace and Hobbs, 2006). The T , q,
times. And all of them also had been averaged to a 10 min        P , and RH along the back trajectories are also interpolated
temporal resolution.                                             by the HYSPLIT4 model (Fig. 2).
   National Centers for Environmental Prediction/National           Based on the tracing results from HYSPLIT4 model, we
Center for Atmospheric Research (NCEP/NCAR) 2.5◦                 speculate on the potential water vapor sources (Fig. 3 and
global reanalysis data are used to determine the large-scale     Table 1):
factors influencing the spatial pattern of the vapor iso-           During the pre-monsoon period, we categorize our domain
topes, including the surface T , q, U wind and V wind,           into three regions (Table 1) as follows:
and RH, which are available at https://psl.noaa.gov/data/
gridded/data.ncep.reanalysis.surface.html      (last   access:    1. In northern China (WR_1), the air is mainly advected
March 2022). Some missing meteorological data (during                by the westerlies.
the pre-monsoon period: q on 8 and 18 March 2019; during          2. In central China (WR_2), the air also comes from the
the monsoon period: T and q from 28 to 31 July 2018,                 westerlies but with a slower wind speed (as shown by
and q on 5 August 2018) along the survey routes due to               the shorter trajectories in 10 d), suggesting the potential
instrument failure are acquired from the NCEP/NCAR                   for greater interaction with the land surface and more
reanalysis data. To match the vapor isotope data along the           continental recycling as the moisture source.
route, we linearly interpolate the NCEP/NCAR data to the
location and time of each measurement. The interpolated           3. In southern China (WR_3), trajectories come from the
T and q from NCEP/NCAR are highly correlated with our                southwest and South with marine moisture sources from
measurement, as shown in Fig. 4h and j. The 1◦ precipitation         the Bay of Bengal (BoB).
amount (P ) from the Global Precipitation Climatol-
ogy Project (GPCP) is used (https://www.ncei.noaa.gov/              During the monsoon period, we categorize our domain
data/global-precipitation-climatology-project-gpcp-daily/        into four regions (Table 1) as follows:
access/, last access: March 2022). When comparing the time        1. In northwestern China (SR_1), most air masses also
series of GPCP data with our observed isotopes, we linearly          spend considerable time over the continent, suggesting
interpolate the daily GPCP data to the location of each              some of the vapor can be recycled by continental recy-
observation location (P daily). We also used the average of          cling.
the GPCP precipitation over the entire observation period
of about 1 month for each observation location (P mean).          2. In northeastern China (SR_2), trajectories mainly come
The 2.5◦ outgoing longwave radiation (OLR) data can be               from the North and though the westerlies.
obtained from NOAA (http://www.esrl.noaa.gov/psd/data/
gridded/data.interp_OLR.html, last access: March 2022).           3. In central China (SR_3), both in its eastern (from Bei-
                                                                     jing to Harbin) and western part, trajectories mainly
                                                                     come from the East. This suggests that vapor mainly
2.4   Back-trajectory calculation and categorizing regions           comes from the Pacific Ocean or from continental recy-
      based on air mass origin                                       cling over eastern and central China.
The vapor isotope composition is a combined result of             4. In southeastern China (SR_4), trajectories come from
moisture source (Tian et al., 2007; Araguás-Araguás et al.,          the South, suggesting marine moisture sources from the
1998), condensation, and mixing processes along the mois-            Arabian Sea and the BoB.
ture transport route (Galewsky et al., 2016). To interpret the

https://doi.org/10.5194/acp-23-3409-2023                                        Atmos. Chem. Phys., 23, 3409–3433, 2023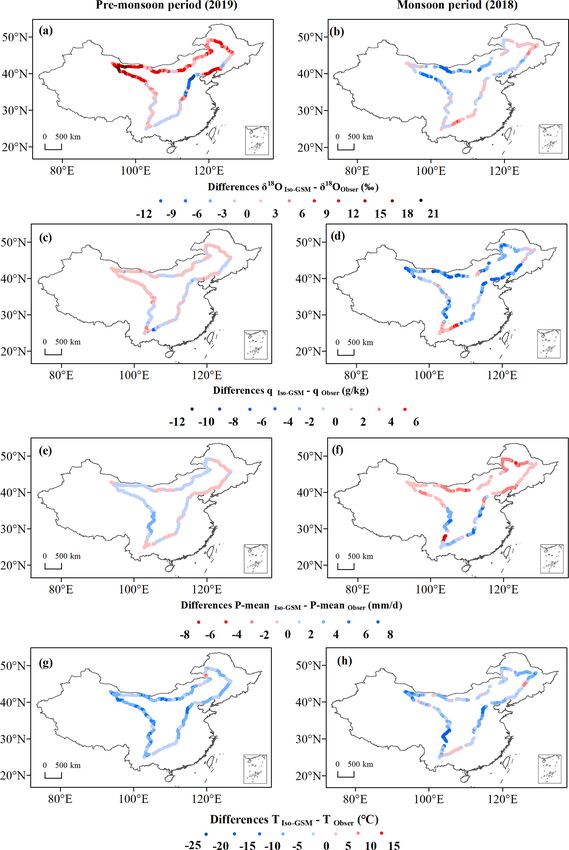
3414 D. Wang et al.: Vehicle-based in situ observations of the water vapor isotopic composition in China
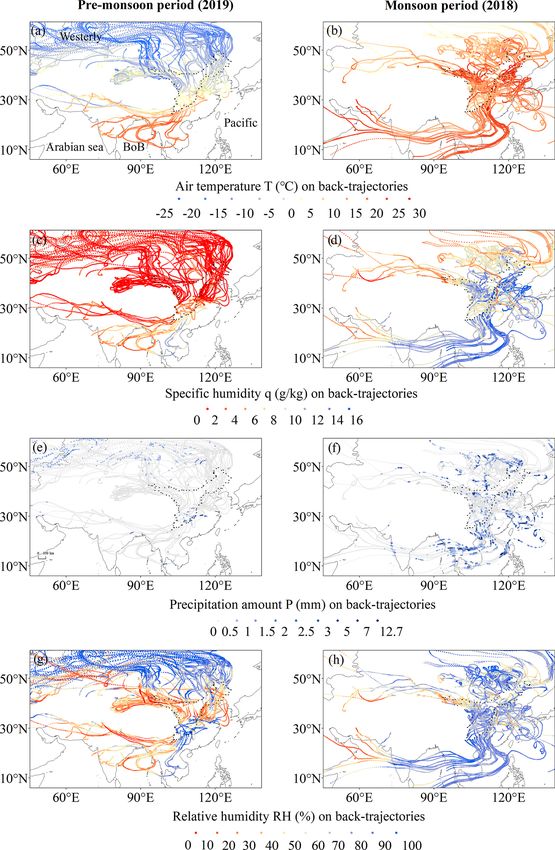
Figure 2. Meteorological conditions simulated by the HYSPLIT4 model along the 10 d air back trajectories for the on-route sampling
positions during the two surveys: (a, b) air temperature T (◦ C), (c, d) specific humidity q (g kg−1 ), (e, f) precipitation amount P (mm), and
(g, h) relative humidity RH (%). The left panel is for the pre-monsoon period, and the right is for the monsoon period. The driving locations
and time every 2 h are used as starting points. Note: BoB is the abbreviation for the Bay of Bengal.
2.5 General circulation model simulation and satellite circulation model (Iso-GSM) simulations (Yoshimura and
measurements Kanamitsu, 2009) at 1.915◦ × 1.875◦ and the lowest level
(the altitude is about 2950 m) isotope retrievals from satel-
To disentangle the spatial and synoptic influences, we use lite infrared atmospheric sounding interferometer (IASI) at
surface layer variables from an isotope-enabled general
Atmos. Chem. Phys., 23, 3409–3433, 2023 https://doi.org/10.5194/acp-23-3409-2023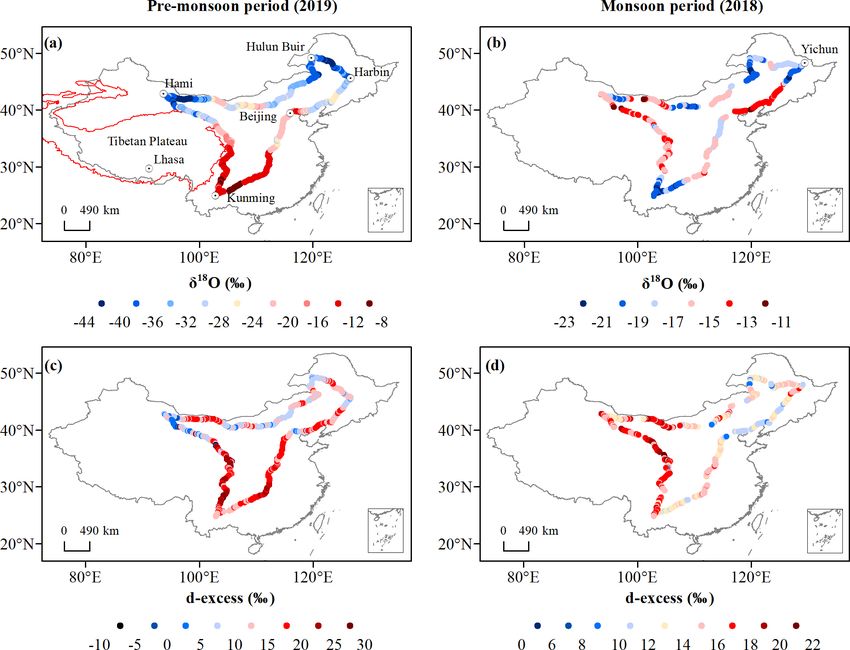
D. Wang et al.: Vehicle-based in situ observations of the water vapor isotopic composition in China                                     3415

Figure 3. The backward trajectory results (a, b, and c for the pre-monsoon period, and e, f, g, and h for the monsoon period) and the dividing
of the study zones based on geographical origin of the air masses (d for the pre-monsoon period and i for the monsoon period). Note: BoB
is the abbreviation for the Bay of Bengal.

1◦ × 1◦ . For both datasets, we use the outputs corresponding            outputs, we select the nearest grid point for a given latitude
to the observation location and the observation date (daily              and longitude of each measurement. For Iso-GSM simula-
outputs) and the multiyear monthly mean outputs (March                   tions, because of the coarse resolution of the model, there is a
monthly for the pre-monsoon period and August monthly                    difference between the altitude observed along the sampling
for the monsoon period) for each observation location from               route and that of the nearest grid point. Therefore, we cor-
2015 to 2020. When interpolating daily/multiyear monthly                 rect the outputs of Iso-GSM for this altitude difference (the

https://doi.org/10.5194/acp-23-3409-2023                                                  Atmos. Chem. Phys., 23, 3409–3433, 2023
3416                          D. Wang et al.: Vehicle-based in situ observations of the water vapor isotopic composition in China

Table 1. The dividing of the study zones based on moisture sources and corresponding vapor δ 18 O–δ 2 H relationship.

                                                                       Pre-monsoon period (2019)
                Water sources (Fig. 3)                Region (China)            Climate background     δ 18 O–δ 2 H relationship
      WR_1      Westerlies                            The North                 Westerlies domain      δ 18 O = 8.04δ 2 H + 12.00 (r 2 = 0.99, n = 750, q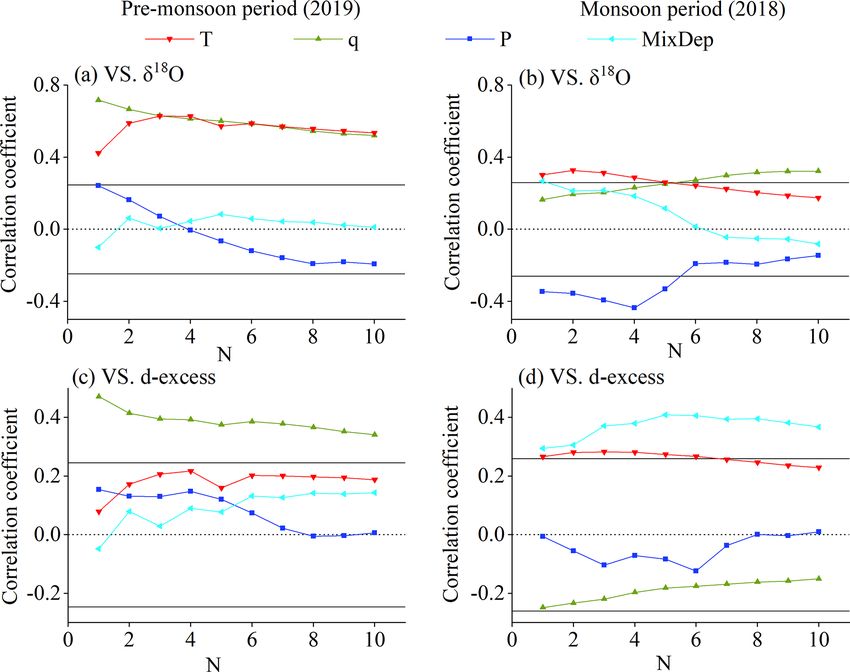
D. Wang et al.: Vehicle-based in situ observations of the water vapor isotopic composition in China                         3417

   The same analysis is also performed for δ 2 H retrieved         in northern China. In previous studies, a higher precipitation
from IASI and the Iso-GSM simulation q (Table 2) and re-           d-excess during the pre-monsoon period was also observed in
analysis q (Table 3).                                              the Asian monsoon region owing to the lower relative humid-
                                                                   ity (RH) at the surface in the moisture source region (Tian et
                                                                   al., 2007; Jouzel et al., 1997). The same reason probably ex-
3     Spatial and seasonal variations
                                                                   plains the higher vapor d-excess in southern China observed
3.1    Raw time series
                                                                   here. Alternatively, the high d-excess in South China could
                                                                   also result from the moisture flow from the Indian/Pacific
Our survey of the vapor isotopes yields two snapshots of the       Ocean, or from the deeper convective mixed layer in South
isotopic distribution along the route (Figs. 4 and 5). Figure 4    China compared to North China. The lower d-excess values
shows the variations of observed 10 min averaged surface va-       (as low as −10 ‰ to 10 ‰) in northern China (between 38
por δ 18 O and d-excess along the survey route across China        and 51◦ N) have rarely been reported in earlier studies. The
during the pre-monsoon and monsoon campaigns. The fig-             spatial distribution of the observed vapor d-excess could re-
ure also shows the concurrent meteorological data from the         flect the general latitudinal gradient of d-excess observed at
weather station installed on the vehicle, and the water va-        the global scale, with a strong poleward decrease in midlati-
por content recorded by the Picarro water vapor isotope ana-       tudes (between around 20 to 60◦ ), which was found in previ-
lyzer as a comparison. We extract daily precipitation amount       ous studies on the large-scale distribution of d-excess in va-
(P daily) and average precipitation amount over the entire         por (Thurnherr et al., 2020; Benetti et al., 2017) and precipi-
observation period of about 1 month for each observation           tation (Risi et al., 2013a; Terzer-Wassmuth et al., 2021; Pfahl
location (P mean) (mm d−1 ) from GPCP. The vapor δ 18 O            and Sodemann, 2014; Bowen and Revenaugh, 2003), based
shows high magnitude variations in both seasons. A general         on both observations and modeling. During the monsoon pe-
decreasing–increasing trend overlapped with short-term fluc-       riod, the lowest values of vapor δ 18 O are found in south-
tuations is observed during the pre-monsoon period, whereas        western and northeastern China, with a range of −23 ‰ to
no general trend but frequent fluctuations characterized the       −19 ‰ (Fig. 5b). Higher vapor δ 18 O values up to −11 ‰ are
monsoon period. The δ 18 O range is much larger during the         found in central China. The vapor d-excess values (Fig. 5d)
pre-monsoon period (varying between −44 ‰ and −8 ‰)                in western and northwestern China (91–109◦ E, 24–43◦ N)
than during the monsoon period (from −11 ‰ to −23 ‰).              are roughly between 16 ‰ and 22 ‰, higher than in eastern
Most measured vapor d-excess values range from 5 ‰ to              China (mostly between 0 ‰ and 16 ‰).
25 ‰ during the pre-monsoon period and from 10 ‰ to 22 ‰              We do not know whether these apparent spatial variations
during the monsoon period.                                         represent the seasonal mean or whether it is mainly affected
   Comparison with the concurrently observed meteorologi-          by synoptic perturbations. We therefore use Iso-GSM simu-
cal data shows a robust air temperature (T ) dependence of         lation results and IASI satellite measurements to quantify the
the vapor δ 18 O variations. In particular, the general trend of   relative contributions of seasonal mean and synoptic pertur-
δ 18 O is roughly consistent with T variation during the pre-      bations in Sect. 3.3.
monsoon period (Fig. 4a and g). During the pre-monsoon pe-
riod, humidity (Fig. 4e and i), P mean (Fig. 4k), and vapor        3.3   Disentangling seasonal mean and synoptic
δ 18 O (Fig. 4a) are much higher in southwestern China (at               variations
the beginning and end of the campaign) than in any other
regions. Humidity, q, and P mean also vary consistently            Figure 6 shows the comparison of the measured vapor δ 2 H,
throughout the route during the monsoon period (Fig. 4f, j,        simulated δ 2 H from Iso-GSM, and the δ 2 H retrieved from
and l). Synoptic effects on the observed vapor isotopes are        IASI. Iso-GSM captures the variations in observed vapor δ 2 H
discussed in detail in Sect. 4.3 and 4.6.                          well during the pre-monsoon period, with a correlation co-
                                                                   efficient of r = 0.84 (p0.05) (Table S3). The largest
excess during the two surveys in different seasons are pre-        differences occur in the SR_1 zone. IASI captures varia-
sented in Figure 5. During the pre-monsoon period, we find         tions better than Iso-GSM during the monsoon period, with
a South–North gradient of vapor δ 18 O (Fig. 5a). The va-          r = 0.42 (p>0.05). IASI observes over a broad range of alti-
por δ 18 O ranges from −8 ‰ to −16 ‰ in southern China             tudes above the ground level, so we expect lower δ 2 H in IASI
to as low as −24 ‰ to −44 ‰ in the North. A roughly sim-           relative to ground-surface observations, but the variations of
ilar spatial pattern is observed for the vapor d-excess during     vapor isotopes are vertically coherent (Fig. 6). The system-
the pre-monsoon period (Fig. 5c). The d-excess value ranges        atic differences between IASI and ground-level observations
from 10 ‰ to 30 ‰ in southern China and from −10 ‰ to              do not impact the slope of the correlation, and thus does not
+20 ‰ (most observations with values from 5 ‰ to +20 ‰)            impact the contribution estimation.

https://doi.org/10.5194/acp-23-3409-2023                                          Atmos. Chem. Phys., 23, 3409–3433, 2023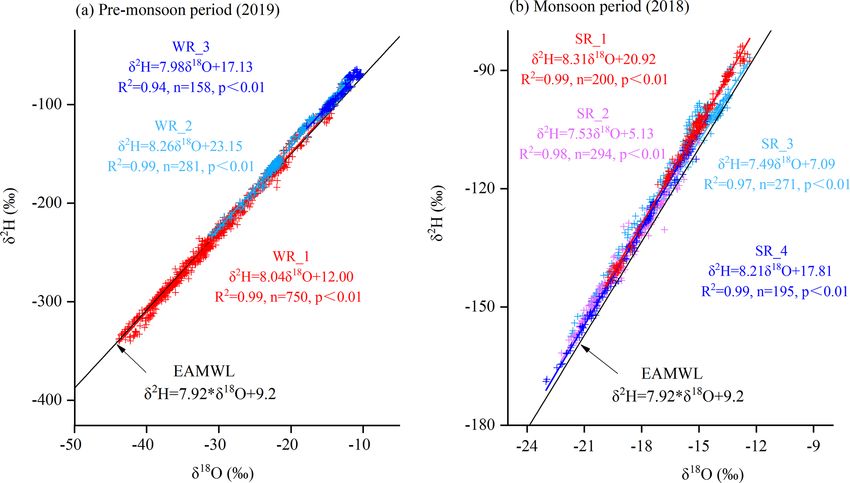
3418                     D. Wang et al.: Vehicle-based in situ observations of the water vapor isotopic composition in China

Figure 4. Measured vapor isotopic compositions and concurrent meteorological conditions along the survey routes during the pre-monsoon
period (the left panel) and monsoon period (the right panel). (a, b) Vapor δ 18 O (‰); (c, d) vapor d-excess (‰); (e, f) specific humidity
q (g kg−1 ) measured by sensor (in green), measured by Picarro (in blue), and linearly interpolated from NCAR reanalysis (in gray); (g,
h) air temperature T (◦ C) measured by Picarro (in orange) and linearly interpolated from NCAR reanalysis (in gray); and (i, j) the daily
precipitation amount P daily (in green, mm d−1 ) and average precipitation amount over the entire observation period of about 1 month for
each observation location P mean (in blue, mm d−1 ) extracted from GPCP. Note that the vertical gray lines space the observations for 1 d.

   The multiyear monthly means of δ 2 H are smoother but               of q (a_seaso is 71 %–82 % from Iso-GSM and 69 %–95 %
similar to those for the daily outputs both from Iso-GSM and           from reanalysis, whereas a_synoptic is 29 %–18 % from Iso-
IASI (Fig. 6). Using the method in Sect. 2.6, taking into ac-          GSM and 31 %–5 % from reanalysis). Since Iso-GSM does
count the error, we calculate the relative contribution ranges         not capture daily variations of δ 2 H very well during the mon-
of the seasonal mean and synoptic scale on our observed vari-          soon period, the relative contribution has a large threshold
ations using q and δ 2 H from Iso-GSM simulations, q from              range (a_seaso is 9 %–87 %, a_synoptic is 91 %–13 %) after ac-
NCEP/NCAR reanalysis, and δ 2 H from IASI.                             counting for the errors. Therefore, we can not conclude the
   During the pre-monsoon period, based on both the Iso-               dominant contribution on δ 2 H from Iso-GSM outputs. IASI,
GSM simulation and NCEP/NCAR reanalysis, we can find                   which has a higher correlation with observations, provides
that the seasonal mean contribution to the measured q                  an more credible range of a_seaso , about 53 %–84 %, and
is higher than the synoptic-scale contribution: a_seaso is             a_synoptic is 47 %–16 %. These suggest that during the mon-
73 %–102 % from Iso-GSM and 77 %–92 % from reanaly-                    soon period, the synoptic contribution can be significant but
sis, whereas a_synoptic is 27 % to −2 % from Iso-GSM and               not dominant. Having understood the factors influencing the
23 %–8 % from reanalysis (Tables 2 and 3). The relative con-           spatial and seasonal variation of vapor isotopes in Sect. 4, we
tribution of seasonal mean spatial variations to the total mea-        will be able to better understand the reasons for the inconsis-
sured variations in δ 2 H (60 %–98 %) is also higher than that         tent performance of Iso-GSM during the pre-monsoon and
of synoptic-scale variations (40 %–2 %). This suggests that            monsoon periods (in Sect. 4.6).
the observed variability in q and δ 2 H is mainly due to spa-
tial variability and marginally due to synoptic-scale variabil-
ity. During the monsoon, seasonal mean spatial variations
are also the main contributions to the observed variations

Atmos. Chem. Phys., 23, 3409–3433, 2023                                                   https://doi.org/10.5194/acp-23-3409-2023
D. Wang et al.: Vehicle-based in situ observations of the water vapor isotopic composition in China                                         3419

Figure 5. Spatial distribution of vapor δ 18 O (a, b) and d-excess (c, d) during the pre-monsoon period (a, c) and the monsoon period (b, d).

Table 2. The relative contribution (in fraction) of spatial variations for a given season (a_seaso ) and of synoptic-scale variations (a_synoptic )
to the daily variations of q and δ 2 H simulated by Iso-GSM and retrievals from IASI. We checked that the sum of a_seaso and a_synoptic is
always 1. The two values indicate the lower and upper bounds as calculated from Eqs. (8) and (9).

                                 Period                   Data         Variables            Contributions
                                                                                        a_seaso        a_synoptic
                                                                       q             0.73–1.02     0.27 to −0.02
                                                          Iso_GSM
                                 Pre-monsoon (2019)                    δ2 H          0.60–0.98         0.40–0.02
                                                          IASI         δ2 H          1.06–0.94       −0.06–0.06
                                                                       q             0.71–0.82         0.29–0.18
                                                          Iso_GSM
                                 Monsoon (2018)                        δ2 H          0.09–0.87         0.91–0.13
                                                          IASI         δ2 H          0.53–0.84         0.47–0.16

3.4   Seasonal variations                                                        The climate in China features strong seasonality, and it is
                                                                              captured in the snapshots of vapor isotopes (Fig. 7). Since
During the monsoon season, synoptic-scale and intra-
                                                                              the observation routes of the two surveys are almost iden-
seasonal variations contribute significantly to the apparent
                                                                              tical, we make a seasonal comparison of the observed va-
spatial patterns. However, since these variations are not dom-
                                                                              por isotopes during the two surveys. The lines are drawn to
inant and have a smaller amplitude than seasonal differences,
                                                                              distinguish between positive and negative values of seasonal
the comparison of the two snapshots do provide a represen-
                                                                              isotopic differences. The seasonal differences δ 18 Omonsoon −
tative picture of the climatological seasonal difference.
                                                                              δ 18 Opre-monsoon (Fig. 7a) show opposite signs in northern and

https://doi.org/10.5194/acp-23-3409-2023                                                      Atmos. Chem. Phys., 23, 3409–3433, 2023
3420 D. Wang et al.: Vehicle-based in situ observations of the water vapor isotopic composition in China
excess do not overlap, suggesting different controls on water
vapor δ 18 O and d-excess.
4 Understanding the factors controlling the spatial
and seasonal distributions
To interpret the spatial and seasonal variations observed both
across China and in each region defined in Sect. 2.4, we in-
vestigate q–δ diagrams (Sect. 4.1), δ 18 O–δ 2 H relationships
(Sect. 4.2), relationships with meteorological conditions at
the local and regional scale (Sect. 4.3 and 4.4), the impact of
air mass origin (Sect. 4.5), and synoptic events (Sect. 4.6).
4.1 q –δ diagrams
The progressive condensation of water vapor from an air
parcel from the source region to the sampling site and the
subsequent removal of condensate results in a gradual re-
duction of humidity and vapor isotope ratios. This relation-
ship can be visualized in a q–δ diagram, which has been
used in many studies of the vapor isotopic composition
(Noone, 2012; Galewsky et al., 2016). Observations along
the Rayleigh distillation line indicate progressive dehydra-
Figure 6. Comparison of observed vapor δ 2 H (observations) with
tion by condensation. Observations above the Rayleigh line
outputs of isotope-enabled general circulation model Iso-GSM and
satellite IASI during the pre-monsoon period (a) and monsoon pe- indicate either mixing between air masses of contrasting hu-
riod (b). The results in this graph are from the daily and multiyear midity (Galewsky and Hurley, 2010) or evapotranspiration
monthly outputs for the sampling locations. (Galewsky et al., 2011; Samuels-Crow et al., 2015; Noone,
2012; Worden et al., 2007). Observations below the Rayleigh
line, even when considering the most depleted initial vapor
Table 3. The same as Table 2, but for reanalysis q. conditions (light blue Rayleigh curve in Fig. 8b), indicate
the influence of rain evaporation from depleted precipita-
Period Variables Contributions tion (Noone, 2012; Worden et al., 2007). Figure 8 shows the
observed vapor q–δ 2 H for different regions during the pre-
a_seaso a_synoptic
monsoon (a) and monsoon (b) period. This figure will be in-
Pre-monsoon (2019) q 0.77–0.92 0.23–0.08 terpreted in the light of meteorological variables along back
Monsoon (2018) q 0.69–0.95 0.31–0.05 trajectories (Fig. 2).
During the pre-monsoon period, most q–δ 2 H measure-
ments are located surrounding or overlapping the Rayleigh
curve (the solid black curve in Fig. 8a). Therefore, the ob-
southern China. In northern China, water vapor δ 18 O values served spatial pattern can mostly be explained by the gradual
are higher during the monsoon period than during the pre- depletion of vapor isotopes by condensation. The data for the
monsoon period, while the opposite is true in southern China. three moisture sources are distributed in different positions of
The boundary is located around 35◦ N. The largest seasonal the Rayleigh curve, and they relate to different moisture ori-
contrasts occur in southwest, northwest, and northeast China, gins or different original vapor isotope values. This is con-
with seasonal δ 18 O differences of −15 ‰, 30 ‰, and 30 ‰, firmed by the back-trajectory analysis: the westerlies bring
respectively. cold and dry air to northern China (WR_1, Figs. 3a, 2a and c),
We also find a spatial pattern of vapor d-excess season- consistent with the vapor further along the Rayleigh distilla-
ality (Fig. 7b). The line separating the areas of positive and tion, and are thus very depleted (Fig. 5a). The observations in
negative values of the d-excessmonsoon − d-excesspre-monsoon the WR_1 region (Fig. 3c) are closer to the q–δ 2 H Rayleigh
differences coincides with the 120 mm mean precipitation distillation curve calculated for the key moisture source re-
line (Fig. S2f). In southeastern China, the water vapor d- gions of westerlies, providing further evidence of the influ-
excess is lower during the monsoon period than during the ence of water vapor source on vapor isotopes. The relatively
pre-monsoon period. The pattern of seasonal water vapor d- high T and q along the ocean-sourced air trajectory reaching
excess in northwestern China is the opposite. The two bound- southern China (WR_3, Figs. 3c, 2a and c) is consistent with
ary lines separating the seasonal variations of δ 18 O and d- an early Rayleigh distillation phase during moisture transport
Atmos. Chem. Phys., 23, 3409–3433, 2023 https://doi.org/10.5194/acp-23-3409-2023D. Wang et al.: Vehicle-based in situ observations of the water vapor isotopic composition in China 3421 Figure 7. Spatial distribution of the isotope differences (δ 18 Omonsoon − δ 18 Opre-monsoon (a) and d-excessmonsoon − d-excesspre-monsoon (b)) for the observation locations. The solid black lines separate the areas of positive and negative values of the differences. Figure 8. Scatterplot of observed vapor δ 2 H (‰) versus specific humidity q (g kg−1 ) during the pre-monsoon period (a) and monsoon (b) period. The solid black curves show the Rayleigh distillation line calculated for the initial conditions of δ 2 H0 = −50 ‰ and T = 15 ◦ C during the pre-monsoon period and δ 2 H0 = −80 ‰ and T = 25 ◦ C during the monsoon period. The mixing lines (dashed black curves) are calculated using a dry endmember with q = 0.2 g kg−1 and δ 2 H = −500 ‰ and air parcels for the corresponding Rayleigh curve as a wet endmember. The solid colored curves show the uncertainty range of the Rayleigh curve, calculated for different initial conditions of key moisture source regions: during March 2019, light red and light blue Rayleigh curves are calculated for key moisture source regions of westerlies (δ 2 H0 = −168.04 ‰, T = 5 ◦ C) and BoB (δ 2 H0 = −77.37 ‰, T = 26.46 ◦ C) separately in (a); during July–August 2018, light red and light blue Rayleigh curves are calculated for key moisture source regions of westerlies (δ 2 H0 = −149.64 ‰, T = 6.16 ◦ C) and BoB (δ 2 H0 = −82.75 ‰, T = 27.69 ◦ C) separately in (b). These initial δ 2 H are derived from Iso-GSM, and the initial temperature and RH are derived from NCAR/NCEP 2.5◦ global reanalysis data. and thus higher water vapor δ 18 O in southern China (Fig. 5a). during moisture transport. Data measured in the SR_1 re- Some observations in the WR_3 region (Fig. 3c) are located gion (Fig. 3i) fall above the Rayleigh distillation line (solid below the q–δ 2 H Rayleigh distillation curve, indicating the black curve in Fig. 8b), likely due to the presence of mois- influence of rain evaporation (Noone, 2012; Worden et al., ture originating from continental recycling. A larger num- 2007). This is consistent with the fact that air originates from ber of q–δ 2 H measurements (most of the measurements from the BoB, where deep convection begins to be active, and thus the SR_2, SR_3, and SR_4 regions, Fig. 3i) are located be- rain evaporation become a source of water vapor. low the Rayleigh curve, indicating moisture originating from During the monsoon period, we find a scattered relation- the evaporation of raindrops within and below convective ship in the q–δ 2 H diagram for different regions, implying systems (Noone, 2012; Worden et al., 2007). In SR_3 and different moisture sources and/or water recycling patterns SR_4 regions, this is consistent with the high precipitation https://doi.org/10.5194/acp-23-3409-2023 Atmos. Chem. Phys., 23, 3409–3433, 2023
3422                    D. Wang et al.: Vehicle-based in situ observations of the water vapor isotopic composition in China

rate along southerly and easterly back trajectories (Fig. 2f).     cept (δ 2 H = 8.26δ 18 O + 23.15). These properties are associ-
The convection is active over the Bay of Bengal, Pacific           ated with a high d-excess, consistent with strong continental
Ocean, and southeastern Asia, as shown by the low OLR              recycling by evapotranspiration (Aemisegger et al., 2014),
(
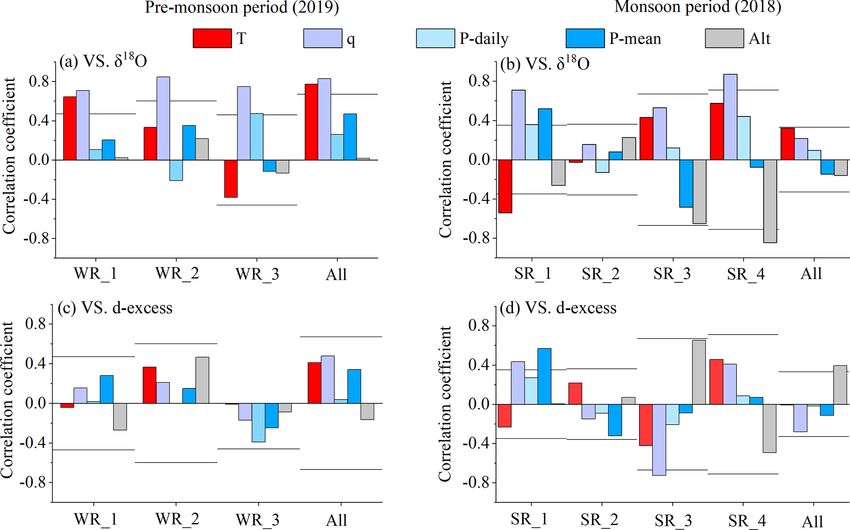
D. Wang et al.: Vehicle-based in situ observations of the water vapor isotopic composition in China                                      3423

Figure 9. Regional patterns of vapor δ 18 O–δ 2 H relation during pre-monsoon period (a) and monsoon (b) period, compared with the East
Asia meteoric water line (EAMWL) (Araguás-Araguás et al., 1998).

Figure 10. Regional patterns of the correlation between δ 18 O (a, b), d-excess, (c, d) and various local factors (temperature (T ), specific
humidity (q), daily precipitation amount (P daily), and average precipitation amount over the entire observation period for each observation
location (P mean), and altitude (Alt)). (a, c) is for the pre-monsoon period and (b, d) is for the monsoon period. Horizontal lines indicate the
correlation threshold for statistical significance (p
3424                    D. Wang et al.: Vehicle-based in situ observations of the water vapor isotopic composition in China

with temperature, Dansgaard, 1964) (Fig. 10a), with signifi-       4.4   Relationship with meteorological variables along
cant and positive correlation between δ 18 O and T (r = 0.77,            trajectories
p
D. Wang et al.: Vehicle-based in situ observations of the water vapor isotopic composition in China                                      3425

Figure 11. Correlation between δ 18 O (a, b), d-excess (c, d), and various meteorological factors (air temperature (T ), specific humidity (q),
precipitation (P ), and mixing depth (MixDep)) along the air mass trajectories during the pre-monsoon period (a, c) and monsoon period
(b, d). The x axis “N” represents the number of days prior to the observations (from 1 to 10 d). For example, when the number of days is
2, the correlations are calculated with the temporal mean of meteorological data along the air mass trajectories during the 2 d before the
observations. Horizontal solid lines indicate the correlation threshold for statistical significance (p
3426                   D. Wang et al.: Vehicle-based in situ observations of the water vapor isotopic composition in China

low d-excess during the night over the continent in Northern      mates the depletion associated with the mesoscale structure.
China during the pre-monsoon could also have contributions        This might contribute to the overestimation of vapor δ 18 O in
(Li et al., 2021). During the monsoon period, the lower vapor     southeastern China (Fig. 12b). In northwestern China, Iso-
d-excess observed in eastern China (Fig. 5d) is likely a sign     GSM underestimates vapor δ 18 O, but also underestimates
of the oceanic moisture, derived from source regions where        precipitation, q, and T (Figs. 12b, d, f, and h and S4). It is
RH at the surface is high (Figs. 2h and S2h), and thus re-        possible that Iso-GSM underestimates the latitudinal extent
duces non-equilibrium fractionation and lower d-excess. The       of the monsoonal influence, which brings moist conditions,
high d-excess values observed in western and northwestern         while overestimating the influence of continental air, bring-
China (Fig. 5d) reflect the influence of continental recycling    ing dry conditions associated with depleted vapor through
(Fig. 3e and g).                                                  Rayleigh distillation. It is also possible that Iso-GSM under-
   The seasonal variation of moisture sources also results        estimates the enriching effect of continental recycling. Dur-
in a seasonal difference in d-excess (Fig. 8b). In southeast-     ing the pre-monsoon period, Iso-GSM overestimates the ob-
ern China, RH over the ocean surface in summer is higher          served δ 18 O along most of the survey route (Fig. 12a), with
than in winter (Figs. S2g and h, and 2g and h), resulting         the largest difference in northwestern China, and underesti-
in negative values of d-excessmonsoon − d-excesspre-monsoon       mates the vapor δ 18 O in the southern part of the study region.
(Fig. 8b). Northwestern China has an opposite pattern of          Our results are consistent with previous studies showing that
seasonal vapor d-excess. This result is largely due to the        many models underestimate the heavy isotope depletion in
extremely low vapor d-excess during the pre-monsoon pe-           pre-monsoon seasons in subtropical and mid-latitudes, espe-
riod (Fig. 5c). Also, we speculate that a greater contribution    cially in very dry regions (Risi et al., 2012). This was inter-
of continental recycling leads to higher d-excess during the      preted as overestimated vertical mixing. The differences in
monsoon period than during the pre-monsoon period (Risi et        δ 18 O (Fig. 12a) and q (Fig. 12c) are spatially consistent. The
al., 2013b) and the positive values of the d-excessmonsoon − d-   overestimation of δ 18 O therefore could be due to the over-
excesspre-monsoon (Fig. 8b).                                      estimation of q and vice versa. These biases could be asso-
                                                                  ciated with shortcomings in the representation of convection
4.6    Possible reasons for the biases in Iso-GSM
                                                                  or in continental recycling. Despite this, the good agreement
                                                                  during the pre-monsoon period is probably due to the dom-
In Sect. 3.3, we showed that Iso-GSM captured the isotopic        inant control by Rayleigh distillation on seasonal mean spa-
variations during the pre-monsoon season better than dur-         tial variations of isotopes in this season, as concluded in the
ing the monsoon season. We hypothesize that this mainly           above. The q variation, in relation with T , drives vapor iso-
could be due to the larger contribution of synoptic-scale vari-   tope variations and is well captured by Iso-GSM spatially,
ations to the observed variations during the monsoon sea-         with significant correlations between observed and simu-
son. Iso-GSM performs well during the pre-monsoon sea-            lated q (r = 0.84, slope = 0.70 in Table S3) and T (r = 0.87,
son, when seasonal mean spatial variability dominates q and       slope = 0.70 in Table S3), though q is overestimated in the
isotope. In contrast, it performs less well during the mon-       North and underestimated in the South.
soon season, when isotopic variations are significantly influ-
enced by the synoptic-scale variability. Among the synoptic       5    Conclusion
influences, tropical cyclones, the BSISO and local processes
probably played a role. For example, during our monsoon           Our new vehicle-based observations document spatial and
observations, the landfall of tropical cyclones Jongdari and      seasonal variability in surface water vapor isotopic compo-
Yagi corresponds to the low values of δ 18 O we observed in       sition across a large part of China. Both during the pre-
eastern China (Fig. S7a). Bebinca corresponds to the low val-     monsoon and monsoon periods, it is clear that different mois-
ues of δ 18 O we observed in southwestern China (Fig. S7a).       ture sources and corresponding processes on transport path-
Typhoons are known to be associated with depleted rain and        ways explain the spatial patterns both in vapor δ 18 O and d-
vapor (Bhattacharya et al., 2022; Gedzelman, 2003). Three         excess (summarized in Fig. 13) as follows:
BSISO events occurred in China during about 28–31 July,
5–8 August, and 14–16 August (Fig. S8). The northward                 1. During the pre-monsoon period (Fig. 13a), the latitu-
propagation of the NSISO is associated with strong convec-               dinal gradient of vapor δ 18 O and d-excess were ob-
tion (Kikuchi, 2021) (Fig. S8). Moreover, short-lived convec-            served. The gradient in δ 18 O reflects the “temperature
tive events frequently occurred during our observation pe-               effect”, and the Rayleigh distillation appears to be the
riod (Wang and Zhang, 2018). It is possible that these rapid             dominant control, roughly consistent with earlier stud-
high-frequency synoptic events are not fully captured by Iso-            ies on precipitation. Vapor in northern China, derived
GSM. We expect that Iso-GSM captures the large-scale cir-                from westerlies, and subject to stronger Rayleigh distil-
culation. Yet, we notice that Iso-GSM underestimates the                 lation (arrows fading from red to blue), is characterized
depletion associated with tropical cyclones (Fig. 12b). We               by very low isotope ratios (blue shades). Less complete
hypothesize that given its coarse resolution, it underesti-              Rayleigh distillation (arrows fading from red to light

Atmos. Chem. Phys., 23, 3409–3433, 2023                                              https://doi.org/10.5194/acp-23-3409-2023
D. Wang et al.: Vehicle-based in situ observations of the water vapor isotopic composition in China 3427
Figure 12. Spatial distribution of the differences between the outputs of Iso-GSM (subscripts are Iso-GSM) and observations (subscripts
are Obser) during the pre-monsoon period (the left panel) and monsoon period (the right panel): δ 18 O (a and b, ‰), specific humidity q (c
and d, g kg−1 ), average precipitation amount over the entire observation period for each observation location P mean e and f, mm d−1 ), and
temperature T (g and h, ◦ C). Note that P mean Obser are interpolated from the GPCP dataset.
red) results in less depleted vapor in southern China ducing the kinetic fractionation during ocean evapora-
(light red shades). The vapor d-excess in northern China tion. In contrast, the lower RH over low-latitude mois-
is low (green triangles series), probably due to the high ture sources (yellow arrow) for the vapor transported to
RH over high-latitude oceanic moisture sources for the southern China leads to higher d-excess (yellow trian-
vapor transported by the westerlies (green arrow), re- gles series). Additional vapor sourced from continen-
https://doi.org/10.5194/acp-23-3409-2023 Atmos. Chem. Phys., 23, 3409–3433, 20233428 D. Wang et al.: Vehicle-based in situ observations of the water vapor isotopic composition in China
Figure 13. Schematic picture summarizing the different processes controlling the observed spatial patterns and seasonality of vapor isotopes.
Color gradient arrows from red to blue represent the initial to subsequent extension of the Rayleigh distillation process along the water vapor
trajectory, corresponding to high to low values of δ 18 O. The green arrows represent high relative humidity, the yellow arrows represent low
relative humidity, the orange twisted arrows represent continental recycling, blue clouds represent strong and weak convective processes,
green triangle series represents low values of d-excess; and the yellow triangle series represents high values of d-excess.
tal recycling (twisted orange arrows) further increases and northwestern China. We observed lower vapor δ 18 O
the d-excess values in middle China. This distribution is values when the moisture originates from the BoB than
consistent with the back-trajectory results showing that from the Pacific Ocean, consistent with stronger con-
during the pre-monsoon period, the vapor in southwest- vection during transport. The dominance of oceanic wet
ern China comes from the BoB, whereas westerly mois- moisture (green arrows) results in the lower vapor d-
ture sources still persist in northern China. excess (green triangle series) in eastern China, whereas
continental recycling produces higher vapor d-excess
in western and northwestern China (yellow triangle se-
2. During the monsoon period (Fig. 13b), the lowest va-
ries).
por δ 18 O occurred in southwestern and northeastern
China, and higher vapor δ 18 O values were observed in
between, while the d-excess features a West–East con- 3. Variation in temperature drives the seasonal variations
trast. The relatively lower vapor δ 18 O results from deep of vapor δ 18 O in northern China, whereas convective ac-
convection along the moisture transport pathway (blue tivity along trajectories produces low vapor δ 18 O during
clouds, arrows fading to blue). Meanwhile, the mixing the monsoon season and drives the seasonal variation in
with moisture from continental recycling (twisted or- South China. Seasonal d-excess variation reflects differ-
ange arrows) increases the vapor δ 18 O values in middle ent conditions in the sources of vapor: in southeastern
Atmos. Chem. Phys., 23, 3409–3433, 2023 https://doi.org/10.5194/acp-23-3409-2023You can also read