Truncation of stream residence time: how the use of stable isotopes has skewed our concept of streamwater age and origin
←
→
Page content transcription
If your browser does not render page correctly, please read the page content below
HYDROLOGICAL PROCESSES
Hydrol. Process. 24, 1646– 1659 (2010)
Published online 26 January 2010 in Wiley InterScience
(www.interscience.wiley.com) DOI: 10.1002/hyp.7576
Truncation of stream residence time: how the use of stable
isotopes has skewed our concept of streamwater age
and origin
Michael K. Stewart,1 * Uwe Morgenstern2 and Jeffrey J. McDonnell3
1 Aquifer Dynamics and GNS Science, PO Box 30 368, Lower Hutt 5040, New Zealand
2 GNS Science, PO Box 30 368, Lower Hutt 5040, New Zealand
3 Institute for Water and Watersheds, Department of Forest Engineering, Resources and Management, Oregon State University, Corvallis, OR, USA
Abstract:
Although early studies of streamwater residence time included the use of stable isotopes (deuterium, oxygen-18) and tritium,
work in the last decades has largely relied on stable isotopes (or chloride) alone for residence time determination, and derived
scaling relations at the headwater and mesoscale watershed scale. Here, we review critically this trend and point out a significant
issue in our field: truncation of stream residence time distributions because of only using stable isotopes. When tritium is
used, the age distributions generally have long tails showing that groundwater contributes strongly to many streams, and
consequently that the streams access considerably larger volumes of water in their catchments than would be expected from
stable isotope data use alone. This shows contaminants can have long retention times in catchments, and has implications
for process conceptualization and scale issues of streamflow generation. We review current and past studies of tritium use in
watersheds and show how groundwater contributions reflect bedrock geology (using New Zealand as an example). We then
discuss implications for watershed hydrology and offer a possible roadmap for future work that includes tritium in a dual
isotope framework. Copyright 2010 John Wiley & Sons, Ltd.
KEY WORDS streamflow; residence time; groundwater; tritium; oxygen-18; chloride
Received 31 August 2009; Accepted 6 November 2009
INTRODUCTION But what if the information gleaned from stable iso-
topes has actually biased our understanding of how catch-
The field of watershed hydrology concerns itself with ments store and transmit water? What if our now, almost
questions of where water goes when it rains, what flow- exclusive use of stable isotopes has led us down a path
paths the water takes to the stream and how long water that has skewed our view of streamwater residence time?
resides in the watershed. Although basic and water- Here, we show that deeper groundwater contributes more
focused, these questions often form the underpinning to streamflow than we are able to ascertain using con-
for questions of plant water availability, biogeochemical ventional stable isotope-based hydrograph separation and
cycling, microbial production and other water-mediated streamflow residence time approaches. We examine crit-
ecological processes (Kendall and McDonnell, 1998). ically our reliance on 18 O-based estimates of residence
The use of stable isotope tracers (2 H and 18 O) [and in time and explore the implications for the recent relation-
some cases chloride (Cl)] more than any other tools ships discovered between residence time and topography
has influenced the development of the field since their (McGuire et al., 2005), soil drainage class (Tetzlaff et al.,
first use in the 1970s (Dinçer et al., 1970). Sklash 2009) and soil depth and climate (Sayama and McDon-
and Farvolden (1979) were among the first hydrolo- nell, 2009).
gists to quantify the composition of stream water and In many ways, this is hydrology back to the future.
its temporal and geographical sources in small water- Some of the earliest benchmark work in watershed
sheds. Since then, watershed-scale stable isotope hydrol- residence time analysis used both stable isotope and
ogy has blossomed (McGuire and McDonnell, 2006), tritium (3 H) analysis of streamwater (Maloszewski and
and today, stable isotope-derived interpretations inform Zuber, 1982; Maloszewski et al., 1983) and showed quite
watershed rainfall-runoff concepts (Weiler and McDon- clearly how faster and slower components of watershed
nell, 2004), development (Uhlenbrook et al., 2002b) and residence time could be deduced by the separate residence
testing (Vache and McDonnell, 2006). time estimates of the different tracers. Since then, the use
of 3 H has become more problematic, particularly in the
Northern Hemisphere, because the year-by-year decrease
in 3 H concentrations in precipitation has mimicked the
* Correspondence to: Michael K. Stewart, Aquifer Dynamics and GNS
Science, PO Box 30 368, Lower Hutt 5040, New Zealand. radioactive decay of 3 H, i.e. the 3 H concentration in
E-mail: m.stewart@gns.cri.nz precipitation several decades after the bomb peak of the
Copyright 2010 John Wiley & Sons, Ltd.TRUNCATION OF STREAM RESIDENCE TIME 1647
1960s has been falling at the same rate as 3 H decays by parameter models (Maloszewski and Zuber, 1982). Such
radioactivity. As a result, different transit time waters models integrate transport of tracer through the whole
can have the same 3 H concentrations, because their catchment or system under study. The varied flowpaths
reduced initial concentrations in time compensate for the that water can take through a catchment mean that
radioactive decay in waters already in the catchment. The outflows (i.e. streams) contain water with different transit
result is ambiguous ages, which can often be resolved by times (i.e. the water in a sample of the stream does not
using gas tracers (3 H/3 He, CFCs, SF6 , 85 Kr), although have a discrete age, but has a distribution of ages). This
for streams their use can be limited by exchange with the distribution is simulated by a steady-state flow model,
atmosphere (Busenberg and Plummer, 1992; Bohlke and which is intended to reflect the average conditions in the
Denver, 1995; Solomon and Cook, 2000). In recent years, catchment.
the prospects for using natural precipitation 3 H for transit Both 18 O and 3 H are used to estimate transit times
time determination have actually improved because the in catchments by transforming the input series of con-
bomb peak influence is largely gone and concentrations in centrations (in the recharge) to match the output series
precipitation have stopped falling from their 1960s peak of concentrations (in the stream), with an assumed tran-
(with precipitation 3 H levelling out in the last 5 years in sit time distribution. The variations of 18 O are altered
the Northern Hemisphere and for the last 15 years in the (and usually damped) by mixing of precipitation from
Southern Hemisphere). the succession of storms with different tracer signatures.
Here, we make the case for increased use of 3 H for This damping allows the transit time distribution to be
estimation of residence time in watersheds, in order to extracted from the time series by convolution using a
reveal the real age and origin of streamwater, and in par- lumped parameter model. 3 H while passive, differs from
18
ticular the important role of deep groundwater. While O by being radioactive and its decay is the basis for dat-
perhaps not a new message, these ideas are consis- ing. Rainfall incident on a catchment can be affected by
tent with the growing recent literature on the role of immediate surface or near surface runoff and longer-term
deep groundwater in contributing to streamflow based evapotranspiration loss. The remainder becomes recharge
on groundwater–streamflow hydrometrics (Kosugi et al., to the subsurface water stores. Tracer input to the sub-
2008) and physics-based model analysis (Ebel et al., surface water stores is modified by passing through the
2008). Our main message is that there is a continuum of hydrological system (as represented by the flow model)
surface and subsurface processes by which a hillslope or before appearing in the output. The convolution integral
watershed responds to a storm rainfall (Beven, 1989), and and an appropriate flow model are used to relate the tracer
that a focus on these processes with stable isotopes alone input and output. The convolution integral is given by
truncates our view of the transit time, effectively remov- 1
ing the long tails in the transit time distribution. Many Cout t D Cin t h expd 1
0
more estimates of stream transit times have been made
using 18 O (or chloride) variations because the measure- where Cin and Cout are the concentrations in the recharge
ments and age interpretation process are more straight- and stream, respectively. t is calendar time and the
forward (McGuire and McDonnell, 2006). This paper integration is carried out over the transit times . h is
counters this growing trend by showing how 3 H-based the flow model or response function of the hydrological
analyses differ from 18 O-based analyses when the two system. The exponential term accounts for radioactive
are performed together, and providing a review of 3 H- decay of 3 H f is the 3 H decay constant [D ln 2/T1/2 ,
based studies to recall their findings and significance. where T1/2 is the half-life of 3 H (12Ð32 years)]g.
We then show how groundwater contributions to stream- Simulation via the convolution integral causes a
flow (revealed via 3 H) relate to bedrock geology patterns decrease in the range of variation of 18 O in streamflow
(using New Zealand as an example). We summarize the in comparison with the range in rainfall. It can be shown
work in the context of: implications for watershed hydrol- that the maximum mean residence time that can be deter-
ogy, how tritium can be utilized as an essential tool along- mined using 18 O is about 4 years with the exponential
side stable isotopes in watershed studies, and a future, flow model (EM), longer if a more peaked model is
useful direction for the field. used (e.g. deWalle et al., 1997; McGuire and McDonnell,
2006). Depending on the variation, which usually follows
a seasonal pattern, the maximum could be smaller. Thus,
18 water resident in the catchment for longer than about
O MEAN TRANSIT TIMES CAN BE DIFFERENT
FROM 3 H MEAN TRANSIT TIMES 4 years is not expected to show detectible variation in
18
O (i.e. variation greater than the measurement error)
Why are they different? and therefore is effectively invisible to the method.
Residence time is the time spent in the catchment since On the other hand, 3 H decay with half-life 12Ð32 years
arriving as rainfall. Transit time is the time taken to pass allows for age dating covering several half-lives, and
through the catchment and into the stream. The transit therefore much longer mean transit times (MTTs) can
time distribution of a catchment is difficult to measure be determined. The maximum age that can be determined
directly, and is usually estimated from time series of depends on the 3 H level in precipitation, the measurement
tracers in precipitation and streamflow, using lumped precision of the tritium laboratory at the background level
Copyright 2010 John Wiley & Sons, Ltd. Hydrol. Process. 24, 1646– 1659 (2010)1648 M. K. STEWART, U. MORGENSTERN AND J. J. MCDONNELL
and the flow model applied. The 3 H level in precipita- dispersion due to flow within the ground. The model
tion differs between the Northern and Southern Hemi- gives a wide range of transit time distributions, which
spheres (see discussion below), and different laboratories have realistic-looking shapes (no sharp edges like the
have different measurement precisions. MTTs of up to EPM transit time distributions).
200 years can often be determined with the EM. Combinations of these models can be used to simulate
more complicated transit time distributions, for example,
How can their differences be quantified? where there are several distinct flow components con-
tributing to the streamflow. Michel (1992) and Taylor
So how do we quantify the residence time of these
et al. (1992) applied two EM models in parallel to iden-
different components? Two flow models are commonly
tify fast and slow components of flow to rivers. Their
used in environmental tracer studies (Maloszewski and
combined models have three parameters, the MTTs of the
Zuber, 1982). The exponential-piston flow model (EPM)
two EMs and the fraction of the rapid component. Like-
combines a volume with exponentially distributed transit
wise, Stewart and Thomas (2008) used two DM models in
times followed by a piston flow volume to give a model
parallel to identify two groundwater components feeding
with two parameters. The response function is given by
the Waikoropupu Springs in New Zealand. Identification
h D 0 for < m 1 f 2 of distinct flow components and their average propor-
tions generally requires streamflow and/or geochemical
1 records for the streams.
h D fm . exp
fm
1 Examples that show their difference
C 1 for ½ m 1 f 3
f Four key studies from the literature using both 18 O
where m is the mean residence time, and f the ratio and 3 H are highlighted here to contrast the two methods,
of the exponential volume to the total volume. Mal- and illustrate how 18 O produces a truncated version of
oszewski and Zuber (1982) used the parameter , f D the transit time distribution. Results of the studies are
1/. m 1 f is the time required for water to flow summarized in Table I. In the first example, Maloszewski
through the piston flow section. [In abbreviated form, et al. (1983) used 2 H and 3 H to study runoff in the
EPM (f D 0Ð9) signifies an EPM with f D 90%. The Lainbach Valley (670–1800 m a.s.l, 80% forested) in
EM is EPM (f D 1Ð0).] the Bavarian Alps. Geological substrates are Pleistocene
The EM (introduced by Eriksson, 1958) is often glacial deposits, Triassic calcareous rocks and Cretaceous
misleadingly referred to in this context as the one- sandstones and marlites. They examined transit times for
box or well-mixed model, which is analytically the three runoff conceptualizations assuming contributions
same. However, Eriksson clearly envisaged flowlines from different flow components in each (illustrated in
with different transit times combining in the outflow to Figure 1a). In the first, the whole system was treated as a
give the exponential transit time distribution rather than black box where only the input and output concentrations
instantaneous mixing within the ground. The combination were known. The MTTs found using 2 H and 3 H were
of the EM and PFM (in the EPM) gives a wide 1Ð1 and 1Ð8 years, respectively. In the second, 70% of
range of possible transit time distributions. The EM and the flow went through a subsurface reservoir while the
EPM are especially suitable for interpreting transit time remainder was direct runoff with very short residence
distributions of streamflow, because the stream integrates time. The subsurface water was found to have MTTs
the total flow out of the catchment [i.e. combines water of 2Ð1 years (2 H) and 2Ð3 years (3 H). In the third, the
originating from near (streamside) to far (catchment subsurface ‘box’ was split into an upper reservoir with
boundary)]. short turnover time (taking 52Ð5% of the total flow), and
The dispersion model (DM) is based on a solution a lower reservoir with longer turnover time (17Ð5% of
to the dispersion equation which describes the flow in the flow) based on the streamflow record. The MTTs
porous media (the CFF case from Maloszewski and Zuber, for the reservoirs were found to be 0Ð8 and 7Ð5 years
1982). The equation is using 3 H. The transit time distribution of the subsurface
system is illustrated in Figure 1b. With 2 H, only the
1 1 /m 2 short transit time could be estimated (0Ð6 year) when
h D exp 4 allowance for the old component with no 2 H variation
4DP/m 4DP/m
was made.
where the parameters are m and DP (the dispersion The second study was by Uhlenbrook et al. (2002a),
parameter, defined as the mass of the variance of the who applied 3 H with other measurements in the Brugga
dispersive distribution of the transit time). Although Basin in Germany. In a detailed study, they used several
apparently less suitable conceptually for application to tracers (18 O, 3 H, silica) and the flow record to show
transit time determination of streamflow, the DM has that runoff sources or main flowpaths could be separated
proven to be useful in practice. The DP effectively into three components: short-term runoff (comprising
describes dispersion resulting from the extended recharge 11Ð1% of annual runoff, with MTT of days or weeks),
zone (catchment area), which is much greater than shallow groundwater (69Ð4% and MTT 2Ð3–3 years)
Copyright 2010 John Wiley & Sons, Ltd. Hydrol. Process. 24, 1646– 1659 (2010)TRUNCATION OF STREAM RESIDENCE TIME 1649
Table I. Summary of the four key examples of the difference between 18 O- and 3 H-based mean transit times (MTTs). The flow
components and their MTTs were identified from hydrometric, isotopic and chemical measurements by each author. The blackbox
MTTs are those given by 18 O or 3 H simulations assuming different blackbox models of the streams fitted to the data or by calculation
assuming 18 O MTTs 4 years
Catchment Flow components Blackbox MTTs (year)
18
Type MTT (year) % O/2 H 3
H
Lainbach Valleyb Surface runoff ¾0Ð01 30 All flow 1Ð8 (1Ð7a )
1Ð1 (1Ð1a )
Upper reservoir 0Ð8 52Ð5 Subsurface flow 2Ð3 (2Ð5a )
Lower reservoir 7Ð5 17Ð5 2Ð1 (1Ð6a )
Brugga Basinc Event water ¾0Ð01 11Ð1 All flow 3Ð3a
2 Ð 6a
Shallow groundwater 2Ð3–3 69Ð4 Subsurface flow 3Ð7a
Deep groundwater 6–9 19Ð5 2Ð9a
Pukemanga Catchmentd Direct runoff ¾0Ð1 15 All flow 9Ð0a
3Ð4a
Groundwater 10Ð6 85 Subsurface flow 10Ð6
4
Waikoropupu Springe Shallow groundwater 1Ð2 26 Subsurface flow 7Ð9 (7Ð9a )
Deep groundwater 10Ð2 74 2Ð6–3Ð9 (3Ð3a )
a Calculated by combining the flow components in the indicated proportions.
b Maloszewski et al. (1983).
c Uhlenbrook et al. (2002a)
d Stewart et al. (2007)
e Stewart and Thomas (2008).
and deep groundwater (19Ð5% and MTT 6–9 years). (a)
Shallow groundwater resides in upper drift and debris Model 1
Catchment
cover, and deep groundwater in deeper drift, weathering tm = 1.1 year (2H),
Recharge Stream
zone and hard rock (gneiss) aquifers. In the third study, 1.7 year (3H)
Stewart et al. (2007) reported on the small (3Ð8 ha), steep
Pukemanga Catchment on highly weathered greywacke in Model 2
30% Direct runoff (tm = 1 mth)
New Zealand. The perennial stream flows from a small
Subsurface
wetland at the bottom of a gully. Baseflow comprises 70% Reservoir
Recharge Stream
85% of the annual flow and shows no significant 18 O tm = 2.1 year (2H),
variation, indicating that it has a minimum MTT of 2.3 year (3H)
4 years. The 3 H results show an MTT of 10Ð6 years (from
Stewart et al., 2007 and a later result). Model 3 30% Direct runoff (tm = 1 mth)
The fourth example was by Stewart and Thomas
(2008), who used 18 O and3 H to study the flow to the 52.5% Shallow gw
Recharge tm = 0.6 year (2H), Stream
Waikoropupu Spring, the source of the Waikoropupu 0.8 year (3H)
River, in NW Nelson, New Zealand. Analysing the whole
17.5%
system as a black box gave MTTs of 7Ð9 years with Deep gw
3
H, and 2Ð6–3Ð9 years with 18 O (Figure 2a). However, tm = 7.5 year (3H)
hydrometric, Cl and 18 O measurements showed that there
were two groundwater systems or components feeding (b) 1.0 3H
the springs and established their proportions. The 3 H 2
H
0.8
results allowed these to be characterized as shallow (26%
Distribution
Shallow gw (0.8 year)
of the flow with MTT 1Ð2 years) and deep (74%, and 0.6
10Ð2 years) components. The flow components and transit Deep gw (7.5 year)
time distribution are illustrated in Figure 2a and b. When 0.4 Sum
allowance is made for the 10Ð2 years component (which
0.2
would have had no significant 18 O variation), the 18 O
data identified a 1Ð0-year component (i.e. the shallow 0.0
groundwater). In this case, the presence of the dominant 0 1 2 3 4 5 6 7 8 9 10
deep groundwater component was evident from the 3 H, Time (years)
but not from the 18 O.
Table I gives a summary of the four cases. The flow Figure 1. (a) Conceptual flow models, and (b) distribution of transit times
for model 3 (excluding direct runoff), for Lainbach Valley (Maloszewski
components supplying each stream and their MTTs based et al., 1983)
Copyright 2010 John Wiley & Sons, Ltd. Hydrol. Process. 24, 1646– 1659 (2010)1650 M. K. STEWART, U. MORGENSTERN AND J. J. MCDONNELL
(a) Headwater catchments
Model 1
Catchment
Baseflow proportions and ages in smaller catchments
Recharge tm = 3.3 year (18O) Stream
are expected to reflect more faithfully their widely
7.9 year (3H) varying geography and lithology (Tague and Grant,
2004). Dinçer et al. (1970) used 18 O and3 H to study
Model 2 runoff in the alpine Modry Dul basin in the present
26% Shallow gw
Recharge tm = 1.0 year (18O), Stream Czech Republic (altitude range 1000–1554 m a.s.l.).
1.2 year (3H) They showed that two-thirds of the snowmelt infiltrated
the soil, and had an MTT of 2Ð5 years. Storage of water
74% Deep gw was attributed to subsurface reservoirs in relatively large
tm = 10.2 year (3H) amounts of unconsolidated glacial deposits (up to 50 m
thick) on a crystalline basement. Maloszewski and Zuber
(b) 0.25 (1982) later revised the estimate of MTT to 3Ð6–5Ð5 years
3H
18O based on more detailed lumped parameter modelling of
0.20 the 3 H concentrations.
Shallow gw (1.2 year) Martinec et al. (1974) used 3 H to show that most
Distribution
0.15
Deep gw (10.2 year) of the runoff (64%) from the high alpine Dischma
0.10 basin in Switzerland (1668–3146 m a.s.l.) had MTT
Sum
4Ð5–4Ð8 years. 18 O showed a very subdued variation
0.05 in the runoff in comparison with the precipitation; no
estimate of MTT from the 18 O data was given. The
0.00 catchment contains unconsolidated glacial and avalanche
0 1 2 3 4 5 6 7 8 9 10
deposits, as described above. Behrens et al. (1979)
Time (years)
reported isotope studies on the Rofenache Catchment in
Figure 2. (a) Conceptual flow models, and (b) distribution of transit times the Austrian Alps (1905–3772 m a.s.l.). The 3 H measure-
for model 2, for Waikoropupu Stream (Stewart and Thomas, 2008)
ments in winter runoff showed a 4-year MTT, which was
attributed to storage in groundwater aquifers in morainal
on 3 H are listed in Table I, as determined by each material.
author from hydrometric and geochemical measurements. Zuber et al. (1986) determined a 2Ð2-year MTT for
The blackbox values on the right side of the table are 89% of the total flow in the Lange Bramke catch-
those derived by assuming different blackbox models of ment in Germany (543–700 m a.s.l., 90% forested). The
the flow systems, as described above and illustrated in authors obtained the same result with both variable flow
Figures 1 and 2. The calculated blackbox values (starred) and steady-state models, concluding that ‘the latter is
were obtained by combining the flow components in applicable even for systems with highly variable flow,
the indicated proportions, recognizing that 18 O cannot if the variable part of the system is a small fraction
give ages greater than 4 years. Although there is a of the total water volume’. The subsurface reservoir
component of older (7Ð5 years) water present at both consists of the unsaturated zone (residual weathering
Lainbach Valley and Brugga Basin, it is not very apparent and allochthonic Pleistocene solifluidal materials), and
from the blackbox values except that the 3 H values saturated zone (fractured Lower Devonian sandstones,
are consistently older than the 18 O values. The old quartzites and slates, and gravels, pebbles and boulders in
water components are more apparent from the marked the valley bottom). Maloszewski et al. (1992) used 18 O
differences between the 18 O and 3 H blackbox values and 3 H to determine the MTT of runoff (4Ð2 years) in
at Pukemanga Catchment and Waikoropupu Spring. It the Wimbachtal Valley in Germany (636–2713 m a.s.l.).
is usually necessary to understand the flow components Direct runoff was considered negligible (Table II. Summary of published field studies for headwater catchments using 3 H
Reference Region Catchment Bedrock Area Mean transit time Fraction of total runoff
(km2 )
3
Model H (year) (%) Description
Copyright 2010 John Wiley & Sons, Ltd.
Dincer et al. (1970) Czech Republic Modry Dul Gneiss/granite 2Ð65 BN 2Ð5 67 Subsurface flow
Martinec et al. (1974) Switzerland Dischma 43Ð3 EM, DM 4, 4Ð8 64 Subsurface flow
Behrens et al. (1979) Austria Rofenache 96Ð2 EM 4 Baseflow
Maloszewski and Zuber (1982) Czech Republic Modry Dul Gneiss/granite 2Ð65 DM 5Ð5–3Ð6 67 Baseflow
Maloszewski et al. (1983) Germany Lainbach Pleistocene glacial 18Ð7 DM 7Ð5 17Ð5 Deep reservoir
Zuber et al. (1986) Germany Lange Bramke 0Ð76 EM 2Ð2 89 Baseflow
Maloszewski et al. (1992) Berchtesgaden Alps Wimbachtal Limestone/dolomite 33Ð4 EM/DM 4Ð2 >95 Groundwater
Matsutani et al. (1993) Central Japan Kawakami Tertiary volcanics 0Ð14 BN 19 33 Groundwater
Rose (1993) Piedmont Province, GA Three streams Gneiss 6Ð5–347 ND 15–35 67 Baseflow
Bohlke and Denver (1995) Coastal plain, MD Chesterville Br Sediments 32Ð9 ¾20 59 Baseflow
Rose (1996) Piedmont Province Falling Creek Gneiss 187 ND 10–20 67 Baseflow
Herrmann et al. (1999) Vallcebre, Spain 14 streams Paleocene 0Ð6–4Ð2 EM 8–13Ð5 Low flows
Taylor (2001) NW Nelson, NZ Upper Takaka Paleozoic schist EM 0Ð2 80 Runoff less peaks
Uhlenbrook et al. (2002a) SW Germany Brugga Gneiss 40 DM 6–9 19Ð5 Groundwater
Stewart et al. (2002) N. Auckland, NZ Mahurangi Tertiary EM 2 60 Baseflow
McGlynn et al. (2003) Maimai, NZ Four streams Tertiary glacial sediment 0Ð03–2Ð8 EM 1Ð1–2Ð1 60 Baseflow
Morgenstern et al. (2005) Rotorua, NZ Six streams Welded ash flows EPM 30–145 100 Spring-fed streams
TRUNCATION OF STREAM RESIDENCE TIME
Stewart et al. (2005a) NW Nelson, NZ Upper Motueka River Tertiary EM 0Ð3 40 Baseflow
Stewart et al. (2005b) Glendhu, NZ GH5 Schist 0Ð036 DM 16 60 Groundwater
Morgenstern (2007) Taupo, NZ Eight streams Unwelded ash flow EPM 40–84 90 Baseflow
Stewart et al. (2007) Waikato, NZ Pukemanga Greywacke 0Ð038 EM 10Ð6 85 Baseflow
Stewart and Thomas (2008) NW Nelson, NZ Waikoropupu Marble 450 DM 10Ð2 74 Groundwater
22 papers 22 catchments Averages 15 š 22 years 60 š 22%
See original references for details.
Hydrol. Process. 24, 1646– 1659 (2010)
16511652
Table III. Summary of published field studies for macroscale catchments using 3 H
Reference River (sample point) Bedrock Area (km2 ) Mean transit time Fraction of total runoff
Copyright 2010 John Wiley & Sons, Ltd.
3
Model H (year) (%) Description
Begemann and Libby (1957) Upper Mississippi River (Rock Island, IL) Mass balance 15 Baseflow
Eriksson (1958) Upper Mississippi River (Rock Island, IL) EM 8 ¾90 Baseflow
Taylor et al. (1989) Waimakariri River (Halkett, NZ) Greywacke 2 600 EM >3 90 Runoff less floods
Taylor et al. (1992) Wairau River (Renwick, NZ) Greywacke 2 600 EM 8 40 Baseflow
Michel (1992) Colorado River (Cisco, UT) 75 000 EM 14 60 Groundwater
Michel (1992) Mississippi River (Anoka, MA) 53 000 EM 10 36 (The remainder in all
cases is runoff
resident for less
than 1 year in the
catchment)
Michel (1992) Neuse River (Vanceboro, NC) 11 000 EM 11 27
Michel (1992) Potomac River (Point of Rocks, MD) 27 000 EM 20 54
Michel (1992) Sacramento River (Sacramento, CA) 67 000 EM 10 65
Michel (1992) Susquehanna River (Harrisburg, PA) 70 000 EM 10 20
Michel (1992) Kissimmee River (L. Okeechobee, FL) 4 500 EM 2Ð5 6
Yertsever (1999) River Danube (Vienna) 101 700 EM 11Ð7 36 Subsurface runoff
Michel (2004) Ohio River (Markland Dam, KY) 215 400 EM 10 60 Baseflow
Michel (2004) Missouri River (Nebraska City, NE) 1 073 300 EM 4 90 Baseflow
Koeniger et al. (2005) Weser-1 River (Karlshafen, Germany) Consolidated rock 15 320 EM 13 55 Groundwater
M. K. STEWART, U. MORGENSTERN AND J. J. MCDONNELL
Eight papers 14 catchments Averages 10 š 5 years 52 š 26%
See original references for details.
Hydrol. Process. 24, 1646– 1659 (2010)TRUNCATION OF STREAM RESIDENCE TIME 1653
MTTs of 15–35 years, and observed that the baseflow in the middle reach. The river dominates the interac-
MTT varied during the year, being older (with higher 3 H) tion with groundwater in the Holocene gravels. Stewart
during lower flow periods in summer. 3 H was also used et al. (2005b) reported on 3 H measurements at Glendhu
to show an MTT of 10–20 years for baseflow in another Catchment (schist bedrock). At GH5 (a perennial stream
large Piedmont catchment (187 km2 ) (Rose, 1996). flowing out of a wetland), the MTT of baseflow (60% of
Bohlke and Denver (1995) used 3 H (together with the flow) was 16 years.
CFCs) to date water in two small agricultural watersheds Table II shows that the MTTs of these catchments vary
on Tertiary sediment on the Atlantic Coastal Plain, MD, greatly, but the results (and average) show that many
USA. The study on the history and fate of nitrate in the streams discharge large proportions of old water.
watersheds revealed baseflow comprising 59% of annual
flow had MTT 20 years. Herrmann et al. (1999) applied Macroscale catchments
3
H to determine MTTs for streams (8Ð5–13Ð0 years), The first application of 3 H dating to a river catch-
springs (10Ð5–13Ð5 years) and wells (8Ð0–11Ð5 years) ment was by Begemann and Libby (1957). They used
during summer low-flows in the Vallcebre basins in the 3 H released by the Castle test in 1954 (along with
the Pyrenees of Spain. The substrate comprised four the assumption of instantaneous mixing of 3 H deliv-
Paleocene units (limestone, clay, silt and limestone from ered by rainfall into the groundwater aquifer, i.e. a one-
bottom to top). Altitude range was 960–2245 m a.s.l. box model) to estimate an MTT of 15 years for water
3
H measurements in subcatchments in the Mahurangi through the Upper Mississippi catchment. This estimate
Catchment (New Zealand) suggested short MTTs (about was refined by Eriksson (1958) to 8 years, by using a
2 years), but data are limited and not fully evaluated smaller value for the 3 H fallout. Eriksson established
yet (Stewart et al., 2002). The catchments are underlain some important points in his treatment: (1) Recharge and
by Tertiary sediment. McGlynn et al. (2003) reported 3
H input to the aquifer is from precipitation minus evap-
3
H measurements for four nested Maimai catchments otranspiration, (2) while instantaneous mixing does not
(New Zealand). The estimated ages ranged from 1 to occur in groundwater (or soil water), the assumption of
2 years and correlated with median subcatchment areas instantaneous mixing can appear to be correct when water
of the sampled catchments rather than with their overall following different flowpaths through the catchment com-
areas. Previous 18 O measurements at a nearby small bines in the outflow (stream), thus approximating the EM,
catchment had given an age of 4 months (Stewart and (3) different flow models can give similar results when
McDonnell, 1991). The substrate is Tertiary sediment (a MTTs are short compared with the half-life of 3 H (Eriks-
firmly compacted conglomerate known as the Old Man son suggested up to 0Ð6 ð T1/2 or 7 years).
Gravel). Taylor et al. (1989, 1992) reported 3 H measure-
Estimated ages for six streams flowing into Lake ments for two large greywacke catchments in New
Rotorua were given by Morgenstern et al. (2005) based Zealand (both with catchment areas of 2600 km2 ). The
on 3 H. Earlier results were given by Taylor and Stewart Waimakariri River results (which omitted peak flows)
(1987). The spring-fed streams drain Mamaku Ignimbrite were fitted with a single exponential component with
(a welded volcanic ash-flow deposit with no surface water MTT of 3 years (90% of flow). The Wairau River data
flows) on the west side of the lake. MTTs ranged from were fitted with two EM components, the older of which
30 to 145 years, showing that the very porous ignimbrite had an MTT of 8 years and comprised 40% of the
constitutes a very large reservoir. The largest and oldest annual streamflow. The younger component was essen-
stream (Hamurana Spring, mean flow 3Ð5 m3 /s) has mean tially direct runoff (MTT 0Ð2 year and 60% of the flow).
age 145 years indicating water storage of 5 km3 , far Michel (1992) reported monthly 3 H measurements
greater than Lake Rotorua itself. Morgenstern (2007) on six large US rivers, with catchment areas ranging
gave 3 H data for eight streams draining into Lake Taupo from 11 000 to 75 000 km2 . His model to simulate the
from unwelded volcanic ash-fall deposits north of the 3
H concentrations had two components, ‘quick’ runoff
lake. The deposits have remarkable porosity. Estimated with transit times less than 1 year, and ‘slow’ runoff
MTTs for baseflow ranged from 40 to 84 years and (groundwater). The slow runoff had MTTs ranging from
baseflow comprises 90% of the annual flow. A more 10 to 20 years, and supplied 20–65% of the annual
detailed study at Tutaeuaua Stream (also in the North flows in the six catchments. A smaller karstic catchment
Taupo region feeding Lake Taupo) revealed a baseflow (Kissimmee River, Florida) had a younger (2Ð5 years) and
MTT of 45 years (Stewart et al., unpublished). smaller (6%) groundwater component.
The Upper Takaka River discharges very young water In a further study, Michel (2004) reported on 3 H in
on average—the MTT from 3 H was 2 months (Taylor, rivers at four locations within the Mississippi River basin.
2001). The bedrock is Paleozoic schist with very low The two-component mixing model was applied to the
porosity. 3 H measurements show that the Upper Motueka Ohio and Missouri Rivers; the components were quick
River has an MTT of about 4 months (Stewart et al., runoff (MTT less than 1 year) and water from groundwa-
2005a). The catchment geology is varied with strongly ter reservoirs, as described above. The modelling yielded
indurated ultramafics and sediments of Permian age in groundwater components with MTT 10 years comprising
the headwater, and Tertiary sediment (Moutere Gravel) 60% of the flow at Ohio River and MTT 4 years com-
with a shallow overlay of permeable Holocene gravels prising 90% of the flow at Missouri River. Using these
Copyright 2010 John Wiley & Sons, Ltd. Hydrol. Process. 24, 1646– 1659 (2010)1654 M. K. STEWART, U. MORGENSTERN AND J. J. MCDONNELL
results, Michel demonstrated that the rivers will require (a)
20–25 years to fully respond to a change in the input of Model 1
Catchment
a conservative pollutant. tm = 2.3 year (18O)
Recharge Stream
Monthly data since 1968 for the River Danube at 5.3 year (3H)
Vienna (catchment area 101 700 km2 ) was analysed by
Yertsever (1999). He applied a two-component compart- Model 2
mental (mixing cell) model, and derived a surface flow 50% Quick runoff
Recharge Stream
component with MTT of 0Ð83 year (64% of annual flow) tm = 0.5 year (3H)
and a subsurface component with MTT 11Ð7 years (36%
of flow). An ANN model had previously yielded an MTT 50% Slow runoff
of 4Ð8 years for the total flow, in good agreement with tm = 10 year (3H)
the compartmental model.
Koeniger et al. (2005) applied 50 years of 3 H data
(b) 0.10
to estimate the MTTs of three large subcatchments Model 2 age spectrum
in the Weser River catchment. The largest (Weser- 0.08
1, 15 320 km2 ) is representative of the three. Direct
Transit time
distribution
0.06 Quick runoff
runoff (supplying 45% of the flow on average) and
two groundwater components (‘quick’ and ‘slow’, each 0.04
with mobile and immobile fractions) were used for
modelling. Quick groundwater (26% of flow and thought 0.02
Slow runoff
to result from flow in fissured rock) had MTTs 5–7 years 0.00
(mobile fraction 5 years, immobile fraction 7 years). 0 10 20 30 40
Slow groundwater (29% of flow and flowing in porous Time (year)
rock) had MTTs 12–28 years (mobile fraction 12 years,
immobile fraction 28 years). (c) 10
These studies demonstrate that large rivers generally
8
discharge large proportions of old water. Most of the
Nitrate (mg/l)
studies cover some of the bomb peak years, when 6
3 Model 2 tritium
H data were most effective for determining ages, so
the age estimates are considered very reliable. The 4
average MTT of the old water component from Table III Nitrate
2 input Model 1 oxygen-18
is 10 š 5 years, and comprised 52 š 26% of annual
function
streamflow. The results are relatively homogeneous,
0
which is probably related to the catchments being humid 1990 2000 2010 2020 2030 2040
and large enough to average out diverse landscape Figure 3. (a) Conceptual flow models, and (b) distribution of transit times
elements. for model 2, for the average of the large rivers from Table III. (c) The
Figure 3a shows conceptual flow models representing consequent nitrate response of the average river to a decrease of nitrate
in its input
the average from Table III. Note that treating the entire
flow as one exponential component (model 1) still
produces different results for 18 O and 3 H. With two for agricultural or urban use can also affect the mean
exponential components (model 2), 18Ð5% of the water residence time at the macroscale. As the water drains
would be older than 10 years and 7% older than 20 years back to the river, it would increase the apparent age of the
(see distributions in Figure 3b). It is clear that there river water. Similarly, artificial drainage of agricultural
must be substantial storage volumes for this water in lands could short-circuit the groundwater pathways and
the catchments. Most of the authors ascribe this storage reduce the apparent age of the river water.
to groundwater aquifers. (Some refer to the water as
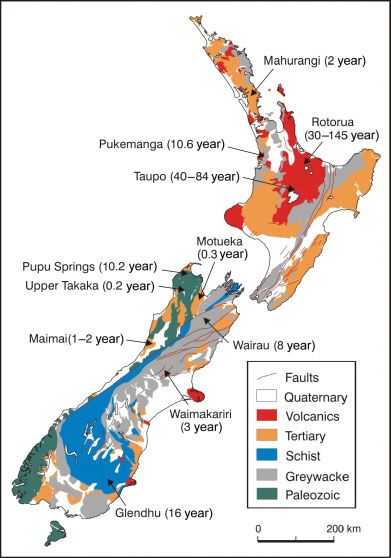
‘subsurface runoff’.) Although most subsurface flowpaths Groupings by geological class in New Zealand
are likely to pass through both the unsaturated and Recent studies have shown that topography (McGuire
saturated zones, there must also be substantial access to et al., 2005), soil drainage class (Soulsby and Tetzlaff,
deep groundwater systems. 2008) and drainage density (Hrachowitz et al., 2009)
Other more minor factors potentially affecting the may control the spatial pattern of stream residence time
baseflow age include the presence of lakes or storage within particular classes of rocks. Here we contend that
dams in the catchments. As noted by Michel (2004), geology (and deep groundwater as evidenced by 3 H-
storage of water in lakes and dams would reduce the based residence time) may define an overarching control
amount of immediate runoff and increase the delayed at the scale of the country of New Zealand. Figure 4 is
runoff. However, storage time of water in lakes or dams a generalized geological map of New Zealand showing
is likely to be much shorter than that in groundwater bedrock geology and the locations of studied streams
systems, so the delayed fraction would be greater, but (Tables II and III). The various classes of rocks provide a
its age would be less. Extraction of water from the river guide to streamflow characteristics, despite considerable
Copyright 2010 John Wiley & Sons, Ltd. Hydrol. Process. 24, 1646– 1659 (2010)TRUNCATION OF STREAM RESIDENCE TIME 1655
gneiss, Rose, 1993, 1996) may also show similar proper-
ties. Glendhu (16 years MTT on 60% of streamflow) also
shows considerable storage, indicating groundwater flow
within the schist bedrock. The streams in this group of
old rocks are highly variable, but most show large frac-
tions of old water (generally older than can be seen by
18
O).
Tertiary sediments underlie streams in a considerable
part of the country. Maimai Catchment and part of
the Upper Motueka River catchments are on Tertiary
sediments laid down during an intense mountain building
episode of the Southern Alps. Mahurangi Catchment is
also on Tertiary sediment, but not related to the Southern
Alps. MTTs in these environments appear to be short (up
to 2 years) reflecting low permeability of these rocks.
In contrast, the young volcanic rocks covering a large
part of the central North Island of New Zealand have
streams with very long transit times. Ash-fall deposits
form large sheets at Rotorua and Taupo; these have
remarkable hydrological properties as shown by MTTs of
30–145 years on nearly all the streamflow in six streams
at Rotorua and eight streams at Taupo. Elsewhere in the
world, older volcanic rocks at Kawakami Catchment in
Japan discharge streamflow with MTT 19 years on 33%
of the flow. Young volcanic ash-flow deposits also occur
in Southern Chile, where they cover 62% of the area
(Blume et al., 2008). Although no 3 H measurements have
been made, it is likely that the streams also discharge
water with very long MTTs. It is believed that young
Figure 4. Generalized geological map of New Zealand showing locations ash-flow rocks anywhere are likely to have the ability
of studied catchments and their baseflow MTTs based on 3 H
to store very large quantities of water and produce very
old streamflow, but other eruptive (but non-explosive)
igneous rocks (rhyolites, andesites, basalts) can have very
variations in hydrological properties within classes in different hydrological properties and responses.
some cases.
Paleozoic rocks are present in the South Island
(Figure 4). The Upper Takaka River drains Paleozoic DISCUSSION AND CONCLUSIONS
schist of very limited porosity and permeability and has On the implications of stream residence time truncation
very short MTT (2 months). In contrast, the Waikoropupu in watershed hydrology
Springs (Pupu Springs on Figure 4) drain Paleozoic mar- The current largely sole focus on streamwater res-
ble; the MTT of old water is 10Ð2 years and comprises idence time deduced from 18 O studies has truncated
74% of the flow. (This is a rare case where the age of our view of streamwater residence time and skewed
the water becomes younger as flow decreases; Stewart our understanding of how catchments store and trans-
and Thomas, 2008.) Greywacke is the true basement of mit water. This truncated view of streamwater resi-
both islands. The Waimakariri (90% of flow has 3 years dence time is problematic because most of the work
MTT) and Wairau (40% has 8 years MTT) rivers rising in that now strives to develop relationships between catch-
the Southern Alps drain greywacke, which against expec- ment characteristics and streamwater residence time (e.g.
tation provides considerable storage of old water. For McGuire et al., 2005; Soulsby and Tetzlaff, 2008; Tet-
the Wairau, Taylor et al. (1992) commented that ‘large zlaff and Soulsby 2008; Hrachowitz et al., 2009) do
deposits of scree in higher-lying, formerly glacial catch- so solely on the basis of 18 O (and in some cases Cl)
ments appear to be the major factor in the surprisingly records. Similarly, the many new model approaches that
large quantity of stored water implied’. There may also include representations of residence time for model test-
be storage in fractured greywacke aquifers. Pukemanga ing and development (Vache et al., 2004; Vache and
Stream drains from highly weathered greywacke on the McDonnell, 2006) have relied to date on the trun-
west of the North Island. The old age (10Ð6 years MTT cated residence time from 18 O-derived field studies. The
on 85% of streamflow) appears to reflect the weathered use of these convolution-based estimates in watershed
(clay-rich) nature of the substrate above bedrock as well rainfall-runoff models for transport in the subsurface
as groundwater flow within the bedrock. Weathered hard could be severely compromised by their clipped res-
rocks in Japan (Kosugi et al., 2008) and USA (piedmont idence times. Similarly, if we used these models to
Copyright 2010 John Wiley & Sons, Ltd. Hydrol. Process. 24, 1646– 1659 (2010)1656 M. K. STEWART, U. MORGENSTERN AND J. J. MCDONNELL
calculate the response of a stream to a decrease in On the use of 3 H in a post-bomb world
nitrate recharge (following Michel, 2004), then our esti-
So how can we use 3 H in future studies even though
mates of stream chemistry could be quite different. For 3
H concentrations in precipitation have declined so
instance, if a shift in nitrate concentration from 10 to
greatly after the 1960s? Figure 5 shows representative
0 mg/l occurred at the start of 2000 (as illustrated for 3
H records for precipitation in the Northern and Southern
the large river average in Figure 3c), the nitrate in the
Hemispheres. The main features in both curves are the
stream would be predicted to fall rapidly with a trun-
pronounced bomb peaks due to nuclear weapons testing
cated 18 O-based streamwater residence time estimate of
mainly in the Northern Hemisphere during the 1950s
2Ð3 years (model 1). By 2010, nitrate would apparently
and 1960s. The peak was much larger in the Northern
have been almost entirely removed from the stream. With Hemisphere than in the Southern Hemisphere. Since then
the 3 H-based estimate (model 2), streamwater nitrate con- there has been a steady decline due to leakage of 3 H from
centrations would initially decrease rapidly to around the stratosphere into the troposphere from where it is
5 mg/l by the end of the first year, because of the quick removed by rainout, together with radioactive decay of
runoff component, but then the rate of decrease would 3
H. Difficulties with using 3 H for dating have resulted
slow as longer-retained nitrate-bearing groundwater (i.e. from the similarity in the slope of the decline to the
the slow runoff component) continues to flow into the decrease due to radioactive decay of 3 H. The straight lines
stream. By 2010, for instance, predicted stream concen- in the figure illustrate 3 H decay in groundwater recharged
tration would be 2Ð0 mg/l; by 2020 it would still be in 1980s.
0Ð7 mg/l. However, it can be seen that the rain record has begun
Our comments here are not new. Benchmark papers in to diverge from the straight lines in recent years. In
the field of residence time analysis in watersheds used the Southern Hemisphere, this has been for about the
both stable isotope and tritium analysis of streamwa- last 15 years, while for the Northern Hemisphere it is
ter (Maloszewski and Zuber, 1982; Maloszewski et al., for about 5 years. This already allows young and older
1983). This re-focusing on the role of deep groundwater groundwater to be distinguished, and the situation will
coincides with recent hydrometric-based observations of improve in time with further decay of the remaining
the role of deep groundwater on hillslope and headwa- bomb 3 H. The rain record for the Southern Hemisphere
ter catchment response (e.g. Kosugi et al., 2008). Indeed is from Kaitoke, New Zealand, and that for the Northern
many of the key hillslope studies in the past decade Hemisphere is from Vienna, Austria. The North American
have implicated deep groundwater in hillslope response representative record from Ottawa is shown only until
(e.g. Montgomery and Dietrich, 2002; Uchida et al., 1981 because later it was influenced by local 3 H sources.
2004; Ebel et al., 2008). The combination of these new However, the good agreement between the Ottawa and
hydrometric-based approaches to quantifying the role of Vienna records prior to 1985 shows that the Vienna
deep groundwater (especially in the headwaters) with 3 H- record can be used as an approximation for Northern
based streamwater residence time estimates seems like a Hemisphere sites.
particularly good way forward. To demonstrate the 3 H output of a catchment, Figure 6
shows the 3 H outputs for the Northern and Southern
Hemispheres based on the EM. The current outputs
(marked 2010) are shown together with the outputs
10 years ago (2000) and in 15 years time (2025) to
demonstrate the situation with ambiguous age interpre-
1000 Ottawa
Vienna tations due to the interference of bomb 3 H. The curves
in 2000 showed a large amount of bomb 3 H leading
to ambiguous age interpretations in the age range 0 to
Tritium Units (TU)
100 about 50 years for both hemispheres. For the current
3
H output, the Southern Hemisphere already shows a
monotonous decline with age which enables unique ages
to be determined (and in principle for single 3 H mea-
10 Kaitoke
surements to be usable for age determinations). In the
Northern Hemisphere, the much larger input of bomb 3 H
to the hydrologic systems still causes an ambiguous 3 H
1 output within the age range 0–50 years at present. But
1960 1970 1980 1990 2000 the remaining bomb 3 H is expected to decrease, result-
ing in a monotonously declining 3 H output within a few
Figure 5. Tritium concentration in precipitation at Ottawa, Canada and
Vienna, Austria (Northern Hemisphere) and Kaitoke, New Zealand years. It needs to be noted that despite the ambiguous
(Southern Hemisphere). Tritium concentrations are expressed as tritium ages due to bomb 3 H obtainable at present, collecting
units (TU) with 1 TU corresponding to a ratio of tritium/total hydrogen 3
H data now will be valuable in a few years. This is
D T/H D 1018 (Morgenstern and Taylor, 2009). The straight lines show
the effects of radioactive decay of tritium in groundwater recharged in because the bomb peak has advantages as well as disad-
1980s vantages for dating—dating now requires time-separated
Copyright 2010 John Wiley & Sons, Ltd. Hydrol. Process. 24, 1646– 1659 (2010)TRUNCATION OF STREAM RESIDENCE TIME 1657
the bomb peak years. Future studies will preferably use
2000 a number of years of data (e.g. decadal scale data, Rose,
2007). Although the cost of individual measurements is
2010 relatively high, the method only requires measurements at
10 long intervals so the number of samples is likely to be low
2025
Vienna
and overall cost will be inexpensive (depending on the
objectives of the study). Sample collection is straightfor-
Tritium Units (TU)
ward and best coordinated with on-going streamflow and
geochemical measurements, in particular 18 O and other
2000 age dating methods (CFCs, etc.).
2010
1
Future directions
2025
The foregoing has shown that a substantial fraction
of the water in many streams is very old. What does
Kaitoke this mean for interpretation of flow pathways through the
catchments? The results certainly confirm that groundwa-
ter contributes strongly to many streams, a result which
0 20 40 60 80 100 120 140 160 180 200 has been well-known by some (e.g. Sklash and Farvolden,
Mean residence time (years) 1979; Winter, 2007; Lerner, 2009; Tellam and Lerner,
Figure 6. Tritium concentrations predicted in groundwater after apply-
2009), although is disputed by others. The nature of the
ing an EM to tritium inputs measured at Vienna, Austria (Northern groundwater system feeding the stream is the point of
Hemisphere) and Kaitoke, New Zealand (Southern Hemisphere). Tritium interest. Long transit times would indicate that there is
concentrations are expressed as tritium units (TU) with 1 TU correspond-
ing to a ratio of tritium/total hydrogen D T/H D 1018 (Morgenstern and
considerable storage within catchments. Taking the aver-
Taylor, 2009). Ambiguous ages (i.e. two or more possible ages) arise for age for the large rivers studied (MTT 10 years on about
the parts where the curves rise or are level. The horizontal lines show 50% of streamflow, Table III), we can explore the stor-
average measurement errors (one sigma) of the ten best Northern Hemi-
sphere laboratories (Groening et al., 2007) for the Northern Hemisphere,
age amounts required. For annual precipitation 1000 mm
and the New Zealand laboratory (Morgenstern and Taylor, 2009) for the with evapotranspiration 600 mm, recharge and therefore
Southern Hemisphere annual streamflow is 400 mm/year. The storage require-
ment to supply 10 years of 50% of the annual flow is
data. After re-sampling, such time series data will be able therefore 2 m. With total porosity 0Ð2, this requires an
to resolve the ambiguity and establish accurate transit aquifer thickness of 10 m over the whole watershed.
time distributions, pinpointing both parameters (the mean The presence of groundwater in streams is often
residence time and the exponential fraction). attributed to flow over the regolith/bedrock interface,
It is seen from Figure 6 that the 3 H concentrations where it is assumed there is a strong permeability
in hydrologic systems in the Southern Hemisphere are contrast (see Weiler et al. 2005, for a review). The
much smaller than those in the Northern Hemisphere, so above calculation shows that this explanation can be
more sensitive and accurate measurements are required. ruled out by the storage requirements of the ‘average’
The error bar (horizontal line with broken lines show- model from Table III. What is now needed are pro-
ing one-sigma measurement error) illustrates the current cess studies that relate deeper groundwater flow pro-
measurement precision in New Zealand (Morgenstern and cesses to watershed response. Indeed, this has begun with
Taylor, 2009). The high precision is sufficient to con- hydrogeophysics approaches that examine deep ground-
strain robust age interpretations with 2–3 years accuracy. water response (Robinson et al., 2008), hydrochemical
Figure 6 also shows the error bar for Northern Hemi- approaches to understanding groundwater–streamwater
sphere 3 H laboratories. The indicated error is the aver- interactions (Anderson and Dietrich, 2001), sprinkling
age of the ten best NH 3 H laboratories (Groening et al., experiments to examine the loss to deep groundwa-
2007). Although the predicted 3 H output for NH systems ter from transient saturation at the soil–bedrock inter-
in 15 years will be a similar monotonous gradient to that face (Tromp van Meerveld et al., 2007) and wellfield
of the current SH, the measurement accuracy of Northern analysis of deep groundwater dynamics in headwater
Hemisphere laboratories is not yet sufficient for accurate areas (Kosugi et al., 2008). Notwithstanding, these new
age dating and needs to be improved. Note also that the approaches need to be carried out in concert with trac-
3
H input is not known sufficiently for many locations. ers that can reveal and help quantify long tails of the
However, the 3 H input function for catchments can usu- residence time distribution. Although studies have previ-
ally be established by measuring 3 H in rainwater for 1 ously advocated greater use of hydrogeologically oriented
or 2 years in order to scale the 3 H input function of the tracers in watershed hydrology (Devine and McDonnell,
nearest long-term 3 H monitoring station. 2005), our work here shows a rather glaring issue requir-
The 3 H studies cited have generally used series of mea- ing concerted effort by the watershed hydrology commu-
surements on streams covering a number of years (the nity. Truncated residence times pose a threat to useful
longer the better) to determine MTTs. The most effec- and accurate model development and testing by provid-
tive studies have used data from during and shortly after ing skewed targets and benchmarks for model calibration.
Copyright 2010 John Wiley & Sons, Ltd. Hydrol. Process. 24, 1646– 1659 (2010)1658 M. K. STEWART, U. MORGENSTERN AND J. J. MCDONNELL
An especially useful approach will be to intercompare and New Hydrometric Techniques. IAHS-Pub. No. 258: Wallingford;
101–110.
and contrast geology between different catchments to Hrachowitz M, Soulsby C, Tetzlaff D, Dawson JJC, Malcolm IA. 2009.
understand what conditions give rise to big and small dif- Regionalization of transit time estimates in montane catchments by
ferences between 3 H-based and 18 O-based approaches. In integrating landscape controls. Water Resources Research 45: W05421.
DOI: 10.1029/2008WR00749.
fact, something like this could serve as a new ratio by Kendall C, McDonnell JJ. 1998. Isotope Tracers in Catchment
which to classify catchments in terms of their amounts Hydrology. Elsevier Science BV: The Netherlands; 839.
of deep groundwater contributions to flow. Koeniger P, Wittmann S, Leibundgut Ch, Krause WJ. 2005. Tritium
balance modelling in a macroscale catchment. Hydrological Processes
19: 3313– 3320.
Kosugi K, Katsura S, Mizuyama T, Okunaka S, Mizutani T. 2008.
Anomalous behavior of soil mantle groundwater demonstrates
ACKNOWLEDGEMENTS
the major effects of bedrock groundwater on surface hydro-
logical processes. Water Resources Research 44: W01407. DOI:
Financial support for this study was provided by the New 10.1029/2006WR005859.
Zealand Foundation for Research, Science and Technol- Lerner DN. 2009. Groundwater matters. Hydrological Processes 23:
ogy through grants to GNS Science (C05X0706, ‘New 3269– 3270.
Maloszewski P, Rauert W, Stichler W, Herrmann A. 1983. Application
Zealand Groundwater Quality’) and NIWA (C01X0304, of flow models in an alpine catchment area using tritium and deuterium
‘Water Quality and Quantity’) via a subcontract to GNS data. Journal of Hydrology 66: 319–330.
Science. We thank Cody Hale, Rosemary Fanelli and Maloszewski P, Rauert W, Trimborn P, Herrmann A, Rau R. 1992.
Isotope hydrological study of mean transit times in an alpine basin
Matthias Raiber for useful discussions on an earlier ver- (Wimbachtal, Germany). Journal of Hydrology 140: 343– 360.
sion of this manuscript. Two anonymous reviewers are Maloszewski P, Zuber A. 1982. Determining the turnover time of
groundwater systems with the aid of environmental tracers, 1. Models
also thanked for their helpful comments. and their applicability. Journal of Hydrology 57: 207–231.
Martinec J, Siegenthaler U, Oeschger H, Tongiorgi E. 1974. New
insights into the runoff mechanism by environmental isotopes. Isotope
Techniques in Groundwater Hydrology. In Proceedings of a Symposium
REFERENCES Organised by the I.A.E.A. Vienna; 129– 143.
Anderson SP, Dietrich WE. 2001. Chemical weathering and runoff Matsutani J, Tanaka T, Tsujimura M. 1993. Residence times of soil water,
chemistry in a steep headwater catchment. Hydrological Processes 15: ground and discharge waters in a mountainous headwater basin, central
1791– 1815. Japan, traced by tritium. Tracers in Hydrology. IAHS: Yokohama;
57–63.
Begemann F, Libby WF. 1957. Continental water balance, groundwater
McGlynn BL, McDonnell JJ, Stewart MK, Seibert J. 2003. On the
inventory and storage times, surface ocean mixing rates and world-wide
relationships between catchment scale and streamwater mean residence
circulation patterns from cosmic-ray and bomb tritium. Geochimica et
time. Hydrological Processes 17: 175–181.
Cosmochimica Acta 12: 277– 296.
McGuire KJ, McDonnell JJ. 2006. A review and evaluation of catchment
Behrens H, Moser H, Oerter H, Rauert W, Stichler W. 1979. Models
transit time modelling. Journal of Hydrology 330: 543–563.
for the runoff from a glaciated catchment area using measurements
McGuire KJ, McDonnell JJ, Weiler M, Kendall C, Welker JM, McG-
of environmental isotope contents. Isotope Hydrology 1978. In
lynn BL, Seibert J. 2005. The role of topography on catchment-scale
Proceedings of the I.A.E.A. Symposium in Neuherberg, IAEA, Vienna.
water residence time. Water Resources Research 41: W05002. DOI:
Beven KJ. 1989. Changing ideas in hydrology: the case of physically 10.1029/2004WR00365.
based models. Journal of Hydrology 105: 157– 172. Michel RL. 1992. Residence times in river basins as determined by
Blume T, Zehe E, Bronstert A. 2008. Investigation of runoff generation analysis of long-term tritium records. Journal of Hydrology 130:
in a pristine, poorly gauged catchment in the Chilean Andes II: 367–378.
Qualitative and quantitative use of tracers at three spatial scales. Michel RL. 2004. Tritium hydrology of the Mississippi River basin.
Hydrological Processes 22: 3676– 3688. Hydrological Processes 18: 1255– 1269.
Bohlke JK, Denver JM. 1995. Combined use of groundwater dating, Montgomery DR, Dietrich WE. 2002. Runoff generation in a steep
chemical and isotopic analyses to resolve the history and fate of nitrate soil-mantled landscape. Water Resources Research 38: 1168. DOI:
contamination in two agricultural watersheds, Atlantic coastal plain, 10.1029/2001WR000822, 2022.
Maryland. Water Resources Research 31: 2319– 2339. Morgenstern U. 2007. Lake Taupo Streams: Water age distribution,
Busenberg W, Plummer LN. 1992. Use of chlorofluorocarbons (CCl3 F fraction of landuse impacted water, and future nitrogen load.
and CCl2 F2 ) as hydrologic tracer and age-dating tools: the alluvium Environment Waikato Technical Report 2007/26. Environment
and terrace system of Central Oklahoma. Water Resources Research Waikato: Hamilton, New Zealand; 21.
28: 2257– 2283. Morgenstern U, Reeves RR, Daughney CJ, Cameron S, Gordon D. 2005.
Devine C, McDonnell JJ. 2005. The future of applied tracers in Groundwater age and chemistry, and future nutrient load for selected
hydrogeology. Hydrogeology Journal 13: 255–258. Rotorua lakes catchments. Institute of Geological & Nuclear Sciences
deWalle DR, Edwards PJ, Swistock BR, Aravena RJ, Drimmie RJ. 1997. science report 2004/31; 73.
Seasonal isotope hydrology of three Appalachian forest catchments. Morgenstern U, Taylor CB. 2009. Ultra low-level tritium measurement
Hydrological Processes 11: 1895– 1906. using electrolytic enrichment and LSC. Isotopes in Environmental and
Dinçer T, Payne BR, Florkowski T, Martinec J, Tongiorgi E. 1970. Health Studies 45: 96– 117.
Snowmelt runoff from measurements of tritium and oxygen-18. Water Robinson DA, Binley N, Crook N, Day-Lewis FD, Ferr’e TPA, Grauch
Resources Research 6: 110– 124. VJS, Knight R, Knoll M, Lakshmi V, Miller R, Nyquist J, Pellerin
Ebel BA, Loague K, Montgomery DR, Dietrich WE. 2008. Physics- L, Singha K, Slater L. 2008. Advancing process-based watershed
based continuous simulation of long-term near-surface hydrologic hydrological research using near-surface geophysics: a vision for, and
response for the Coos Bay experimental catchment. Water Resources review of, electrical and magnetic geophysical methods. Hydrological
Research 44: W07417. DOI: 10.1029/2007WR006442. Processes 22: 3604– 3635.
Eriksson E. 1958. The possible use of tritium for estimating groundwater Rose S. 1993. Environmental tritium systematics of baseflow in Piedmont
storage. Tellus 10: 472– 478. Province watersheds, Georgia (USA). Journal of Hydrology 143:
Groening M, Dargie M, Tatzber H. 2007. 7th IAEA Intercomparison of 191–216.
Low-Level Tritium Measurements in Water (TRIC2004). http://www- Rose S. 1996. Temporal environmental isotopic variation within
naweb.iaea.org/NAALIHL/docs/intercomparison/Tric2004/TRIC2004- Falling Creek (Georgia) watershed: implications for contributions to
Report.pdf. streamflow. Journal of Hydrology 174: 243– 261.
Herrmann A, Bahls S, Stichler W, Gallari F, Latron J. 1999. Isotope Rose S. 2007. Utilization of decadal tritium variation for assessing the
hydrological study of mean transit times and related hydrological residence time of base flow. Ground Water 45: 309–317.
conditions in Pyranean experimental basins (Vallcebre, Catalonia). Sayama T, McDonnell JJ. 2009. A new time-space accounting scheme to
Integrated Methods in Catchment Hydrology—Tracer, Remote Sensing predict stream water residence time and hydrograph source components
Copyright 2010 John Wiley & Sons, Ltd. Hydrol. Process. 24, 1646– 1659 (2010)You can also read