Trends and insights on what's driving the profitable checkout category performance - Sweets and Snacks Expo
←
→
Page content transcription
If your browser does not render page correctly, please read the page content below
2 0 2 2
        CHECKOUT
         UPDATE

Trends and insights on what’s driving the
profitable checkout category performance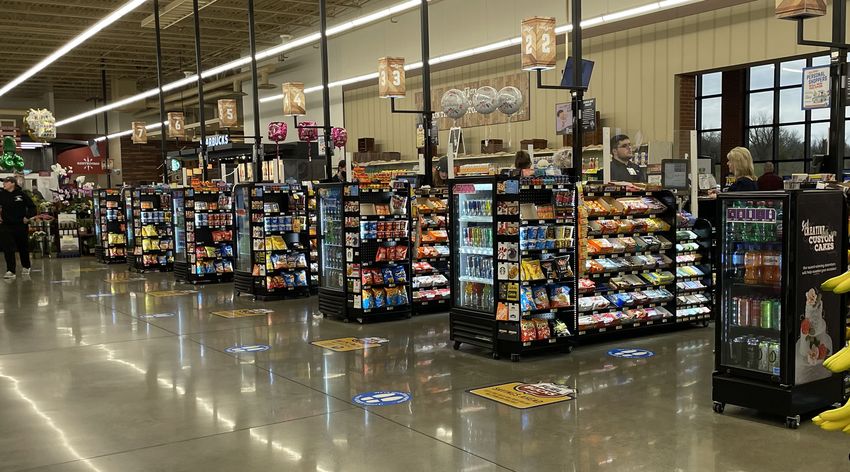
INDUSTRY TRENDS IMPACTING THE
CHECKOUT EXPERIENCE

Pandemic effects continue through 2021 into 2022

                                    March 2022
                                                        *economi                                                    population
                                    unemployment        c growth
                                    rate3.6%
                                                            -1.4%
                                   6.9% are                 Q1 2022
                          underemployed

                                                   retail sales
        March 2022                                                      April 2022

         inflation                                       +6.9%                                                      334.5MM
              +8.5                                       March 2022
                                                         *                        average
                                                                                                                            April 2022

              %*                                                       $4.2       price per
                                                                                  gallon                                 +0.5%
                                                                                                                        annual growth
                                                                       1
                                                                       up 42% from YA prices

Source: U.S. Census Bureau, Univ. of Michigan,                                                        *Compared with previous year
IRI presentation 4/2022                                               *Gross Domestic Product, First Quarter 2022 (Advance Estimate)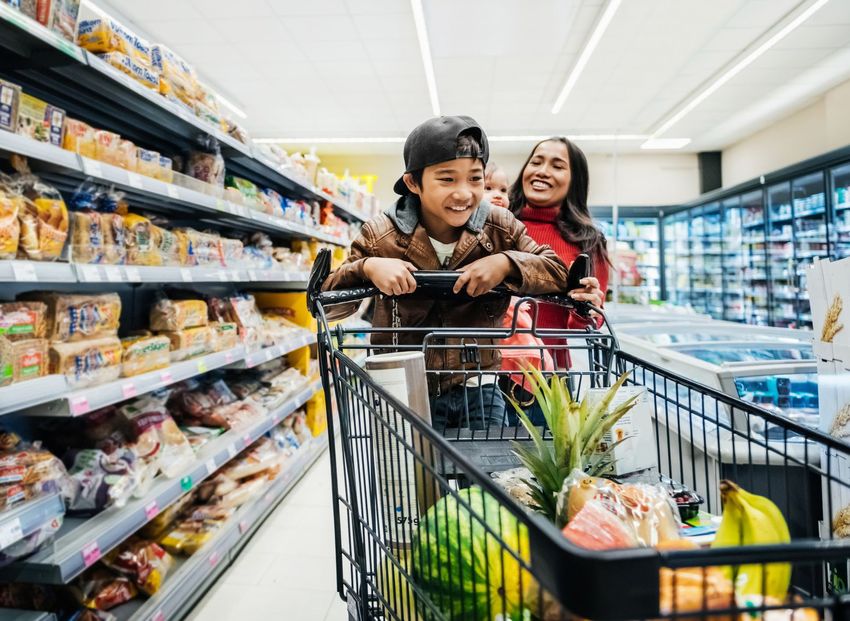
eCommerce continued to grow in 2021

                                                In 2021, shoppers spent

                                               $982.3 Billion
                                                in MULO+eCommerce

                                                 +4.9% vs YA
                                                  eCommerce has a

                                                19.9% $ share
                                                +2.5pts vs YA
Source: IRI MULO + eCommerce 52 w/e 12/26/21
Consumers are shopping online for groceries more frequently &
    spending more per trip
                How often do you place an online grocery order?                   How much do you typically spend on an online
                                                                                               grocery order?
50%                                                                       60%
                                         2020        2021                                           2020        2021
40%

30%
                                                                          40%
20%

10%

0%
                                                                          20%

                                                                           0%

                                                                                    $0-$50           $50-$100          $100+

• 72% had ordered groceries online in                                    • 50% typically spend $50-100 on their
          the last 90 days                                                      online grocery orders
•       Special occasions/holidays have seen the
                                                                         • 33% of shoppers are purchasing pantry
        largest drop off with ~                          15% selecting          staples & supplies
        that option
      Source: Chicory Online Grocery Usership 2022 edition
However, we’re already seeing some shift in purchase intent

                                                                                                     Online Grocery Purchased & Purchase Intent

                                                                                                                                    62.5%
                                                                                                                                            59.0%
                                                                                                                                                        54.3%
                                                                                                                            52.0%
                                                                                                                                                49.5%
                                                                                                                                                            46.9%
                                                                                                                    39.5%
                                                                                                            36.8%

                                                                                                    25.8%
                                                                                            23.1%

                                                                                               2018            2019           2020             2021       2022

                                                                                                                Have purchased in the last 12m
                                                                                                                Expect to buy in the next 12m

Source: Supermarket News: Share of US Shoppers buying groceries online stabilizes 5/16/22
The physical store is the still the place most shoppers buy food

                         80%+
                of grocery
              shoppers are
              making their
            purchases in-store

Source: IRI eCommerce 52wks ending 12/26/21
Inflation is changing how consumers are feeling and shopping

        Nearly         9 in 10
                             of
        consumers say rising prices
        on essential goods & services
        are their primary concern

        45% are looking for
        sales/deals more often

        33% are cutting back on
        non-essentials

Source: Numerator Insights: Inflation Insights Report November 2021
Out of stocks and product availability has been a major issue
Estimate that retailers
lose 8% of
revenue
through poor
inventory availability
Source: Chain Store Age Survey reveals consumer frustration with out-of-stocks 3.21.22Stressed shoppers are looking for convenience
Shoppers are:
• Fatigued
• Stressed
• Time Constrained
Looking for:
• Convenience
• Simplification
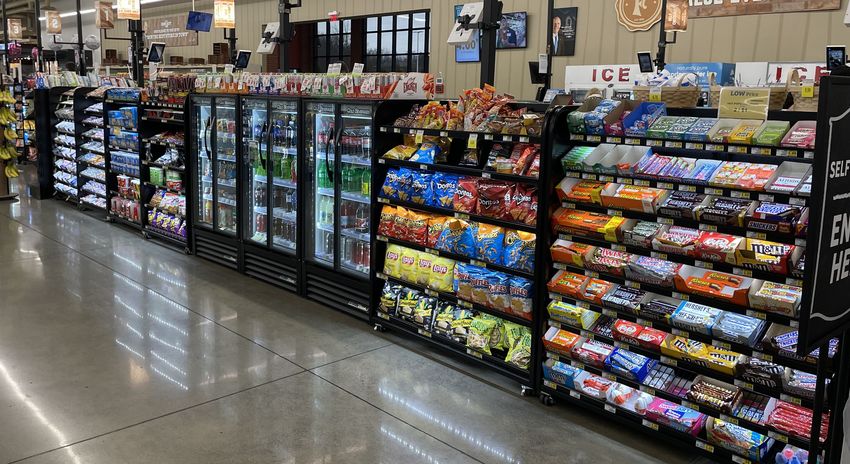
• InspirationSelf-Checkout installations accelerated due to COVID
• Shoppers perceive self-
checkout as safer than
interacting with a cashier
• Shoppers want to be out of the
store faster
• Global shipments of self-
checkout machines increased
by 25% in 2020
Source: Retail Customer Experience, Self-Checkout Machine Systems Jump 25% in 2020; December 2, 2021Self-checkout is closing the gap with cashier lane in % of transactions
% of Shoppers by Lane Type
80%
70% 66.1%
60% 53.3% 51.9%
50%
46.7% 48.1%
40%
30% 33.9%
20%
10%
0%
2019 2020 2021
Cashiered SCO
Shopper transactions show the shift in
increased usage by 14pts since 2019
Source: IMC Proprietary Retailer Research 2021Actual usage of self-checkout varies by retailer
% Transactions by Lane
Retailer A 48.3% 51.7%
Retailer B 36.4% 63.6%
Retailer C 55.5% 44.5%
Retailer D 66.3% 33.7%
Retailer E 41.4% 58.6%
Retailer F 67.6% 32.4%
Cashiered lanes SCO
On average, 59% of shoppers used
cashiered lanes and 41% used self-checkout
Source: IMC Proprietary Retailer Research 2021-2022Younger shoppers are more interested in Non-Traditional checkout
Desired checkout experience:
Most wanted checkout experience by generations
Traditional
Non-Traditional
Self-checkout
Scanning/Paying with phone
No checkout in store
Scan/Pay with store's device at
checkout
Phone scan/pay at checkout
0% 10% 20% 30% 40% 50% 60% 70% 80% 90%
Baby Boomers & Seniors Gen X Bridge Millennials Millennials Gen Z
Source: PYMNTS.com Today’s Self-Service Shopping Journey Grocery ResultsRetailers plan to invest in technologies to solve some their biggest
challenges – and self-checkout is a top priority
Top Grocery
technology priorities
in 2022
67% Inventory visibility
49% Adding self-checkout
1 out of 5 grocers plan
POS infrastructure upgrades –
both in hardware and software
Source: IHL/Intel Consumer Survey 2021 of FDCM retailers
https://progressivegrocer.com/6th-annual-grocery-tech-trends-studyCHECKOUT CATEGORY PERFORMANCE
Checkout is a $6.2B Category in Grocery

                              Annual US Supermarket Sales*
                              = $804 Billion X .77%** of Sales
                                                                                      Total Checkout Sales $
                            = ~$6.2 Billion Total Checkout Sales
                                                         0.87%                                                 $6.16

                               0.77%                                          $5.54

                       % of Store Sales            % of Store Profit          2017                             2021

          Checkout is almost  .8% of total store sales equaling        Category has increased      11.2%    since 2017

                          $6.2B in total category sales                       driven by gains over the 5 years

Source: IMC Checkout Update 2022
Checkout items are in 21% of grocery baskets
Product Trips
2020 2021
89.2 88.5
17.8 18.6
Total Store Checkout
Source: IRI Integrated Front-End Food 52 w/e 12/26/21Baskets including Front-End items and Sweet and Snack categories
grew faster than the average and with larger baskets
Total CPG ̶ Basket Size by Front-End and Sweet and Snack Departments
In-Basket Dollars per Trip
Departments Grocery % Chg Vs YA
Total Store $50.10 1.9%
Front-End $75.00 4.0%
Gum $85.85 8.1%
Breath fresheners $80.87 6.1%
Chocolate candy $74.82 1.0%
Non-chocolate candy $81.32 4.2%
Cookies $84.11 4.6%
Salty snacks $78.27 2.5%
Source: IRI OmniConsumer™ Scan Panel, Total U.S. Grocery, YTD ending April 17, 2022 vs. YACategory conversion – units sold per 100 households - is up 13.9%
since 2017
+13.9% Unit Conversion (Units sold per 100 households)
18.1
15.9
6.2
5.1 5.1 5.1
+112.8%
3.2 3.1 2.8
1.5
0.7 0.4 0.4 0.4
Total Checkout Beverages Snacks Candy & Gum & Mints Magazines GM / HBC
*Source: IMC Checkout Update 2021
Chocolate
2017 2021
Source: IMC Checkout Update 2022Best in class retailers are driving higher conversion
Total Checkout Unit Conversion (Units 27.6%
Sold per 100 Customers) higher
23.1 conversion
Value of Total Checkout
18.1 Unit Conversion from Annual Per Per Day / Per
14.6 Average Performing to Store Store
Top Performing
$ Sales $38,758 $106.19
Gross Profit $9,890 $27.10
Bottom Average Top
Source: IMC Checkout Update 2022
Top Performing Retailers – Top 5 retailers based on TTL Checkout units sold per 100 customers
Bottom Performing Stores – Bottom 5 retailers based on TTL Checkout units sold per 100 customers
Source: FMI Institute. Sales per Customer Transaction 2019Continued growth is challenged without effective self-checkout
merchandising
On average, the conversion difference between cashiered
and
self-checkout lanes is 50% across all categories
% Average Conversion Difference by Segment
10 0%
9 -10%
8 -20%
7 -29.3% -30%
6 -41.4% -40%
5 -48.7% -50%
9.3 -55.5%
4 7.8 -60%
3 6.5 -70%
-73.7%
2 3.8 -80%
3.5 3.1
1 -91.3% -90%
1.6
1.0 0.6 0.1 0.7 0.4
0 -100%
Beverage Candy Gum & Mints Magazines Snacks GM
Cashiered Lanes SCO Lanes SCO % Difference
Source: IMC Proprietary Retailer Research 2021 – 6 retailers totalThis is particularly devastating for Confections where a larger portion of
category sales are from Checkout
% Total Category $ Sold in Checkout
86%
28%
22%
3%
Total Candy Gum/Mints Snacks
Confections
Source: IRI Integrated Front-End 52 w/e 12/26/21This is a $1.5 billion dollar risk to a top 10 center store category
Rank 2021 Top Categories Dollar Sales $ % Chg
All Categories $374,036,572,770 -2.5%
1 BEER/ALE/ALCOHOLIC CIDER $13,617,732,092 -4.4%
2 CARBONATED BEVERAGES $13,142,560,145 4.6%
3 SALTY SNACKS $13,023,946,932 1.2%
4 NATURAL CHEESE $10,858,592,350 -3.7%
5 WINE $10,123,383,305 -5.6%
6 FRESH BREAD & ROLLS $10,118,006,049 -2.5%
7 BOTTLED WATER $8,585,257,234 6.2%
8 DAIRY MILK $8,203,821,819 -4.2%
9 DINNERS/ENTREES - FZ $6,683,116,331 2.5%
10 CHECKOUT $6,156,727,642 2.7%
11 COFFEE $5,844,808,669 -3.4%
12 YOGURT $5,367,870,129 1.0%
13 BREAKFAST MEATS $5,316,519,195 -3.1%
14 ICE CREAM/SHERBET $5,027,315,114 -8.6%
15 COLD CEREAL $4,952,709,777 -9.6%
Source: IMC Checkout Update 2022
IRI Total US Food Calendar Year 2021The checkout experience is important to both the shopper and the retailer
Shopper: Retailer:
• More • An opportunity to
convenience and convert a
choice in purchase every
transaction trip
• No wait – or at • Meaningful
least a simplified contribution to
transaction overall in-store
process sales and profit
• Finding the items • The checkout
they want at experience
every register enhances shopper
loyaltyShopper “me-moment” fuels checkout purchases that are different
than center store purchases
• Typical need states at checkout
include:
• Hunger Satisfaction
• Reward
• Forgotten Items / Convenience
• Impulse purchases are less price
sensitive
• Items are consumed within 30
minutes after leaving the store
• Open to discovering something newThe key is to build a category strategy for Checkout
Analyze Track
26%
20% 19%
19%
18%
19% 16%
16%15%
15%
Strategize Design
13%
8% 8% 7%
7% 6%
6% 6%
6%
2%
Candy Snacks Gum & Magazines GM
MintsIRI FRONT-END SCORECARD
Integrated Front End Solution

• Retail checkout sales are currently at $6 billion and
  growing as the industry identifies ways to
  capitalize on all grocery checkout locations.

• Manufacturers and retailers struggle to gain
  headway in the front end without a transparent,
  data-driven view of queuing and checkout
  merchandising.
Utilize IRI’s Front-End Solution

                     Front-End Audit                                  Mega-Category                                   Best in Class
                                                                      Placement                                       Reporting
What?                Front-End UPCs are collected quarterly
                     by auditing UPCs selling in front end
                                                                      UPCs will be placed and accessible through
                                                                      a syndicated hierarchy: the Front-End
                                                                                                                     Make better, faster, decisions to
                                                                                                                     improve performance of front-end
                                                                      Mega Category hierarchy with an industry       sales through on-going tracking of
                     across a diverse sample of grocery stores
                                                                      first cross-category view of Front-End
A database
                                                                                                                     the Front-end in total.
                                                                      items.

model
containing items
commonly
found on front
end, reporting
sales factored to
the front end                                Dual Location
                                                                                              Unify
                                             Sales Factor
                                             IRI will identify UPCs selling in 1 or more     Data will be accessible through Unify,
                                             locations. IRI Data Science will apply a        including    POS     measures    and
                                             national sales factor methodology to            complete Unify capabilities
                                             sales for UPCs with multiple locations.
Integrated Front End Locations
Trained IRI field
service reps
collected all unique
Deli
items from six front
Salad Bar
Queuing
end locations.
Customer Service
Cooler Wall
Post Office
Self-Checkout Excluded:
• Corrugated
Checkouts
Online Carts Bakery Displays
Fire Starter ICE Dog Food Carts
Pickup • Front End Caps
(facing registers)
1 In-Line Register 2 Register End Cap 3 Queuing 5 Self-Checkout
4 Coolers Framing Self-Checkout or Queuing 6 Online Pickup
• Perimeter
Displays (between
registers and
Location Exclusions – Front end perimeter (all stocking areas/displays between front endcaps and registers), lane blockers, magazines
front end caps)IRI Integrated Front End enables clients to confidently track
performance of the front-end space
Expanded view of Understanding of A more uniform, An improved
front end checkout market share across longitudinal view of assessment of ROI on
sales across all the total front end to sales across retailers’ front end investments
categories competing assess brand total front end by tracking the sales
for this highly valuable development and and share impact of
shelf space opportunities changes made to a
retailer’s front end
80% Manufacturers who rely on front end space can have over 80% of
sales coming from this key location.Integrated Front End Detailed Reporting on Front End
» Performance
Analyze sales and share performance from front end
Mega Category down to Item level
» Assortment and Distribution
Understand assortment and distribution share and
trends across retailer and competitive markets
» Promotional Drivers
Decompose sales by base and incremental driversWhat is Sales and Share Performance by Product Level? - Category
What are the Top Share Drivers?
What is the Confection Assortment, Share of Sales (Sub Cat)?
What are Confections Front End Share and Distribution Trends?
Top Confection Items selling in ROM Parent but not in RMA
How does my Base and Incremental dollars decompose vs YA?
How do Front-End Base $, Incremental $, No Merch $, & Any Merch $
compare to Comp mkt?
What are the Assortment and Promotion Drivers Behind Front-End
Product Sales?
Bringing together expertise and insights to drive Front-End success
Thank You!

             impulsemarketingco.com
You can also read