TRANSFORMING UTILITIES & ENHANCING COMMUNITIES - April, 2021
←
→
Page content transcription
If your browser does not render page correctly, please read the page content below
TRANSFORMING UTILITIES & ENHANCING COMMUNITIES

                   April, 2021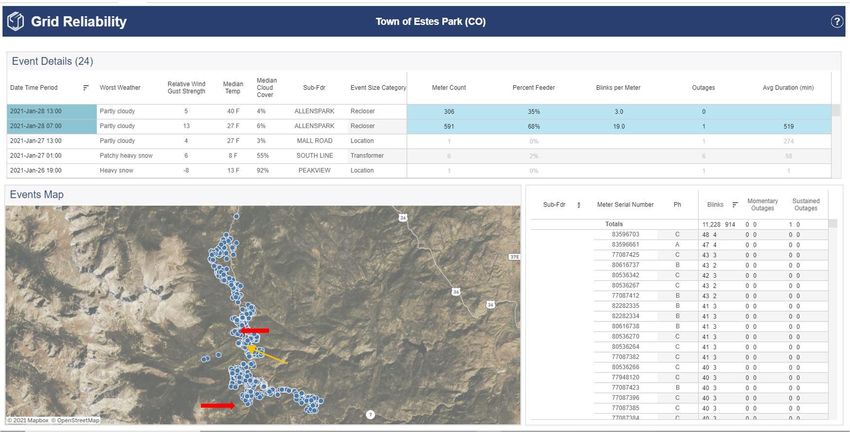
Disclaimer
IMPORTANT: YOU MUST READ THE FOLLOWING BEFORE CONTINUING. The information contained in this presentation has been prepared by Tantalus Systems Holding Inc. (the “Company”) for
information purposes only. References to “Tantalus” or the Company for periods prior to January 29, 2021 refer to the Company’s predecessor entities. This presentation does not constitute or form
part of any advertisement of securities, any offer or invitation to sell or issue or any solicitation of any offer to purchase or subscribe for, any securities of the Company in any jurisdiction, nor shall the
presentation or any part of it, nor the fact of its communication or distribution form the basis of, or be relied on in connection with, any contract or investment decision. No representation or warranty,
express or implied, is given by the Company, its affiliates or any of their respective advisers, officers, employees or agents, as to the accuracy, completeness or fairness of the information or for any loss
howsoever arising, directly or indirectly, from any use of the presentation or its contents. The merit and suitability of any investment in the securities of the Company should be independently evaluated
and any entity or person considering such an investment is advised to obtain independent legal, tax, accounting, financial, credit and or any other related advice prior to making an investment.

FORWARD LOOKING INFORMATION. Certain statements in this presentation (including, without limitation, the strategic growth initiatives and the investment thesis information cited within this
presentation) may constitute “forward-looking information” within the meaning of applicable securities laws that involve known and unknown risks, uncertainties and other factors that may cause
actual results, performance or achievements or industry results to be materially different from any future results, performance or achievements or industry results expressed or implied by such
forward-looking information. Forward-looking information is identified by the use of terms and phrases such as “anticipate”, “believe”, “could”, “estimate”, “expect”, “intend”, “may”, “plan”, “predict”,
“project”, “will”, “would”, and similar terms and phrases, including references to assumptions. Such information may involve, but is not limited to, comments with respect to strategies, expectations,
planned operations or future actions. Forward-looking information in this presentation includes, without limitation, statements with respect to: anticipated financial results, new product introductions,
the expansion of partnerships, estimates regarding the growth of utility customers, the conversion of backlog and the continuing impact of secular drivers on Tantalus’ industry.

The forecasts and projections that make up the forward-looking information in this presentation are based on management’s expectations and assumptions regarding historical trends, current
conditions and expected future developments. The forward-looking information in this presentation is subject to risks, uncertainties and other factors that could cause actual results to differ materially
from historical results or results anticipated by the forward-looking information. The factors which could cause results to differ from current expectations include, but are not limited to: economic and
political uncertainty, especially due to the COVID-19 pandemic; risks involved in developing products and integrating them with third-party products and services; market acceptance of the Company’s
products and services; technological change; lengthy sales cycle; management of growth and expansion; dependence upon key personnel and hiring; competition; the Company not adequately
protecting its intellectual property; risks related to product defects and product liability; and, currency exchange rate risk.

Although Company has attempted to identify factors that would cause actual actions, events or results to differ materially from those disclosed in the forward-looking information, there may be other
factors that cause actions, events or results not to be as anticipated, estimated or intended, including those risks and uncertainties discussed in the Company’s materials filed with the Canadian securities
regulatory authorities from time to time, available under the Company’s profile on SEDAR at www.sedar.com. Also, many of the factors are beyond the control of the Company. Accordingly, readers
should not place undue reliance on forward-looking information. The forward-looking information is made as of the date of this presentation, and the Company assumes no obligation to publicly update
or revise such forward-looking information to reflect new information, subsequent or otherwise, except as may be required by applicable securities law. The forward-looking information contained in
this presentation is expressly qualified in its entirety by this cautionary statement.

                                                                                                                                                                                                              2
Disclaimer
GAAP and U.S. GAAP. The Company prepares its financial statements in accordance with Canadian generally accepted accounting principles (“GAAP”) applicable to publicly accountable enterprises
(which are International Financial Reporting Standards as issued by the International Accounting Standards Board (IFRS)). Financial information of the Company in respect of periods prior to 2017 are
prepared in accordance with U.S. generally accepted accounting principles, which differs in certain material respects from GAAP.

NON-GAAP MEASURES. This presentation makes reference to certain non-GAAP financial measures. These non- GAAP financial measures are not recognized measures under GAAP, do not have a
standardized meaning prescribed by GAAP, and are therefore unlikely to be comparable to similar measures presented by other publicly traded companies, and should not be construed as an alternative
to other financial measures determined in accordance with GAAP. Rather, these financial measures are provided as additional information to complement GAAP financial measures by providing further
understanding of operations of the Company from management’s perspective. Accordingly, non-GAAP financial measures should never be considered in isolation nor as a substitute to using net income
as a measure of profitability or as an alternative to the GAAP statements. Management presents non-GAAP financial measures, specifically EBITDA and EBITDA Margin, as it believes these
supplementary disclosures provide useful additional information related to the operating results and financial condition of the Company and uses these measures of financial performance and financial
condition as a supplement to the consolidated statements of income and statements of financial position of the Company. The definitions of the non-GAAP measures contained in this presentation are as
follows: (i) “EBITDA” means earnings before interest, taxes, depreciation and amortization with adjustments for stock based compensation expense and non-recurring non-core business expenses; and
(ii) “EBITDA Margin” means EBITDA as a percentage of revenue. Please refer to the Company’s Management’s Discussion and Analysis for the years ended December 31, 2019, December 31, 2018, and
December 31, 2017, and the three and nine month periods ended September 30, 2020 and September 30, 2019 for reconciliations of such non-GAAP measures to GAAP measures.

THIRD PARTY INFORMATION. Certain information contained in this presentation includes market and industry data that has been obtained from or is based upon estimates derived from third party
sources, including industry publications, reports and websites. Third party sources generally state that the information contained therein has been obtained from sources believed to be reliable, but
there is no assurance or guarantee as to the accuracy or completeness of included data. Although the data is believed to be reliable, neither the Company nor its agents have independently verified the
accuracy, currency or completeness of any of the information from third party sources referred to in this presentation or ascertained from the underlying economic assumptions relied upon by such
sources. The Company and its agents hereby disclaim any responsibility or liability whatsoever in respect of any third-party sources of market and industry data or information.

CURRENCY. References in this presentation to “US$” and “C$” are to United States dollars and Canadian dollars, respectively. The Company presents its financial statements in US$.

                                                                                                                                                                                                     3
Experienced Management and Board
                Disciplined and cohesive team of professionals capable of leading Tantalus forward

                   Tantalus Leadership                                                                  Overview of Tantalus
                                                                                 History                 • 30+ year history as a smart grid leader
                                                                                                         • Transforming 185+ utilities and communities
                                                                                 Transaction             • Commenced trading on the TSX-V on 2/9/21
Management                                                                                               • Ticker: GRID
                                                                                                         • Concurrent financing of C$10M
                                                                                 Current Market Cap      • Attractively valued relative to peers
              PETER LONDA     DERMOT O’LEARY      GEORGE REZNIK
              CEO & BOARD          COO                CFO
                MEMBER
                                                                                 Directors / Officers    • Directors / Officers own ~3.1% of the company

                                                                                 Major Investors

Board

             LAURA FORMUSA   DR. FRANCIS HARVEY    JOHN MCEWEN      TOM LISTON
                 CHAIR         BOARD MEMBER       BOARD MEMBER    BOARD MEMBER

                                                                                                                                                         4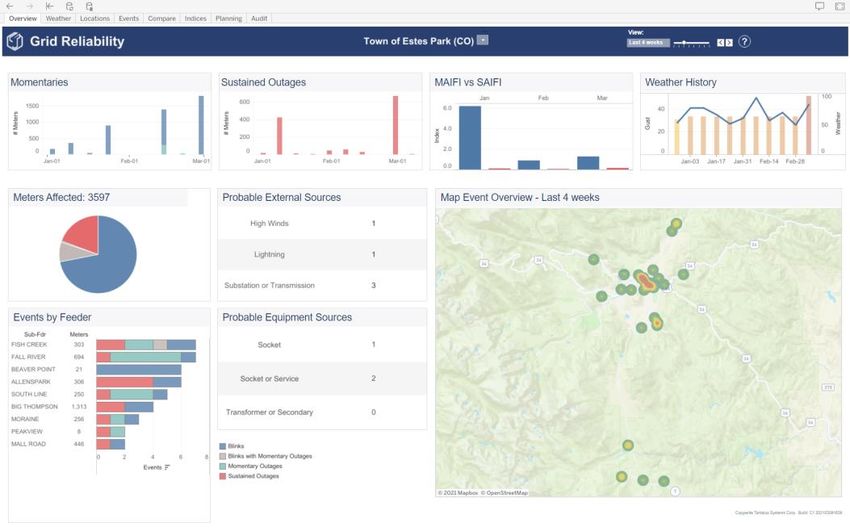
Tantalus: Purpose-Built. Purpose-Driven.
  Improving the efficiency, reliability and sustainability of the utilities we serve

     TARGET               SMART GRID             SOFTWARE &              SOLUTIONS
     MARKET                                       ANALYTICS
   We pursue the         Deploying an IoT      Leverage an edge-       Advanced Metering
 public power and        communications        computing platform      Infrastructure (AMI)
electric cooperative      network to over      to deliver predictive
  utility industry in     185+ utilities to      insights through      Load Management
   North America         access data from      enterprise software      Grid Optimization
                        meters, load control     applications and
                           switches, grid         data analytics           Smart City
                          equipment and                                   Applications
                          lighting fixtures

                                                                                              5
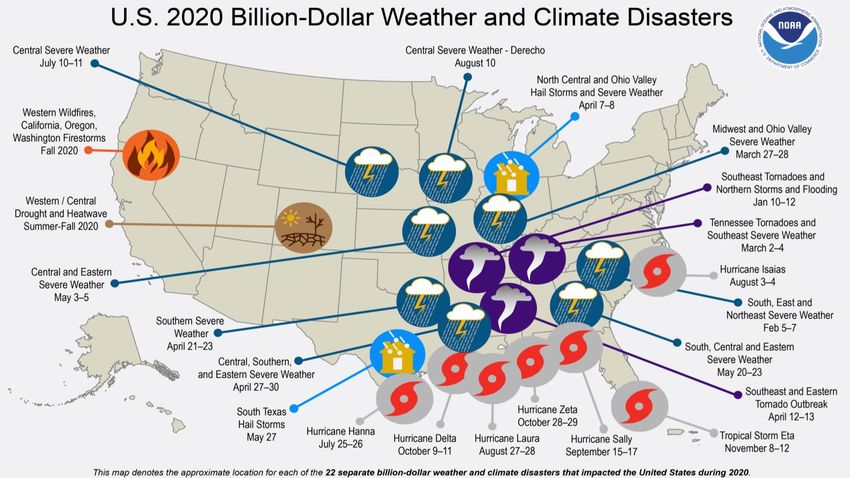
Three Key Issues That Are Changing the Landscape for Utilities
   Distribution grids are unprepared to adapt and deliver reliable and sustainable services

Extreme Weather                 Consumer Behavior                   Aging Infrastructure

                                                                                              6
Three Key Issues That Are Changing the Landscape for Utilities
    Distribution grids are unprepared to adapt and deliver reliable and sustainable services

Extreme Weather
  Storm damage and
  demand spikes are
 leading to disruptive
       outages

                                                                                               7
Three Key Issues That Are Changing the Landscape for Utilities
      Distribution grids are unprepared to adapt and deliver reliable and sustainable services

Consumer Behavior
Environmental impact and
reliability expectations are
     translating into the
 adoption of renewables
  and distributed energy
          resources

                                                                                                 8
Three Key Issues That Are Changing the Landscape for Utilities
      Distribution grids are unprepared to adapt and deliver reliable and sustainable services

Aging Infrastructure
   Equipment is at, or
 exceeding, expected life
   and not designed to
                                  Legacy Power Grid                        Integrated Smart Grid
support a multi-directional       One-way power flow                     Multi-directional power flow
       power flow

                                                                                                        9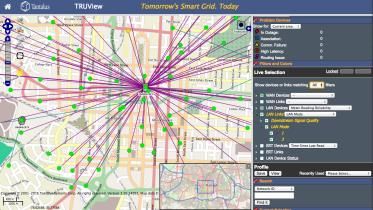
Meaningful and Sizeable Market Opportunity

 Substantial Investment in Grid Infrastructure                                                                % of Utility Executives in the US Acknowledging
                                                                                                                         the Need to Invest in the Grid
          G20 Global Infrastructure Outlook
          Global electric infrastructure investment through
          2040 is estimated at US$28 trillion, of which
                                                                                                                                                           90%
          US$12 trillion will be invested in the US
                                                                                                                                      Annual Smart Grid Investments
                 Total
                 3,397                                                                                                      Estimated to reach US$91 billion/year by 2025

                         Source: G20 Global Infrastructure Outlook Study                                                       Source: Accenture Study, May 13, 2020 / Research and Markets Smart Grid Report

Number of Electricity Utility Providers in the US                                                              Number of Electricity End Customers in the US
                                                           Utility Type                Count                                                                                   Utility Type                 Count
                 5%                                        Municipal                   2,006                                           5%                                      Investor-Owned                   104M
           10%                                                                                                                 13%
                                                           Co-ops                        873                                                                                   Municipal                        22M

                                                           Other                         336                                                                                   Co-ops                           20M

                                                           Investor-Owned                182                             14%                                                   Other                             7M
    26%
                                 59%
                                                                                                                                                     68%

                 Total                                                                                                                 Total
                                                             US Target Market:                                                                                                  US Target Coverage:
                 3,397                                                                                                                 153M
                                                              ~2,900 Utilities                                                                                                  42 Million End Users

                                            Sources: U.S. Energy Information Administration Report (2017), America’s Electric Cooperatives: 2017 Fact Sheet.                                                           10
Purpose-Built Solutions Transform Electric Distribution Grids
One Smart Grid network: Multiple applications being deployed
Next-Generation AMI Load Management / DER Integration Grid Transformation
IoT Smart Grid Network Distribution Automation / Grid Smart City Applications
Optimization
11Purpose-Built: TUNet KPI Dashboard
Configurable dashboard that is role-based
12Purpose Built: Access to Granular Data
Granular details providing consumption and power quality data
• Access to account
information to
troubleshoot inbound
calls or billing issues
• Detailed power-quality
data to pin-point
reliability issues and
required investments
13Data Analytics to Pinpoint the Location and Cause of Outages
Our Solutions Help Build the Sustainable Utility of the Future
           Purpose-Driven to address the immediate and long-term needs of the utilities we support

       Delivery                 Integration                  Resiliency                 Consumers
  Safely and reliably             Embrace the             Proactively identify       Actively engage with
deliver electricity, water    integration of solar,        vulnerabilities to           customers with
and gas with next-gen        storage and EVs as a        mitigate outages and         analytics, mobile
     AMI solutions           controllable-resource        prepare for Mother           applications and
                                                                Nature               enhanced customer
                                                                                            service
                                                                                                      15
Tantalus: Prosperity Grounded by Purpose
15+ Years 4
Establishing
Consecutive years
extended
of positive EBITDA
relationship with
185+ utilities 98.9% 30%+
Customer Revenue generated
Utilities within retention rate over
our growing from software,
a 30 year history services and M&S
user community (not annual) 1.5+ contracts
3 Million Million
Endpoints deployed
Endpoints not
between through
yet deployed
2020 80+ at captured 30+
Multi-commodity accounts
utilities BILLION
responsible for Meter reads
electricity, water delivered per
and/or gas year
16Revenue Lifecycle of a Utility
Opportunities to generate recurring revenue from utilities through a multi-decade relationship
Recurring Software Maintenance & SaaS Data Analytics Licenses
Software
TUNet INSIGHT Software License
Repeatable Annual Technical Support Agreements
Professional
Services Deployment / Project Management Support
New Revenue Streams from Additional Applications (SLC, TLMS & DA)
ERT: Migration from AMR
Connected
Devices Rip / Replace Meters
Smart Grid Network infrastructure Connected Device Upgrades
1-5 6 - 10 10 – 15+
Years
17Three-Pronged Approach to Deliver Sustainable Growth
Identified paths to deliver compounding growth moving forward
Strategic Growth through
Accretive Mergers &
R&D Initiatives to Expand Solutions and Acquisitions
Monetize the Data We Collect Leverage existing IoT network to
support Smart City initiatives
Deliver power quality data analytics to increase
Scaling Our Base of SaaS revenue contributions Expand software solutions to improve
185+ Utilities to Connect consumer engagement and power
More Endpoints Install FTTH infrastructure in anticipation of DER
quality data analytics
integration and management
Grow our user community to access Regional expansion through
more connected devices Expand presence across Canada and the
consolidation
Caribbean Basin
Accelerate deployments with
existing customers Expand support to water departments / utilities at
our existing 90 multi-commodity utilities
Increase hosted and managed
service offerings
SHORT TERM MEDIUM TERM LONG TERM 18Recent Announcements Tied to R&D Growth Initiatives
Purpose-built solutions that position Tantalus for accelerated growth
Next-Gen Fiber-to-the-Home Gateway TUNet Grid Reliability Data Analytics
• Announced March 18th • Announced March 24th
• Enables DER integration at the premise and • Pinpoints where utilities need to make upgrades
helps utilities resolve the digital divide to their existing infrastructure investments and
prepare for storms
19Strong, Proven Historical Performance
Track record of demonstrating growth while improving Gross and EBITDA margins
Figures in US$ MM
2013 – 2016 US GAAP Figures
2017 – 2019 IFRS Figures
Software and Services
11% 12% 19% 27% 30% 29% 30%
Revenue (%)
Gross Profit (%) 33% 44% 44% 43% 49% 44% 44%
Adjusted EBITDA (%)(1) N.M. N.M. N.M. N.M. 4% 6% 7%
(1) See “Non-U.S. GAAP Measures” and “Non-IFRS Measures” in the Disclaimers.
20Strong Performance in Q4, 2020
Provided guidance of unaudited financial information on March 8, 2021
Key Highlights:
• Q4 Revenue:
‒ US$9.0 – 9.5M as compared to $10M for the same period in 2019
• Gross Profit:
‒ Q4: Estimated at 52% as compared to 46% for the same period in 2019
‒ 2020: Estimated at 49% as compared to 44% for the same period in 2019
• EBITDA: 4th consecutive year of positive EBITDA
• New Utilities: Secured 20 new customers
• Key Deliverables:
‒ Planning launch of next-generation FTTH solution
‒ Planning launch of first predictive analytics tool
‒ Expansion of existing electric and water meter integrations
21Compelling Investment Thesis
Reduce the grid’s environmental impact while delivering societal and economic benefits
to utilities and the communities they serve. . .
OPPORTUNITY PROVEN GROWTH TEAM
Transforming the Growing customer Identified paths to Experienced team
distribution grid is a base of 185+ increase the of professionals
long-term initiative utilities with a track contributions of with a track record
by utilities and will record of recurring revenue of delivering results
require massive expanding our user through R&D
investments community initiatives and
annually strategic M&A
22Q&A www.tantalus.com @TantalusCorp larmstrong@tantalus.com https://linkedin.com/company/tantalus
(1)
                                                Comparable Companies
(US$ MM unless otherwise stated)                                      TEV/Revenue       TEV/EBITDA        Revenue Growth     EBITDA Margin
Company                                         Mkt. Cap   TEV      CY2020E CY2021E CY2020E CY2021E '19A - '20E '20E - '21E CY2020E CY2021E
IoT
Garmin Ltd.                                       22,444   19,790      4.9x     4.6x    18.3x    16.7x       7%        8%      27%      27%
Zebra Technologies Corporation                    21,184   22,872      5.2x     4.7x    26.0x    22.1x      (2%)      10%      20%      21%
Trimble Inc.                                      16,942   18,541      6.0x     5.6x    24.8x    23.1x      (5%)       7%      24%      24%
Sensata Technologies Holding plc                   8,713   11,102      3.7x     3.2x    16.4x    12.9x     (12%)      16%      22%      24%
Sierra Wireless, Inc.                                696      689      1.4x     1.4x     n.a.     nmf.     (31%)      (3%)     (6%)      1%
ORBCOMM Inc.                                         612      803      3.3x     3.0x    14.9x    12.6x      (9%)       9%      22%      24%
CalAmp Corp.                                         373      492      1.5x     1.5x    18.5x    13.9x      (8%)       0%       8%      11%
MiX Telematics Limited                               304      270      2.0x     2.2x     7.5x     9.4x     (12%)      (7%)     27%      23%
mCloud Technologies Corp.                             45       73      3.7x     1.7x     n.a.    20.6x      39%      124%     (35%)      8%
Mean                                                                   3.5x     3.1x    18.0x    16.4x      (4%)      18%      12%      18%

Smart Grid
Xylem Inc.                                        17,508   19,068      4.0x     3.7x    25.1x    20.6x      (9%)       7%      19%      16%
SolarEdge Technologies, Inc.                      15,405   14,821     10.2x     8.5x    60.6x    45.3x       2%       19%      20%      17%
Itron, Inc.                                        3,667    4,512      2.0x     1.9x    26.6x    19.6x     (11%)       5%      11%       8%
Badger Meter, Inc.                                 2,738    2,666      6.4x     5.7x    29.4x    27.4x      (2%)      12%      20%      22%
Landis+Gyr Group AG                                2,029    2,136      1.4x     1.4x    12.5x    13.9x     (13%)      (1%)     13%      11%
Smart Metering Systems plc                         1,064    1,008      7.3x     7.1x    15.1x    14.2x      (9%)       3%      50%      48%
American Superconductor Corporation                  705      657      7.8x     6.9x     n.a.     n.a.      40%       13%     (28%)    (14%)
Mean                                                                   5.6x     5.0x    28.2x    23.5x      (0%)       8%      15%      15%
Blended Mean                                                           4.5x     4.1x    23.1x    20.0x      (2%)      13%      14%      17%
(1) Source: Capital IQ as at February 3, 2021

                                                                                                                                               24
GRID: Capitalization Summary and IR Initiatives
Based on recent share price and market capitalization
TSXV: GRID Transition into the Public Markets
Shares % • Historical financials available on website and SEDAR
Basic Shares Outstanding 38,859,051 83.1%
Stock Options • Upcoming Financial Reporting:
Granted 4,860,168 10.4% ‒ 2020 Audit to be filed in April, 2021
Available 2,911,642 6.2%
Broker Warrants (1) 124,982 0.3% ‒ Q1 ‘21 Financials to be filed in May, 2021
Fully-Diluted 46,755,843 100.0% • Investor Relations: Adelaide Capital
Key Holdings • Market Maker: ITG
Officers & Directors 1,467,743 3.14% • Research Coverage: Pending
Notes: • Valuation:
(1) Issued at $2.25. Exp January, 2023. ‒ Currently trading at approx. 2x ‘20 revenue
‒ Smart Grid Comps trading above 5x ‘20 revenue
25You can also read