The Prebiotic Potential and Molecular Diversity of Space Environments
←
→
Page content transcription
If your browser does not render page correctly, please read the page content below
The Prebiotic Potential and Molecular Diversity
of Space Environments
Past Projects and Future Possibilities with SOFIA

                                      Duncan V. Mifsud1,2 and Sergio Ioppolo3

                  1   Centre for Astrophysics and Planetary Science, University of Kent, United Kingdom
             2   Atomic and Molecular Physics Laboratory, Atomki Institute for Nuclear Research, Hungary
  3   School of Electronic Engineering and Computer Science, Queen Mary University of London, United Kingdom

                                               January 19, 2022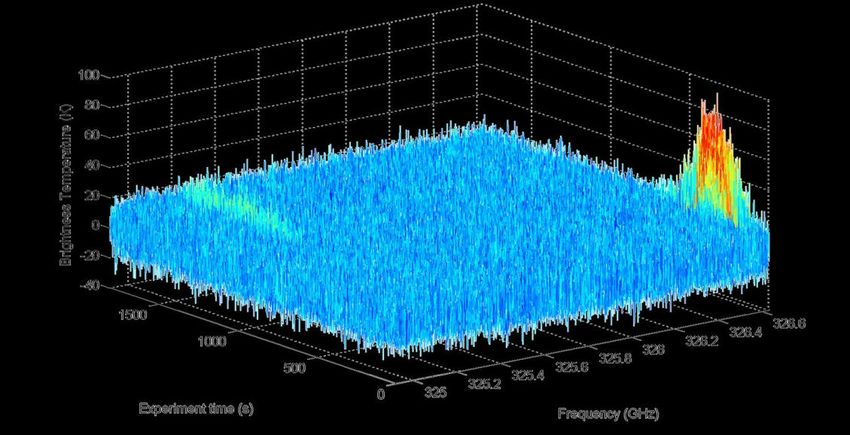
2

The Early Years of Astrochemistry (1922-1942)

                                                Feldman, Can. J. Phys. 79, 89.
3
Modern Astrochemistry (1963 – Present)
Molecules are Everywhere!

                                                                         High Complexity
                                         Biologically
                                         Relevant

         Mineralogically
         Relevant

                                                   McGuire, Astrophys. J. Suppl. accepted.
4

Cosmic Chemistry Cycle

       Öberg, Chem. Rev. 116, 9631.   Öberg et al., Astrophys. J. 716, 825.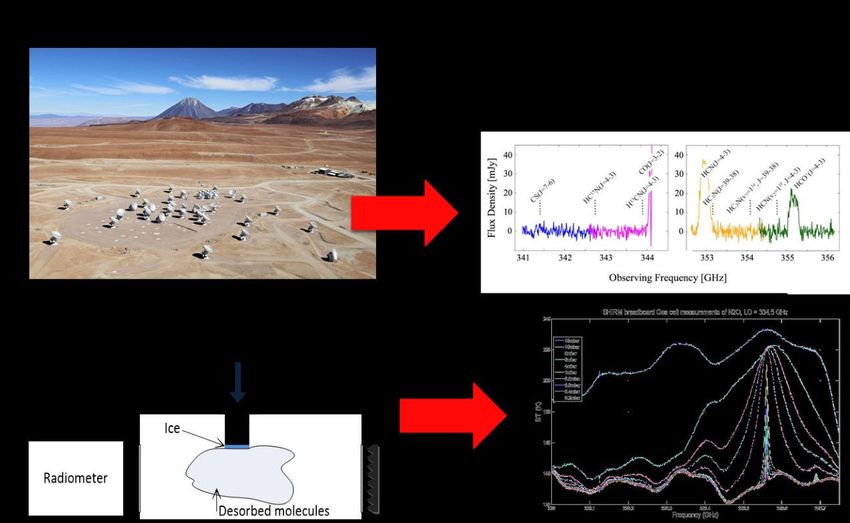
5

Ices – the Factories of Interstellar Molecular Complexity!

         Herczku et al., Rev. Sci. Instrum. 92, 084501.
                                                          Boogert et al., Annu. Rev. Astron. Astrophys. 53, 541.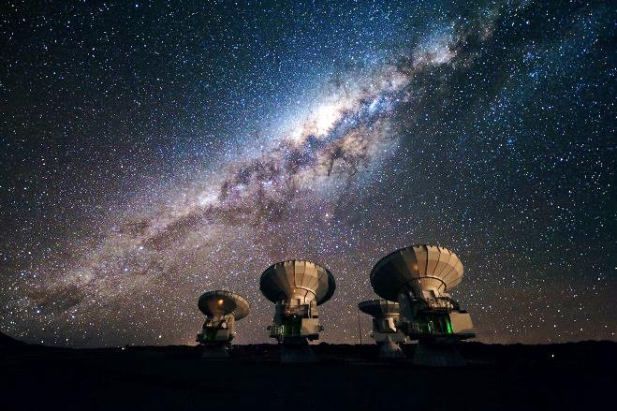
6

Constraining the Chemical Compositions of Icy Mantles

                                    Boogert et al., Annu. Rev. Astron. Astrophys. 53, 541.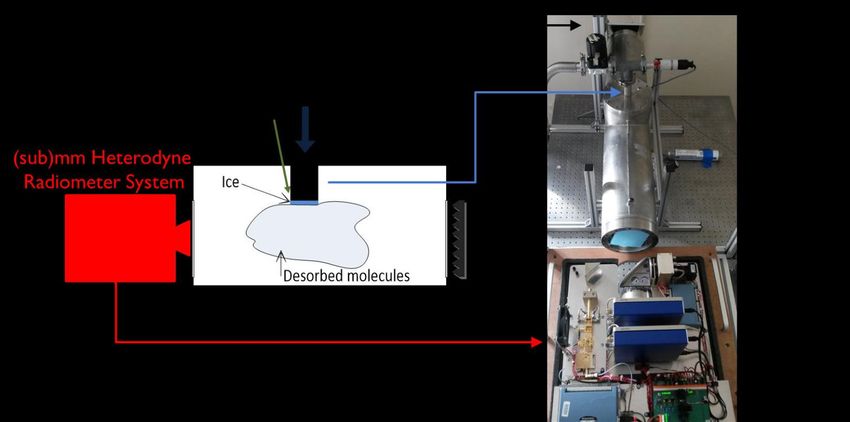
7

Constraining the Chemical Compositions of Icy Mantles

• Several telescopes available to collect mid-IR and THz spectra

• Laboratory spectral data needed to interpret observations

       Image credits: NASA, USRA (Universities Space Research Association), and L-3 Communications Integrated Systems
8

 Advantages of THz Spectroscopy Compared to Mid-IR

• Mid-IR
  • Only intra-molecular vibrational modes can be observed
  • Different molecules sharing functional moieties may be hard to identify

• THz
   • Lower energy vibrations are probed, including inter-molecular ones
   • Technique is sensitive to long-range interactions between molecules
     and ice structure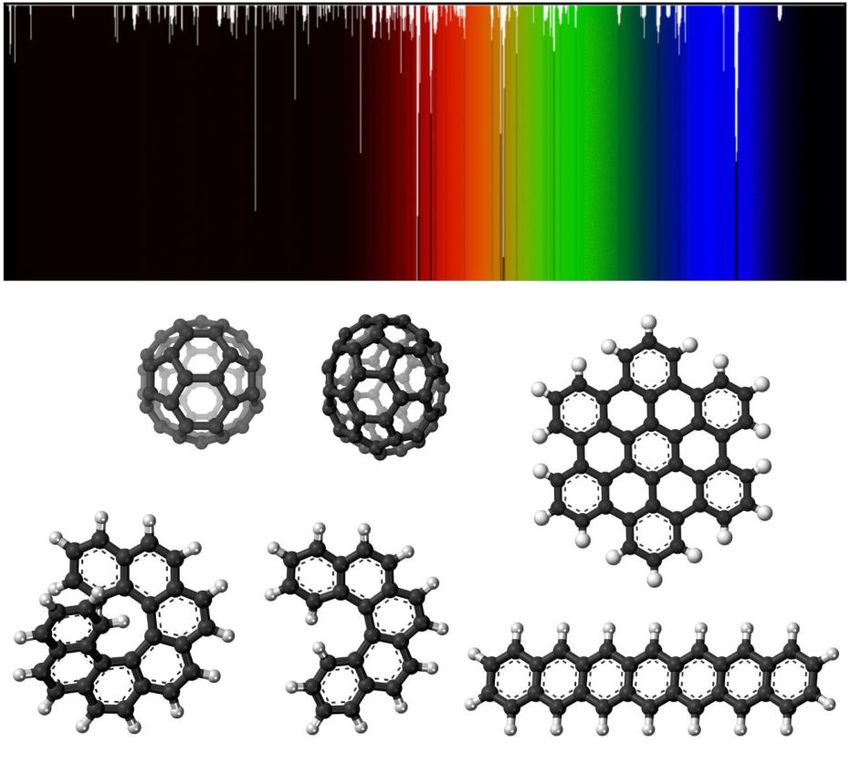
9

 Advantages of THz Spectroscopy Compared to Mid-IR

• Mid-IR
  • Transitions can only be observed in absorption
  • A mid-IR source (e.g., a YSO) behind the line of sight is needed, greatly
     reducing the number of astronomical settings that may be studied

• THz
   • Low energetic transitions mean that at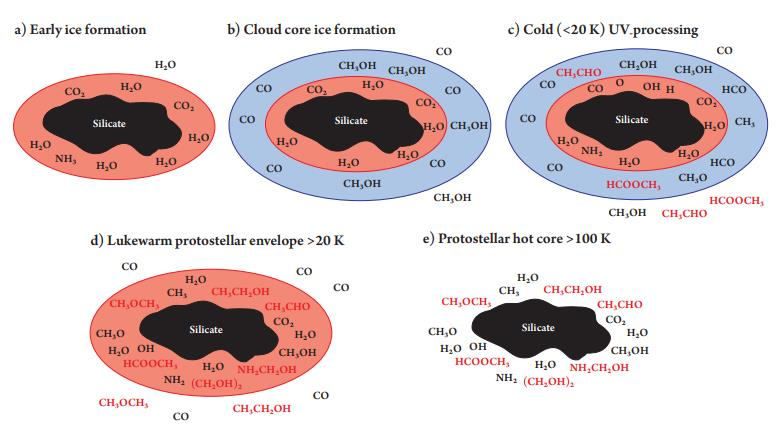
10
Early Forays into Laboratory Far-IR Spectroscopy

   H2O
                                                        H2O (x.5)
                                                                      • Noticeable
   CH3OH (x3)
                                                                        differences in
                                                        CH3OH (x.6)
                                                                        the spectra of
                                                                        amorphous
                                                                        (left) and
                                                                        crystalline
                                                                        (right) ices.

                                                                      • Indication of
                                                                        the usefulness
                                                                        of THz
                Moore and Hudson, Radiat. Phys. Chem. 45, 779.
                                                                        spectroscopy.
11
Time-Domain (TD) THz Spectroscopy in the Laboratory
An Example from Caltech
Collect a signal in the time domain……and Fourier transform numerically
Allodi et al., Phys. Chem. Chem. Phys. 16, 3442.12 Time-Domain (TD) THz Spectroscopy in the Laboratory An Example from Caltech Laboratory TD-THz spectroscopy can be broken down into two very basic concepts: 99% • THz Pulse Generation 1% • via two-colour plasma • THz Detection • via electro-optical sampling
13
Time-Domain (TD) THz Spectroscopy in the Laboratory
An Example from Caltech

THz Pulse Generation

•   BBO – frequency double amplified 800 nm output to 400 nm
•   Calcite – compensate for phase delay between 400 and 800 nm pulses
•   Dual-Band Wave-Plate – align polarisations
•   Focus 400 and residual 800 nm light to form plasma in air

Mechanism:
• 800 nm light generates plasma
• 400 nm light accelerates electrons in plasma
• Accelerated electrons emit THz pulses
14
Time-Domain (TD) THz Spectroscopy in the Laboratory
An Example from Caltech

THz Detection

• THz beams are focused down onto a crystal (ZnTe
  or GaP)
• THz pulse causes a rotation in the polarisation of
  the probe beam in the crystal (Pockels Effect)
• Magnitude of polarisation change is linear to
  applied THz electric field (so measure THz electric
  field not intensity)
• A pair of balanced detectors sees a difference in
  signal
15
Time-Domain (TD) THz Spectroscopy in the Laboratory
An Example from Caltech
Opto-Mechanical Delay

• Allows the entire THz waveform to be stepped through
• The electric field is measured as a function of delay time
• FFT of the temporal waves gives spectral distribution in the frequency
  domain.
                                                         ZnTe crystal generation/detection
99%                                                      Plasma generation/ZnTe detection
      1%
                                                         Plasma generation/GaP detection
16
Time-Domain (TD) THz Spectroscopy in the Laboratory
An Example from Caltech
Ioppolo et al., Faraday
Discuss. 168, 461.17
THz Spectra of Astrophysical Ice Analogues
Comparisons with Mid-IR Spectra for H2O
• Four absorptions in the
H2O mid-IR spectrum
• Peak appearances vary
due to temperature and
phase.
• THz spectra contains
many weak features.
• Four strong absorptions
in crystalline H2O.
Ioppolo et al., Faraday Discuss. 168, 461.18
THz Spectra of Astrophysical Ice Analogues
Comparisons with Mid-IR Spectra for Other Molecules
Ioppolo et al., Faraday Discuss. 168, 461.19
THz Spectra of Astrophysical Ice Analogues
The Temperature Effect
• THz peaks in crystalline ices are stronger, sharper, and blue-
shifted at lower temperatures.
• Peak shifting and broadening results from the anharmonicity
of vibrational potential.
• Hot bands are red-shifted due to decrease in the spacing
between vibrational levels.
• At low temperature, only lower vibrational states are
populated and so bands are blue-shifted and sharper.
• Different vibrational minima corresponding to different
crystal structures will exhibit different bands.
• Intramolecular torsional modes may be apparent.
Ioppolo et al., Faraday Discuss. 168, 461.20
THz Spectra of Astrophysical Ice Analogues
The Composition Effect
• Contaminant species may
alter the intermolecular H-
bonding networks in ices.
• If the peaks of a contaminant
affect those of the bulk ice
independent of contaminant
concentration, and these
peaks also grow
proportionally to their
concentration, then
segregation may have
occurred (e.g., CO2, CH3CHO).
Allodi et al., Phys. Chem. Chem. Phys. 16, 3442.
Ioppolo et al., Faraday Discuss. 168, 461.21
THz Spectra of Astrophysical Ice Analogues
The Composition Effect
Thermal processing of mixed CH3OH:CO2 1:1 ice
McGuire et al., Phys. Chem. Chem. Phys. 18, 20199.
c-CH3OH
Ann. to 140 K, 10 K
Ann. to 120 K, 10 K
Ann. to 90 K, 10 K
Spectrum @ 60 K
Spectrum @ 30 K
c-CO2 a-CH OH Deposited @ 10 K
322
THz Spectra of Astrophysical Ice Analogues
The Composition Effect
10:1 1:10
McGuire et al., Phys. Chem.
Chem. Phys. 18, 20199.
1:1
CH3OH >>23 Key Points of THz Laboratory Astrochemistry • THz spectroscopy offers an additional and complementary analytical tool to mid-IR spectroscopy. • THz spectroscopy is not limited to a particular line of sight, offering a wider choice of observable targets. • THz spectroscopy is sensitive to the temperature, structure, and chemical composition of an astrophysical ice. • Further laboratory spectra must be acquired to aid in deciphering astrophysical observations.
24
Detection of Ices in Protoplanetary Disks
ISO Data - Herbig Ae Stars HD142527

                                      Malfait et al. (1999)
             Cryst. H2O
25
Detection of Trans-Neptunian Ices
PACS Data - T Tauri Stars
with water ice
with silicates and graphite
McClure, PhD Thesis (2014)26 A Missed Opportunity SPace Infrared telescope for Cosmology and Astrophysics
27
A Missed Opportunity
SPace Infrared telescope for Cosmology and Astrophysics
28
Potential Detection of COMs in the THz
29
CO2 - Amorphous vs crystalline Ice

                               Crystalline

                   Amorphous
30
SOFIA Observations Cycle 3
50 minutes of integration time31
SOFIA Observations Cycle 3
50 minutes of integration time
4 THz 3 THz32
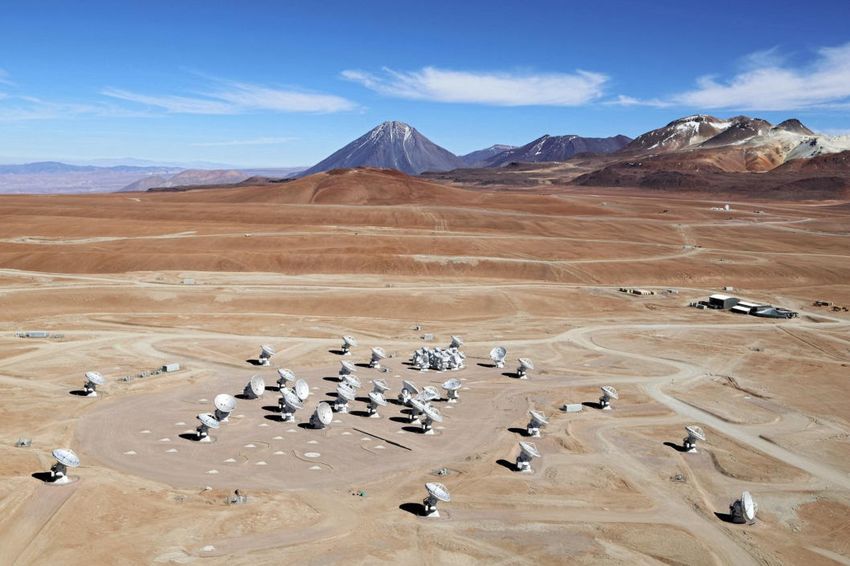
ALMA - Atacama Large Millimeter/submillimeter Array
CREDIT: B. Saxton, NRAO/NSF
CREDIT: ESO33
ALMA - Atacama Large Millimeter/submillimeter Array
CREDIT: P. Salomé, Paris Obs.
K. Öberg, Harvard
CREDIT: ESO34 ALMA - Atacama Large Millimeter/submillimeter Array Emission Spectroscopy
35
THz Desorption Emission Spectroscopy

                                       Auriacombe et al., MNRAS in prep.
36
THz Desorption Emission Spectroscopy
Auriacombe et al., MNRAS in prep.37
THz Desorption Emission Spectroscopy
Auriacombe et al., MNRAS in prep.38
THz Desorption Emission Spectroscopy
Target Molecules
Experiment: Molecules Frequency Line
Water 325,15 GHz
Methanol 326 GHz,…
Nitrous Oxide (N2O) 326,55 GHz39
THz Desorption Emission Spectroscopy
N2O Desorption
H2O Desorption
H2O Desorption N2O Desorption
▪ Start:~ 230 K ▪ Start: ~ 90 K
▪ Peak: ~ 250 K ▪ Peak: ~ 130 K40 Final Remarks • Need for airborne or spaceborne observatory instruments with appropriate bandwidth, resolution, and sensitivity. • THz ice spectroscopy has the potential to identify the presence and temperature of COMs in interstellar ices and to characterize physics and chemistry of the ISM. • THz Desorption Emission Spectroscopy can be used to study thermal desorption of COMs. More technology development needed to study non-thermal processes.
41
Thanks for your attention!
Any questions?
Key Papers:
• Allodi et al. (2014), Phys. Chem. Chem. Phys. 16, 3442
• Ioppolo et al. (2016), Faraday Discuss. 168, 461
• McGuire et al. (2016), Phys. Chem. Chem. Phys. 18, 20199
• Mifsud et al. (2021), Front. Astron. Space Sci. 8, 757619
                         Thanks to Collaborators at:
You can also read