The Economic and Fiscal Impacts of the Distilling Industry in Kentucky, 2021
←
→
Page content transcription
If your browser does not render page correctly, please read the page content below
The Economic and Fiscal Impacts of the
 Distilling Industry in Kentucky, 2021

                   Prepared for the
          Kentucky Distillers’ Association

                         by
                 Paul Coomes, Ph.D.
             Economic Consultant, and
           Emeritus Professor of Economics
               University of Louisville

                         and

                     Barry Kornstein
                 Economic Consultants
           with assistance from Rob Monsma

                  January 19, 2022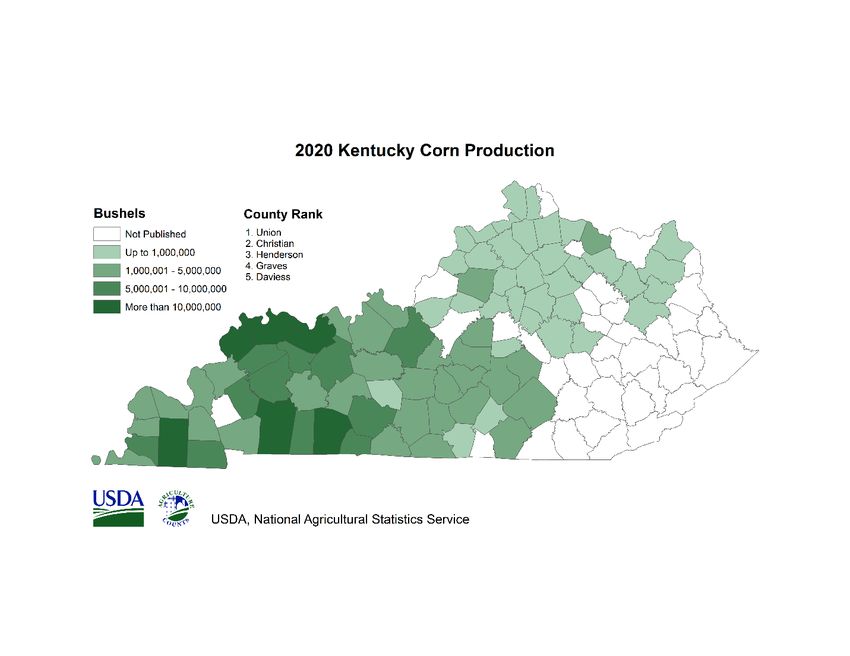
CONTENTS
EXECUTIVE SUMMARY ....................................................................................................... 1

THE SIZE OF THE DISTILLING INDUSTRY IN KENTUCKY ..................................................... 5
       Distilleries by location ............................................................................................ 5
       Bourbon production and inventory ........................................................................ 6
       Employment and payrolls ....................................................................................... 8
       Exports .................................................................................................................... 9
       Distilling’s share of Kentucky and national economic activity ................................ 9
       Impact of Covid-19 ............................................................................................... 12
       Recent and planned investments by Kentucky distillers ...................................... 14
       Barrel production ................................................................................................. 16
       Grain purchases .................................................................................................... 17
       Other physical inputs ............................................................................................ 17

ECONOMIC IMPACTS ....................................................................................................... 18
     Employment, output, payroll ............................................................................... 18
     Impact of construction ......................................................................................... 20
     Impact of equipment investment ......................................................................... 22
     Average annual impact from planned investments ............................................. 22

TAXATION AND FISCAL IMPACTS .................................................................................... 24
      Property taxes ...................................................................................................... 26
      Tax revenues related to payrolls of distilleries ..................................................... 29
      State licenses and fees ......................................................................................... 30
      Local licenses and fees ......................................................................................... 30
      Alcohol consumption taxes .................................................................................. 31
      Tax impacts over time .......................................................................................... 33

CONCLUSION .................................................................................................................... 36

APPENDICES
A. Federal industrial classification codes relevant to the distilling industry .................... 38
B. Licensed distillers in Kentucky ...................................................................................... 39
C. Measures of employment and payroll for Kentucky’s distilling industry ..................... 44
D. National growth in distilling establishments over the last decade .............................. 53
E. Exports of Kentucky distilled spirits .............................................................................. 55
F. The distilling industry’s linkages to other industries .................................................... 58
G. Grain usage by Kentucky distillers ............................................................................... 62
H. Economic multipliers.................................................................................................... 65
I. Wholesale tax rates on alcohol, by state ....................................................................... 69
Executive Summary

D            istilling in Kentucky continues its incredible two-decade growth wave. Almost every
             important economic measure is up over our prior studies – facilities, production,
             employment, payroll, investment, inventory, taxes generated.

There have been two headwinds for the industry since our last study, and both are now
receding. The decline in Bourbon exports is set to rebound now that the European Union has
suspended its retaliatory tariffs for three years – in sync with the United States’ reduction in
tariffs on steel and aluminum imports. And the Covid-19 pandemic hit the Bourbon tourism
industry hard in 2020; but 2021 saw a strong recovery at Kentucky Bourbon Trail® visitor
centers across the Commonwealth.

Kentucky produces and ages 95 percent of the Bourbon sold and consumed in the world.
Kentucky companies are also involved in distilling, bottling, packaging and shipping many
different kinds of distilled spirits (sometimes distilled elsewhere and brought to Kentucky
facilities for final processing). Nearly all distillers market their products outside of Kentucky and
the United States, making distilled spirits a major export industry for the Commonwealth.

The sales of distilled spirits support the wages, salaries and benefits of workers in the state’s
distilling industry, as well as those employed by suppliers. The dollars circulate further, as
employees spend their income in the regional economy, generating jobs and income in other
industries.

This is the sixth statewide economic study of the distilling industry that we have conducted for
the Kentucky Distillers’ Association (KDA) since 20091. Our first report identified 19 distilling
establishments in eight counties, directly supporting about 3,000 jobs. In 2021, we were able to
identify 95 establishments in 40 counties, employing approximately 6,000 people.

Those direct distilling jobs support many other jobs around Kentucky, due to supplier linkages
with other industries and to the spending and re-spending of employee payrolls in communities
around the state. We estimate that the total annual economic impact of the distilling industry is
22,540 jobs, with annual payroll of $1.23 billion, producing $8.94 billion of economic output.
This is an estimate of what would happen in the state in the event the distilling industry
disappeared from Kentucky.

1
    This study, finalized in 2021, primarily refers to economic and fiscal activity in 2020. Some of the data used are on
       a calendar year basis, and other data are on a July to June fiscal year basis. In all cases, we use the latest data
       available. The first study, released in and titled ‘2009’, primarily refers to activity in 2008.

       The Distilling Industry in Kentucky, 2021                                                                        1
Meanwhile, other states are taking notice of the distilling industry with now more than 2,200
distilleries operating in the other 49 states. Those states offer a variety of incentives and
privileges making it attractive to lure what was once a Kentucky dominated industry.

The current study updates and expands our five previous studies, offering an examination of
distilling industry growth, impact on other industries in Kentucky, and contribution to state and
local government tax revenues.

Among the most important and interesting findings are:

       The state database on licensed distillers reveals 95 distilling locations operated by 75
     companies in Kentucky as of 2021, with several more license applications in the pipeline.
     This is five times the number of distilleries documented in our original 2009 study, with
     most of the growth due to the emergence of craft distilleries. There are distilleries now in
     40 counties. While craft distilleries are distributed throughout the state, large “heritage”
     distilleries remain concentrated in the “amber triangle” region of Central Kentucky
     between Lexington, Bardstown and Louisville, but also as far away as Owensboro.

       Kentucky distillers produced 2.4 million barrels of Bourbon in 2020, and now have a
     record 10.3 million barrels stored in warehouses. Adding in brandy and other aging spirits
     brings the total barrel inventory to nearly 11 million.

       In 2020 there were approximately 6,000 people working directly in Kentucky’s distilled
     spirits industry, with annual wages and salaries of $602 million. Federal economic
     statistics indicate that over the last two decades, the number of distilling establishments
     in Kentucky tripled, with an 83 percent growth in employment, and a 250 percent growth
     in wages and salaries. For the first time, average annual pay per job surpassed $100,000.

       The full economic impact of the distilling industry includes the linked activity of suppliers
     and new household spending. In our original study, focused on 2008 activity, we
     estimated the total economic impact in Kentucky to be 9,848 jobs and $442 million in
     payroll. For 2020, we estimate that the total economic impact has grown to 22,540 jobs
     and $1.23 billion in payroll – more than double that of 12 years prior.

      The distilling industry in Kentucky has been rapidly adding jobs over the past two
     decades, while on net, the remainder of the state’s manufacturing industry has shed
     employment. However, due to the enormous rise of craft distilleries in other states,
     Kentucky’s national share of distilling jobs has slipped from 43 percent to 30 percent from
     2001 to 2020. Likewise, the state’s share of distilling jobs has slipped from 24 percent to 6

    The Distilling Industry in Kentucky, 2021                                                     2
percent in the last 20 years. Kentucky’s share of national distilling payroll has remained in the 45 to 50 percent range, due to the location of several major industry headquarters in the state. Kentucky distillers shipped $391 million of products abroad in 2020. The industry’s exports are dominated by whiskies, with Bourbon the main component. The noticeable decline in 2020 was due to the heavy retaliatory tariffs imposed on whiskey by the European Union and China, reducing Kentucky whiskey exports by $170 million. Other products exported by Kentucky distillers include brandy, liqueurs, cordials, vodka, rum, and gin. Our IMPLAN model shows the distilling industry stands out from others in terms of the unusually high tax burden as it relates to the portion of output, with taxes accounting for 21 cents per dollar of output. Only three other industries generate a higher tax share – wholesale petroleum, commercial fishing, and tobacco manufacturing – and all are much smaller than distilling in terms of Kentucky employment and payroll. The wine industry is taxed at 3.2 cents per dollar of output; breweries are taxed at 8.2 cents per dollar output. For most manufacturing sectors, the portion of each dollar of output that goes to taxes is less than a penny. The distilling industry is estimated to directly or indirectly be responsible for about $286 million in state and local tax payments in Kentucky annually. The total includes local and state property, taxes, local occupational taxes, and Kentucky state individual income and sales taxes. State government accounts for 80 percent of the total tax revenues, with 20 percent going to local government entities. Kentucky remains the only jurisdiction in the world that taxes aging spirits in the barrel, largely because in other states and countries it is viewed as a part of the production process. For 2021, the Kentucky Department of Revenue estimates local and state governments would collect $33.2 million in taxes on barrels aging in inventory, and that inventory is assessed at $4.4 billion. Another $10.4 million in property taxes were paid last year on distillers’ real estate and equipment. Kentucky distillers paid more than $1.8 billion in federal excise tax on alcohol production in 2020. That means the Commonwealth’s signature industry accounted for 22 percent of alcohol excise tax paid nationally, by far the largest share by any state. The value of real and tangible property owned by Kentucky distillers has quadrupled in the last decade, while the value of the distilled spirits inventory aging in barrels has nearly The Distilling Industry in Kentucky, 2021 3
tripled in that time. These increasing values mean distillers are paying considerably more
 in more real and tangible property taxes, resulting in a marked increase in impact of the
 distilling industry over that time.

   KDA members reported capital spending of $1.9 billion over the last five years, almost
 equally split between construction and other items, such as machinery, equipment, and
 furnishings. Moreover, they plan to spend $3.3 billion over the next five years for a total
 of $5.2 billion in capital investment over a 10-year period. Every KDA member, whether a
 large Heritage producer or a small Craft distiller, reported significant investments. This is
 by far the highest investment spending we have documented over our five studies since
 2009. NOTE: This capital spending number includes only the hard costs of construction and
 does not include the cost to distill, produce and age product, as some distilleries calculate
 for promotional purposes.

   Distilling continues to have the second-highest job multiplier across 329 manufacturing
 industries with activity in Kentucky; the only one with both more jobs and a higher
 employment multiplier than distilling is light truck and utility vehicle manufacturing. Our
 IMPLAN custom regional input-output model is used for estimating the economic impact
 of distilling, the most conventional method available for such analyses. These models can
 predict the impact of changes in one industry on all other industries in a regional
 economy. The most common summary measure of an industry’s economic impact is
 called a multiplier, which is the ratio of the change in the total economy to the change in
 the industry.

   A hypothetical $10 million new distillery construction project, based on the report’s
 economic models, would create 85 direct construction jobs with a $4.9 million estimated
 payroll. In total – with direct, indirect and induced effects combined – the project would lead to
 $17.5 million in sales increases across Kentucky firms, 130 new jobs, and a $7.2 million
 payroll increase statewide.

   Corn production grew faster in core distilling counties the past two decades than it did
 statewide, data indicate. This correlated growth was especially apparent in Nelson,
 Shelby, Washington, Mercer and Marion – where large, heritage distillers are located.
 Nelson County is, of course, home to many heritage distilleries. Marion County is home to
 Maker’s Mark distillery, and has seen a tripling of corn production over the past 20 years.

The Distilling Industry in Kentucky, 2021                                                             4
The Size of the Distilling Industry in Kentucky
W
e treat the distilling industry here as the collection of firms that earn revenues
primarily from distilling and selling spirits. These firms may engage in other
revenue-generating activities, such as making brandy, beer, wooden barrels,
tourism and hospitality, research, managing and marketing other product lines (including wines
and non-spirits products), and selling merchandise in their gift shops.
Economic statisticians attempt to classify industrial activity by business establishment, or
location. If a distilling company makes barrels in one location, distills Bourbon in another
location, ages it in warehouses at another location, and has corporate offices at yet another
location, then the company might have activity listed under four different industrial
classifications.
The detailed industrial classification codes relevant to Kentucky’s distilling industry are provided
in Appendix A. We presume the companies would not be located in Kentucky were it not for
their distilling operations, and hence for purposes of this study we attempt to count all of their
activity as part of the industry.
Distilleries by location
A comprehensive list of the current licensed distilling operations in Kentucky is provided in
Appendix B. The operations may include only distilling, or the whole range of distilling, bottling
and office functions. The license database indicates there are distilleries in 95 distinct locations
in 50 cities and 40 counties. About 75 separate companies own these distilling operations.
Looking back at our previous studies, we see the number of distillery locations grew from 19 in
2009, to 31 in 2013, to 68 in 2018, and 95 in 2021. All but one of the net new additions to the
list since 2018 are small distilleries, licensed to produce less than 50,000 gallons annually.
The major producers in the distilling industry in Kentucky are the Bardstown Bourbon Company,
Beam Suntory (Jim Beam and Maker’s Mark), Brown-Forman, Castle & Key, Diageo, Four Roses,
Green River, Heaven Hill, the Louisville Distilling Company, Lux Row, Michter’s, Rabbit Hole,
Sazerac (Barton 1792, Buffalo Trace, and Glenmore), Wild Turkey, and Wilderness Trail.
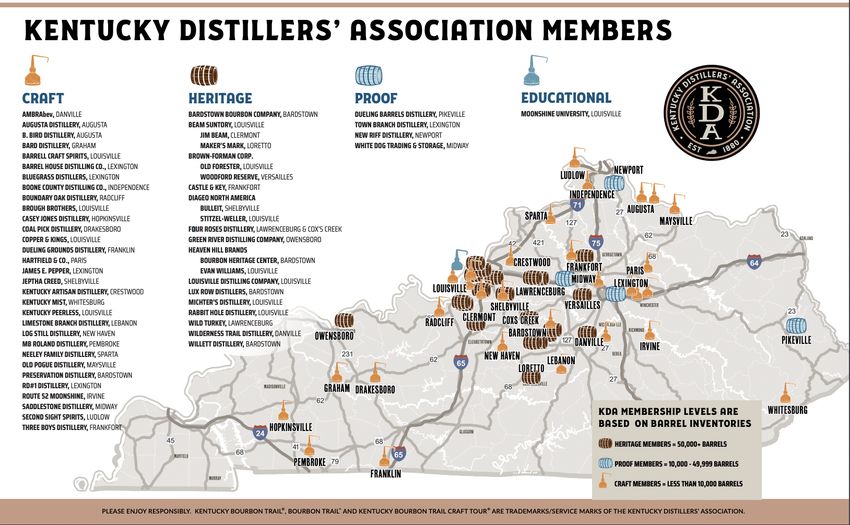
With the exception of Owensboro, the larger distilleries are located near Interstates 64, I-65, or
the Bluegrass Parkway. Smaller craft distilleries have opened across the state. The map shows
locations of KDA members throughout the state by level of membership (not all distillers are
KDA members). There are now more than 50 member distilleries, up from only seven in our
original study in 2009.
KDA now has four levels of membership: Heritage, Proof, Craft and Educational. Heritage
members have an inventory of over 50,000 barrels. Proof members have an inventory of
The Distilling Industry in Kentucky, 2021 5between 10,000 and 49,999 barrels. And the Craft members have fewer than 10,000 barrels.
Moreover, as another sign of growth in the industry, there are 16 new Craft distilleries in the
pipeline for membership in the KDA.
Bourbon production and inventory
Unlike most other distilled spirits, Kentucky Bourbon is aged in barrels and stored in
warehouses for years before being bottled and shipped to customers. State and local
governments tax this property while it ages, and therefore we have public data available on the
amount placed into barrels annually, as well as the inventory of barrels by age. Data go back
decades, and we show the recent history in the charts below, all in terms of 53-gallon
containers. One can see the drawdown in barrel inventory through about the year 2000, and
then the effects of the recent surge in demand, with subsequent investments in production
facilities, new warehouses and barrel inventory. Indeed, annual production last year was
double what it was just a decade ago.
About 2.4 million barrels of new Bourbon were produced and added to warehouse inventory in
2020, the most recent year available. There were 10.3 million barrels of Bourbon aging in
Kentucky warehouses as of December 31, 2020. Adding brandy and other aging barrels of
spirits, there are nearly 11 million barrels aging in Kentucky warehouses. The value of all
inventory in bonded warehouses (which includes bulk inventory and cases being held for
shipment as well as distilled spirits in barrels) was assessed for tax purposes at a record $4.4
The Distilling Industry in Kentucky, 2021 6billion in 2021. Inventory subject to county-level property taxes (mostly in barrels) was assessed
at $2.55 billion in 2020, when the total bonded warehouse assessment was $3.84 billion.
Barrels of Bourbon Produced, and Warehouse Inventory, Kentucky
Totals, 1970-2020
12,000,000
Source: Kentucky Distillers' Association, and Kentucky Department of Revenue, as of the end of each year.
10,000,000
Inventory
8,000,000
6,000,000
4,000,000
Production
2,000,000
-
Property tax records also reveal the age distribution of Bourbon barrels in Kentucky
warehouses. We have complete data for KDA members only, but members traditionally account
for about 85 percent of annual production statewide, and thus the vintage profile is
representative of the industry. One can see in the chart below how inventories begin to be
drawn down, particularly after four years of aging. However, there remains over 240,000
barrels that have been stored in warehouses for more than eight years.
The Distilling Industry in Kentucky, 2021 7Number of Bourbon Barrels in Inventory by Year Produced
KDA Members Only
2,500,000 Source: Kentucky Department of Revenue, as produced for purposes of annual
property tax assessments, and provided to the Kentucky Distillers' Association. KDA
members have traditionally accounted for about 87 percent of state production.
2,050,391
2,000,000
1,848,459
1,542,258
1,500,000
1,285,020
1,000,000
834,881
500,000 417,348
225,018 217,264
105,521
0
Over 8 years 2013 2014 2015 2016 2017 2018 2019 2020
There are no published official data on the annual value of production, or sales, by distillers of
spirits in Kentucky. Annual production volume is obviously different than sales volume for most
Kentucky spirits, due to the need to age Bourbon for several years. And the value of products
bottled or otherwise sold varies continually with changing market prices around the world. Our
IMPLAN input-output model of Kentucky, which we use below to estimate economic impacts,
predicts Kentucky distillers produced $5.8 billion of output in 2019. This is 30 percent of the
$19.5 billion IMPLAN predicts for the U.S. distilling industry as a whole, and is the same as
Kentucky’s share of national distilling employment.
Employment and payrolls
In 2020 there were approximately 6,000 people working directly in Kentucky’s distilled spirits
industry, with annual wages and salaries of $602 million. Over the last two decades, the
number of distilling establishments more than tripled in Kentucky. Distilling employment grew
by 83 percent, and wages and salaries grew by 249 percent. For the first time, average annual
pay per job has passed $100,000. There are actually several different sources of employment
and payroll data, and we discuss these at some length in Appendix C. The primary estimates of
The Distilling Industry in Kentucky, 2021 8jobs and payroll we use for our modeling of economic impacts are derived from required
employer filings for state unemployment insurance premiums, which we consider to be the
most comprehensive and accurate of available estimates. This is supplemented by information
obtained from a recent survey of KDA members, and from the Kentucky Directory of
Manufacturers.
Exports of Bourbon and other distilled products
Kentucky distillers shipped over $391 million of products abroad in 2020, with whiskey
accounting for 82 percent of the total. Other products exported by Kentucky distillers include
grape brandy, liqueurs, cordials, vodka, rum, and gin. High retaliatory tariffs by the European
Union and China on U.S. whiskey caused Kentucky exports to fall from its historical peak of
$488.6 million in 2019 to $319.0 million in 2020 – a drop of about $170 million – which pulled
down the total spirits category. Even so, the value of Kentucky whiskey exports is now triple
what it was in 2000, reflecting growth in both volume and price. The leading importers of
Kentucky whiskey last year were Japan, Spain, Australia, United Kingdom, Canada, and
Germany. The Distilled Spirits Council of the United States (DISCUS) digs deeper into federal
export data and breaks out Bourbon from the whiskey category. The group shows $304 million
in Bourbon exports in 2020, on 19.7 million proof gallons of volume. Note, 82 percent of
Bourbon is exported in bulk, rather than form. See Appendix E for more detail on exports.
Distilling’s share of Kentucky and national economic activity
It is well known that we are amid a national boom in small, local distilling operations. These are
sometimes called craft distillers, or micro-distillers. We examine the growth over the past
decade of distillery establishments nationally in some detail in Appendix D, and reveal the
recently occurred wide geographic spread.
Nationally, distillers employing fewer than 10 people grew from 78 to 716 establishments.
Small distillers were in 58 U.S. counties in 2006, but a decade later they were in 400 counties
across the country.
However, there has been little change in the location of large distilling operations. Among the
large employers, most are in Kentucky or adjacent states. Several Kentucky counties have
distillery operations employing more than 400 people – Bullitt, Franklin, Jefferson, and Nelson.
As we document in Appendix C, Kentucky’s share of distilling establishments fell from 24 to 6
percent over the 2001-20 period, while its share of employment fell from 43 to 30 percent.
Kentucky’s share of distilling payroll rose from 40 to 45 percent of the U.S. total, due largely to
the presence of high paying professional jobs at headquarters here. So, while the industry has
expanded greatly in terms of geographic locations, Kentucky remains the main player in terms of
overall production, employment, and payroll.
The Distilling Industry in Kentucky, 2021 9Distilling directly supports around 6,000 jobs, which is a small fraction (0.2 percent) of all jobs in
Kentucky. However, this is a narrow way to view the industry’s economic importance for
several reasons. First, one needs to distinguish between jobs that are based on making things
we sell to other states and the rest of world, and jobs that are based on producing things sold
mainly to Kentucky households.
The export-based jobs bring new dollars into the region and make the economy larger, while
the population-based jobs essentially absorb dollars already in the region. Distilling products
are widely exported out-of-state, and the industry is an economic engine for Kentucky.
Industries like grocery stores, most retail, health care, education, and personal services exist to
serve regional populations, and hence expand only in response to growth in the population and
income, which in turn is determined primarily by growth in Kentucky’s exporting industries.
Second, employment is only one important indicator of an industry’s relative importance. Other
economic variables include the value of output, employee compensation, and tax revenues
generated. In all of these dimensions, distilling has a greater economic contribution than a
simple job count would suggest.
Top Exporting Industries' Share of Kentucky Employment and Output
5.0% Source: IMPLAN model of Kentucky, using 2019 economic data
4.5% Light truck and utility vehicle mfg
4.0%
3.5%
Share of Kentucky Output
3.0%
Automobile mfg
2.5%
Insurance carriers, except direct
life
2.0%
1.5%
Distilleries Mgmt of companies and enterprises
1.0% Scientific research and devl svc Couriers and messengers
Motor
Aluminum sheet, vehicle
plate, steering,
and foil Wholesale - Other durable goods
suspension
Motor vehicle seating
Wholesaleand- Machinery,
interior
Other motor
component
mfg vehicle
(except parts mfg
spring), and merchantequip, and
wholesalers
trim mfg supplies
0.5% Data Coal
Motor brake
mining
processing,
vehicle systems
hosting,
metal
Water trans Other plastics product mfg
mfg
and Scenic
stamping and sightseeing trans and
Paperboard container mfg Custom computer
Mgmt
Hotels programming
consulting
and svcincl casino
motels,
Oil andPoultry
Commercial and processing
gasrelated svc
industrial
Printing
extraction support
Beef
activities
cattle ranching
for trans
and farming,
Radio
Motor Bread
and
Poultry and
egg bakery
television
and
vehicle body Grain
broadcasting
production
mfg Computer
except systems
farming
product, svc
Animaldesign hotels
svc
production, except cattle
machinery
Spring and equip rental
mfgand
Woodand wire
Otherproduct
container amusement
and pallet
frozen, mfg
mfg incl feedlots and dual-purpose
and recreation and poultry and eggs All other crop farming
Other accommodations
Tobacco
leasing farming
0.0% industries ranching and farming
0.0% 0.2% 0.4% 0.6% 0.8% 1.0% 1.2% 1.4% 1.6% 1.8%
Share of Kentucky Employment
The Distilling Industry in Kentucky, 2021 10In the chart above, we highlight the 40 export-based industries in Kentucky that rank highest in
employment as a share of the state total, using estimates from our IMPLAN model. We also
show their relative contributions to total state output. One can see distilling ranks fourth
highest in terms of output contribution, reflecting the high value of the distilling product, as
well as the high employee pay, dividend payments and exceptionally high taxes paid. In terms
of contribution to state output, the light truck and auto manufacturing industries lead the way,
followed by insurance carriers, then distilling. Not shown are the rankings in terms of employee
compensation, where distilling ranks 14th statewide.
Another way to look at the economic importance of industries in Kentucky is to examine what
their share is of the national counterpart industries. This is summarized in the next chart. For
544 detailed industrial sectors, we divided Kentucky’s employment and output by the national
totals for each industry. Clearly, distilling stands out by this measure, with 30 percent of
national distilling employment, 30 percent of national output, and (not shown) 45 percent of
national employee compensation. No other Kentucky industry has higher shares of both
national employment and output.
Top Kentucky Exporting Industries' Share of US Employment and Output
35% Source: IMPLAN model of Kentucky and United States, using 2019 economic data
30% Distilleries
Tobacco farming
25%
KY Share of US Output
20%
Aluminum sheet, plate, and foil
mfg
15%
Light truck and utility vehicle mfg
Motor vehicle steering, suspension component (except spring), and brake systems mfg
10% Motor vehicle seating and interior
trimCoal
mfgmining
Spring and wire product mfg
Automobile mfg
Motor vehicle metal stamping
Motor vehicle body mfg
5% Wood container and pallet mfg
Other motor vehicle parts mfg
Water trans Couriers and messengers
Animal production, except cattle and poultry…
Poultry processing
All other crop farming
Scientific research and devl svc
0%
0% 5% 10% 15% 20% 25% 30% 35% 40% 45%
KY Share of US Employment
The Distilling Industry in Kentucky, 2021 11Impact of Covid-19
The Covid-19 pandemic publicly hit the United States in February 2020, and by March there
were widespread business closures due to state government orders or from private decisions to
protect employees and customers. As was well-documented, many distilleries shifted
production from spirits to hand sanitizer to aid the national effort to slow the spread of the
virus. Bourbon-based tourism certainly suffered in Kentucky, as visitor centers closed and
people stopped traveling except for essential needs.
However, U.S. sales of domestic whiskey continued to grow in 2020, as consumers shifted more
toward home consumption and purchased more premium brands. National data from the
Distilled Spirits Council of the United States (DISCUS) show these trends over the past two
decades. Below are two charts, first for volume, second for value. The shift to more expensive
brands, as well as the strong growth in cases sold, is evident in the charts. Suppliers had
revenues of $4.3 billion in 2020, inclusive of federal excise taxes paid. They sold 28.4 million
cases of domestic whiskey last year in the U.S. Super Premium whiskies accounted for only 2.4
percent of volume sold in 2002, but by 2020 its share had grown to 14.4 percent.
US Whiskey Sales by Branding, Cases (000) of 9-liter Bottles
30,000 Source: Distilled Spirits Council of the United States, www.distilledspirits.org/wp-
content/uploads/2021/01/American-Whiskey-2020.pdf
Super
25,000 Premium
20,000
High End
Premium
15,000
10,000
Premium
5,000
Value
0
2002 2003 2004 2005 2006 2007 2008 2009 2010 2011 2012 2013 2014 2015 2016 2017 2018 2019 2020
The Distilling Industry in Kentucky, 2021 12US Whiskey Sales by Branding, Supplier Revenues (million $)
$5000 Source: Distilled Spirits Council of the United States, www.distilledspirits.org/wp-
content/uploads/2021/01/American-Whiskey-2020.pdf , includes federal excise taxes.
$4500
$4000 Super
Premium
$3500
$3000
High End
Premium
$2500
$2000
$1500
$1000
Premium
$500
Value
$0
2003 2004 2005 2006 2007 2008 2009 2010 2011 2012 2013 2014 2015 2016 2017 2018 2019 2020
Monthly data on distillery employment are available nationally, but not at the state level.
However, as Kentucky accounts for almost a third of the industry employment, we can
reasonably use the national data to discern the degree of retrenchment regionally. As one can
see, employment declined from 2019 levels in April, May, and June of 2020, but then began to
grow again in late summer. April was the hardest hit month, with a decline of 1,400 jobs
nationally, or 8.2 percent compared to April 2019. Wages and salaries also declined in the
second quarter of 2020, by $10.7 million compared to the same quarter in 2019, or 3.6 percent.
Payrolls returned to robust growth in the third quarter of 2020.
We do have comparable data on the average monthly distilling employment in Kentucky, and
they show 2.4 percent growth in 2020 over 2019, almost identical to the 2.6 percent growth
nationally. So, the Covid-19 impact pictured here likely applies to Kentucky as well.
The Distilling Industry in Kentucky, 2021 13Monthly Distillery Employment in United States
20,000
18,000
16,000
14,000
12,000
10,000
8,000
6,000
4,000
2,000
Source: US Bureau of Labor Statistics, Quarterly Census of Employment and Wages.
-
2001 2002 2003 2004 2005 2006 2007 2008 2009 2010 2011 2012 2013 2014 2015 2016 2017 2018 2019 2020
Recent and planned investments by Kentucky distillers
We surveyed all the KDA members during the Summer 2021, asking them to disclose their
spending over the last five years on construction and other capital investments. We also asked
them their investment plans for the next five years. Clearly, the industry is in major growth mode,
with heavy spending on stills, warehouses, bottling facilities, and visitor centers. Members
reported capital spending of $1.9 billion over the last five years, almost equally split between
construction and other items, such as machinery, equipment, and furnishings. Moreover, they
plan to spend $3.3 billion over the next five years. One can see in the chart below that most of
the planned investment is towards direct production – distillation, bottling, warehouses. About
$100 million is planned for visitor centers. Every KDA member, whether a large Heritage producer
or a small Craft producer, reported significant investments. The Heritage producers, however,
accounted for 87 percent of total investments, recent or planned.
The Distilling Industry in Kentucky, 2021 14Recent and Planned Capital Expenditures
of the 43 KDA Members Responding
$2,000,000,000
$1,800,000,000 $1,752,477,120
$1,600,000,000
$1,507,529,307
$1,400,000,000
$1,200,000,000
$1,000,000,000
$975,188,002
$902,767,189
$800,000,000
$600,000,000
$400,000,000
$200,000,000
$0
last five years, last five years, other next five years, next five years, other
construction construction
Planned Capital Expenditures, 2021 to 2025, by type
of the 43 KDA Members Responding
$1,200,000,000
$1,000,000,000
$975,192,191
$870,755,448
$817,897,913
$800,000,000
$600,000,000
$400,000,000
$200,000,000
$100,475,500
$34,319,232 $56,847,000
$0
The Distilling Industry in Kentucky, 2021 15A related measure of investment is available from the Kentucky Cabinet for Economic
Development. The agency tracks publicly announced projects, and records the planned
investment and the projected number of new direct jobs. There were 114 distillery projects
announced between 2014 and 2020, totaling $3.2 billion in value. We have organized the data
by year, as shown in the accompanying charts. Two-thirds of the investment was listed solely as
production activity – distilling, bottling, warehousing. The other one-third reported a mixture of
investments, usually to include production, visitor centers, and offices. Eleven projects
mentioned a visitor center, and 12 projects mentioned a headquarters investment.
Announced Investments by Kentucky Distillers
as approved for incentives by the Kentucky Economic Development Cabinet
$1,800,000,000
$1,600,952,714
$1,600,000,000
$1,400,000,000
$1,200,000,000
$1,000,000,000
$800,000,000
$600,000,000
$448,445,795
$400,000,000
$320,738,585
$278,377,885
$167,727,512 $189,880,077
$200,000,000 $153,433,702
$0
2014 2015 2016 2017 2018 2019 2020
Barrel production
Bourbon requires several years of storage in new oak barrels. Because of the concentration of
Bourbon distilleries in Kentucky, as well as the state’s large endowment of oak forests, there are
many cooperages and related operations here. A recent query of the database maintained by the
Kentucky Cabinet for Economic Development revealed 13 barrel producing operations, with total
employment of over 1,300. We see operations in eight counties, with two each in Jefferson and
Marion counties.
The Distilling Industry in Kentucky, 2021 16Kentucky Barrel Production Facilities, June 2021
Company City County Employment
Kentucky Cooperage Inc Lebanon Marion 460
Brown-Forman Cooperage Louisville Jefferson 205
East Bernstadt Cooperage LLC East Bernstadt Laurel 190
Morehead Wood Products Company Morehead Rowan 122
Benton Wood Products Benton Marshall 91
Robinson Stave LLC East Bernstadt Laurel 73
Zak Ltd Hodgenville LaRue 50
Canton Wood Products LLC Lebanon Marion 41
Speyside Cooperage KY Inc Shepherdsville Bullitt 34
SS Stave Co Inc White Plains Hopkins 28
Kentucky Bourbon Barrel Louisville Jefferson 13
Total 1,307
Source: Kentucky Economic Development Cabinet, Wood Container and Pallet
Manufacturing, NAICS 321920, June 2021
Grain purchases
The primary ingredient in Bourbon and other spirits is grain – corn, wheat, rye and barley. We
estimate Kentucky distillers purchased about 16.9 million bushels of corn and 8.4 million bushels
of other grains in 2020. Corn is much more available from Kentucky farmers than the other grains
used in distilling. Using our recent survey of KDA members, we estimate Kentucky distillers likely
purchased about 12.5 million of those bushels of corn from Kentucky farmers, which is about five
percent of total annual production in the state. The 74 percent rate of local corn purchases is up
from our first estimates for 2014, where distillers reported buying only 40 percent of their corn
from Kentucky farmers. We estimate distillers purchased about 1.0 million bushels of other grains
from in-state producers last year. See Appendix G for more detail.
Other physical inputs
The linkages between distilling, workforce, cooperages, grain production, and warehouses are
evident from a distillery tour. What are the other important ingredients in the final product? A
partial list includes copper stills, glass bottles, labels and caps. Industry veterans tell us most of
these other ingredients are produced outside the state. Our IMPLAN model (see Appendix F for
details), predicts a similar pattern of purchasing. The model predicts, for example, about 70
percent or more of needed wood containers and pallets, wholesale distribution services, and
transportation services are purchased from Kentucky suppliers, compared to just 1 percent of all
needed glass containers and just 10 percent of machinery and other equipment.
The Distilling Industry in Kentucky, 2021 17Economic Impact of the Distilling Industry in Kentucky
I
n this section, we analyze how production, jobs, and payroll in the distilling industry ripple
throughout Kentucky, creating even more economic activity. We use a custom input-output
model of the state to represent the linkages between distilling and hundreds of other
industries, as well as households, and then to predict the total economic impacts.
Employment, output, payroll
The next table provides our estimates of the distilling industry’s total economic contribution to
the Kentucky economy in employment, output and payroll. It also presents the three impacts by
the type of effect. The direct effect is the economic activity of the distilling industry. The
indirect effect measures the interindustry, or supply chain, linkages. And the induced effect
measures the household impacts linked to the new personal income. The direct jobs and payroll
of distillers and their corporate office activity leads to a total of around 22,540 jobs, with annual
payroll of $1.23 billion, producing $8.94 billion of economic output. This is an estimate of what
would happen in the state in the unlikely event that the distilling industry completely
disappeared, or became severely restrained by outside issues that made it impossible or
impractical to operate.
Annual Economic Impact
of the Distilling Industry in Kentucky
Impact Type Employment Output Payroll
Production of Distilled Spirits
Direct Effect 4,170 $5,435,148,508 $290,448,513
Indirect Effect 8,672 $1,769,277,317 $357,901,861
Induced Effect 4,750 $701,855,347 $162,083,296
Total Effect 17,592 $7,906,281,171 $810,433,670
Corporate Management Functions
Direct Effect 1,750 $535,055,328 $306,046,099
Indirect Effect 1,102 $184,336,890 $41,565,409
Induced Effect 2,094 $309,583,219 $74,060,448
Total Effect 4,946 $1,028,975,437 $421,671,957
Total Distilled Spirits Industry Impact
Direct Effect 5,920 $5,970,203,836 $596,494,612
Indirect Effect 9,774 $1,953,614,207 $399,467,270
Induced Effect 6,844 $1,011,438,566 $236,143,744
Total Effect 22,538 $8,935,256,608 $1,232,105,626
Source: Customized IMPLAN (IMpacts for PLANing), version 3.1, model of
Kentucky, using 2019 economic data.
Note: Indirect impact refers to business-to-business spin-off spending;
Induced impact refers to household spending that is a result of increased
earnings.
The Distilling Industry in Kentucky, 2021 18Our economic impact analysis is based on approximately 6,000 distilling industry jobs across the
state – 4,250 production-related jobs and 1,750 corporate management-related jobs1. Our
IMPLAN models have been customized to reflect the particular structure of the industry in
Kentucky and all the functions of the production process, from distilling to barreling to bottling,
shipping and marketing. Appendix F provides a more detailed explanation of the industrial
linkages in the model.
Production activities supported about 17,590 jobs with a payroll of $810.4 million. The
contribution to Kentucky’s economic output was about $7.91 billion. Corporate activities
supported about 4,950 jobs with a payroll of $422 million. The contribution to Kentucky’s
economic output of the management jobs was about $1 billion.
Industries Most Affected by the Distilling Industry
Industry Sector Employment Labor Income
Distilleries 4,250 $403,611,119
Management of companies and enterprises 2,027 $378,811,840
Wood container and pallet manufacturing 1,146 $77,247,962
Truck transportation 1,101 $70,623,261
Employment services 716 $25,211,863
Wholesale - Other nondurable goods merchant wholesalers 663 $44,963,137
Other real estate 610 $13,134,380
Full-service restaurants 569 $14,253,454
Grain farming 517 $14,211,409
Limited-service restaurants 451 $9,871,958
Hospitals 449 $33,754,984
Source: Customized IMPLAN (IMpacts for PLANing), version 3.1, model of
Kentucky, using 2019 economic data.
Note: Labor income includes employee compensation and proprietors income.
Aside from the core distilleries and management sector, the industries most affected by
distilling in Kentucky are wood container and pallet manufacturing, truck transportation,
wholesale trade, employment services, real estate, restaurants and bars, and grain farming.
According to the Kentucky Cabinet for Economic Development, there are at least 1,300
employees working in cooperages, stave manufacturing plants, and used barrel refurbishers (all
1
The direct effect in the production section of the table is less than 4,250 because the activities of the distilling
industry have an effect on itself, essentially spin-off into its own industrial sector. We do not want to double
count this own-industry spin-off in our analysis of the contribution of the industry. What the table shows is
that if we eliminated all of the corporate management function jobs and about 4,170 production jobs, one
result would be the elimination of all of the remaining production jobs (part of the indirect effect).
The Distilling Industry in Kentucky, 2021 19in the wood container manufacturing industry) throughout the Commonwealth, mostly in the
eastern and south-central counties. All are operating at capacity.
Real estate, restaurants, and hospitals are sectors that link to distilling primarily through
household spending channels. For example, we estimate if Kentucky’s distilling industry did not
exist, there would be about 570 fewer jobs in full-service restaurants in the state. Hospitals,
because they are huge employers and nearly everyone will need their services at some point,
are linked to activity in all other industries. As the distilleries and their suppliers expand, more
employees and households are covered by commercial insurance, and thus generate revenues,
jobs, and payroll for hospitals.
Appendix H provides an analysis of the economic multipliers behind these estimates.
Impact of construction
Distillery companies have invested billions of dollars into their facilities and equipment the
decades. This is evident from the large property tax payments they make to government
jurisdictions each year, a topic we examine in the next section.
We already noted Kentucky distillers invested roughly $1.9 billion in improvement projects
since 2016, which is more than that projected in our 2016 and 2018 studies. In addition, the
distillers are planning another $3.3 billion in projects over the next five years, with all the
distillers expanding capacity, erecting new warehouses for barrel aging and putting more focus
on the visitor experience, particularly among the KDA’s Kentucky Bourbon Trail® and Kentucky
Bourbon Trail Craft Tour® distilleries. Here we analyze the one-time economic impacts of a
hypothetical $10 million distillery construction project. Our estimates can be scaled up or down
according to the size of the investment under consideration.
We use our IMPLAN model of Kentucky to perform the analysis. The model has a sector entitled
“Construction of new manufacturing structures” that fits this question. We simulated a $10
million increase in demand for that sector, and the model predicted the impacts on business
output, jobs, and payrolls. The results are shown in the next table.
The first row indicates the investment is associated with 85 direct construction jobs, with
estimated payroll of $4.9 million. The indirect impacts refer to inter-industry linkages, wherein
the construction project requires purchases from other companies in Kentucky. The induced
impacts refer to the cumulative rounds of household spending caused by the increased income
flowing to employees. The last row summarizes the total impacts. The $10 million project leads
to an increase in sales of about $17.5 million for all Kentucky firms, an increase in jobs of 130,
and an increase in payroll statewide of $7.2 million. Value added measures the amount of
The Distilling Industry in Kentucky, 2021 20output that is generated in the regional economy, as opposed to the total sales value2. These
results are similar to our previous studies.
Estimated Economic Impact of $10 million Construction Investment by the
Distilling Industry in Kentucky
Impact Type Employment Labor Income Value Added Output
Direct Effect 85 $4,911,755 $5,048,175 $10,000,000
Indirect Effect 15 $874,197 $1,483,819 $3,034,693
Induced Effect 30 $1,404,390 $2,488,593 $4,492,868
Total Effect 130 $7,190,341 $9,020,587 $17,527,560
Source: IMPLAN model of Kentucky, using 2019 economic data, sector 51 "Construction
of New Manufacturing Structures".
We can make an estimate of the amount of additional tax revenues that would be generated,
using some of the results developed later in this study. Construction supplies and materials are
potentially subject to Kentucky’s 6% sales tax, and could amount to a couple hundred thousand
dollars in tax revenues for the project. However, when job growth is involved, companies often
qualify for an exemption to the sales tax. Kentucky state government would receive a one-time
increase in individual income and sales tax receipts of about $637,000 at the historical effective
tax rates, and local governments (including public school systems) would receive an additional
$86,000 in occupational taxes. Thus, excluding any possible sales tax payments on construction
materials and machinery, governments in Kentucky would receive a total one-time increase of
$724,000 in tax revenue.
It is impossible to precisely predict the long-term fiscal impacts of such an investment without
specifying where the investment occurs in the state. Property tax rates vary widely among
jurisdictions. A rule of thumb is that real estate is subject to property taxation at the rate of 1%,
though the rate can be much higher in very urbanized places with intensive public services
(schools, fire, police, libraries, streets, garbage pickup, EMS). Assuming that the property was
valued at construction cost, this implies that the direct investment leads to annual property tax
revenues to local and state governments of $100,000 per year.
2
To illustrate the difference between output and value added, consider a car dealership. They may sell a new
vehicle for $30,000 (Kentucky output), but most of those dollars go to an out-of-state manufacturer. Value
added in that case measures the several thousand dollars that the dealership adds in vehicle prep, display,
financing, and sales support, as well as local taxes. The value added concept is intended to measure the
amount of dollars that ‘stick’ to the regional economy.
The Distilling Industry in Kentucky, 2021 21Impact of equipment investment
Kentucky’s distillery companies are equipped with state-of-the-art stills, bottling machinery,
computers and whatever else they need to manufacture and sell their products. Nearly half of
the upcoming $3.3 billion in investment will go toward various kinds of durable machinery. We
therefore also simulated a $10 million equipment investment using IMPLAN’s capital
investment scenario for the beverage manufacturing sector. Summary results are below.
Estimated Economic Impact of $10 million Equipment Investment by the
Distilling Industry in Kentucky
Impact Type Employment Labor Income Value Added Output
Direct Effect 9 $698,517 $987,009 $2,066,296
Indirect Effect 4.6 $252,809 $364,764 $726,043
Induced Effect 4.9 $228,372 $404,942 $731,025
Total Effect 18.6 $1,179,698 $1,756,715 $3,523,365
Source: IMPLAN model of Kentucky, using 2019 economic data, using Acitivity template
for Beverage manufacturing.
The direct effects here are felt by Kentucky industries selling equipment to the distilling
industry. These direct purchases are expected to amount to about 20 percent of the total
capital equipment spending, about $2 million. That activity supports nine jobs with a payroll of
$699,000. Business-to-business (indirect) and household spending (induced) create more
impacts, and the $10 million of capital spending leads to an increase in sales of about $3.5
million for all Kentucky firms, an increase of 19 jobs and an increase in payroll statewide of
$1.18 million. The new payroll would be associated with an increase in Kentucky state income
and sales tax revenues of $104,000, plus about $14,000 in new occupational taxes for local
government jurisdictions.
Average annual impact possible from distilling industry planned investments
KDA members have roughly $3.3 billion in expansion and improvement projects planned over
the next five years. We can use the results of the last two sections to estimate the average
annual impact on the state’s economy of this activity over the coming five-year period.
In the following table we assume a fairly uniform spending pattern over the five years ($652
million per year) and follow the reported ratio between construction and capital equipment of
46:54. Results will be different depending on the exact spending mix. Relatively more
The Distilling Industry in Kentucky, 2021 22construction spending will increase the impact, while relatively more capital equipment
spending will decrease the overall impact.
Estimate of Average Annual Impact of Kentucky Distilling Industry's $3.3 Billion
Investment Plans Over the Next Five Years
Income, Sales,
Property Occupational
Employment Output Payroll Taxes Taxes
4,565 $651,958,539 $258,140,871 $4,808,957 $25,400,896
Source: IMPLAN model of Kentucky, using 2019 economic data.
We estimate the distilling industry construction and capital improvement projects could
support an average of 4,565 additional jobs in Kentucky through 2025. Those jobs would have
about $258.1 million in total payroll and generate about $25.4 million in combined state and
local income and sales taxes each year. The real estate improvements could mean an additional
$4.8 million in property tax revenues each year for local and state governments.
The Distilling Industry in Kentucky, 2021 23Taxation and Fiscal Impacts of the Industry
T here are many types of taxes that distillers and the consumers of spirits pay, and the
taxes go to many different jurisdictions in Kentucky. Indeed, this is the most complicated
part of our analysis. Distilleries remain one the highest taxed of the 544 Kentucky
industrial sectors we analyzed using our IMPLAN input-output model of the state. Twenty-one
percent of the value of distillery output goes to government taxes – a rate exceeded by only
three sectors: wholesale petroleum, commercial fishing, and tobacco manufacturing – sectors
with a much smaller economic footprint than distilling. The effective tax rate on distilling is
higher than that of breweries (8.2 percent) and wineries (3.1 percent). This calculation includes
taxes levied by all levels of government, including federal, state, and local.
Before we look into the details of state and local taxation in Kentucky, it is worth noting how
dominant the state is in
terms of federal excise taxes Federal Alcohol Excise Tax Collections, 2020
on alcohol production. KY $1,801,427,336
CA $1,135,106,128
According to the U.S. Alcohol TX $756,342,525
IL $564,614,000
and Tobacco Tax and Trade MO $406,893,587
FL $397,482,058
Bureau, Kentucky is CO
OH
$345,509,582
$328,235,874
responsible for 22 percent of IN
VA
$310,655,462
$242,785,606
TN $230,934,566
all alcohol excise tax GA $221,915,984
NY $192,647,022
collections. See chart. The PA $176,404,288
WI $172,694,340
collections shown cover not NJ
MN
$143,560,752
$132,127,388
only spirits, but beer and MD
AR
$104,192,432
$93,625,830
wine. However, beer and ME
CT
$79,095,262
$70,769,198
NH $51,651,734
wine production are small in OR $48,406,385
NC $36,140,119
Kentucky, and distilling MA $30,859,459
WA $30,213,638
clearly is the cause of MI
IA
$20,421,005
$17,116,874
Kentucky’s first-place rank. In PR
AL
$15,892,809
$14,406,483
2020, Kentucky distillers AZ
UT
$6,939,601
$6,059,477
VT $5,373,373
remitted $1.8 billion in excise DE $4,371,780
SC $1,734,000
taxes to the U.S. Treasury. ID $1,677,342
LA $1,670,059
The tax rate is $13.50 per KS
NM
$1,458,124
$1,369,094
proof gallon of production. AK
HI
$1,168,562
$858,215
MT
Thus, for example, one gallon NV
$766,704
$724,612
RI $673,414
of 100 proof Bourbon (50% WV $638,456
NE $441,119 Source: US Alcohol and Tobacco Tax and Trade Bureau, by special request.
alcohol) would generate OK
WY
$399,261
Data refer to calendar year 2020, and include excise taxes for spirits, wine,
$274,229
and beer. Kentucky accounted for 22 percent of the national total of $8.2
$13.50 in federal excise DC
MS
$229,868
$177,040 billion. For more information, see ATT annual report, www.ttb.gov/about-
ttb/plans-and-reports-annual-reports.
taxes, paid by the distiller. SD
ND
$102,161
$50,770
$0.00 $500,000,000.00 $1,000,000,000.00 $1,500,000,000.00 $2,000,000,000.00
The Distilling Industry in Kentucky, 2021 24You can also read