Technology, Media and Telecom - FOR BUSINESSOWNERS Winter | 2022 - Dynamix-cdn
←
→
Page content transcription
If your browser does not render page correctly, please read the page content below

Technology,
Media and
Telecom

         INDUSTRY REPORT

                Winter | 2022

                    C R E AT I N G
          M & A S T R AT E G I E S

   FOR B U S I N E S S OW N E RS

                  SINCE 1956
Table of Contents
               Market Observations ........................................................................ 3
               Transaction Highlights …..................................................................11

               Public Companies ............................................................................ 14
               CFA Overview .................................................................................... 24

                                                   Technology, Media & Telecom Industry News | Winter 2022 | Page 2
Market Observations

                      Technology, Media & Telecom Industry News | Winter 2022 | Page 3
Market Summary
Technology Market
Private equity, Venture capital, and corporate investors continue to make large bets on digital companies as innovation advances and
technology becomes more critical. As consumers and businesses seek to become more connected, IT companies are experiencing record
investment opportunities from a variety of sources. The net neutrality controversy continues to cast a shadow over the future of internet
service and content providers, and certain tech platforms may face additional privacy rules. The work from home culture is driving the
demand for cloud-based connectivity. ESG, Metaverse, AI, and Data Privacy are the main themes that will shape the TMT industry in the
future, as per the TMT Predictions 2022 report published by Thematic Research. Furthermore, the TMT industry is expected to remain
profitable, giving the ideal basis for reinvesting retained earnings and scaling through acquisitions, along with offering product excellence
across all critical sub-sectors.

Public Company Valuations
The CFAW Select Technology Index was up by 17.2% in the fourth quarter of 2021, and the 12 months return
on the Index was 42.7%. Our index for each of the subsector of Technology was up in the fourth quarter of
2021, except for Electronics and Appliance Stores, which was downy by 6.7%. Semiconductor and Other                The public
Electronic Component Manufacturing outperformed all other indices with 24.0% increase in the fourth quarter
                                                                                                                   technology market
of 2021. Software Publishers had the highest median revenue and EBITDA multiple of 10.4x and 60.1x,
respectively. Electronics and Appliance Stores had median revenue and EBITDA multiples of 0.9x and 9.5x,           continued to
while Professional and Commercial Equipment and Supplies Merchant Wholesalers had median revenue and               flourish in the
EBITDA multiples of 0.6x and 14.5x, respectively. Computer Systems Design and Related Services, Data
                                                                                                                   fourth quarter of
Processing, Hosting, and Related Services, Other Telecommunications, Semiconductor and Other Electronic
Component Manufacturing had median revenue multiples of 2.7x, 4.8x, 4.7x, 6.5x and median EBITDA                   2021...
multiples of 17.4x, 14.4x, 22.1x, 27.3x respectively.

Mergers and Acquisitions
The M&A in the Technology, Media and Telecommunication sector remained positive throughout 2021. Significant interests from private
equity participants are shaping the M&A activity in this industry. M&A activity decreased in the fourth quarter of 2021, as businesses in the
industry feared government intervention. However, in 2021, the industry witnessed several IPOs of technology companies. Accelerated
digital transformation remained an important theme for strategic and PE investors. Increased demand for streaming content,
implementation of 5G and the rise in online gambling platforms, will act as drivers for M&A transactions in this industry.

                                                                                               Technology, Media & Telecom Industry News | Winter 2022 | Page 4
Industry Trends
Wi-Fi 6
Wi-fi 6 is the first gigabit-speed Fixed Wireless Access (FWA) solution. Fixed Wireless Access is a cost-effective and scalable cellular wireless
alternative for providing internet access to stationary equipment. FWA will play a crucial role in expanding internet access while also
providing telcos with new income, growth, and innovation options. Wi-fi 6 offers up to 7 Gbps throughput for outdoor broadband
networks and 5G backhaul infrastructure, which improves performance, scale, and dependability. These devices are now outselling 5G
devices by a significant margin, and this trend is expected to continue for the next few years. The Wi-Fi 6 devices are more affordable as
they use unlicensed spectrum and wireless connectivity makes it more attractive for consumers.

DARQ
DARQ stands for Distributed Ledger, Artificial Intelligence, Extended Reality, and Quantum Computing, refers to technologies that are ready
to be implemented in enterprise-grade software. The most significant feature is the multitude of use cases that can be created in various
combinations. GE Aviation and Microsoft partnered to improve the tracking
of aircraft parts using distributed ledger technology which reduced
inefficiencies and the overall process was completed in a time bound
manner. Volkswagen used quantum computing to test traffic flow
optimization and accelerated battery development. Distributed ledgers
were also tested by Volkswagen to allow automatic payments at gas
stations, construct tamper-proof odometers, and secure cars from hackers,
among other things. LEGO Wear was able to open one store using augmented reality even though there were no clothes in the store as
shoppers shopped virtually. DARQ technology is expected to play key role in defining the future.

RISC-V
The longevity of the chip shortage is due to a significant increase in demand, and this shortage is fueling digital transformation. Venture
capitalists are looking for alternatives and investing in new kinds of chips like RISC-V. RISC-V is a new kind of chip architecture. Engineers
collaborate to develop, set, and improve the architecture of RISC-V. The specification is set by RISC-V International, which is open to
license, and chip makers are allowed to implement it in their processors and system-on-chips as they see fit. Smaller device
manufacturers can build hardware, with a proven and freely available instruction set architecture.

                                                                                               Technology, Media & Telecom Industry News | Winter 2022 | Page 5
Significant News
China pursues tech ‘self-reliance,’ fueling global unease
AP News, December 28, 2021

   “To help make China a self-reliant “technology superpower,” the ruling Communist Party is pushing the world’s biggest e-
   commerce company to take on the tricky, expensive business of designing its own processor chips — a business unlike
   anything Alibaba Group has done before. Its 3-year-old chip unit, T-Head, unveiled its third processor in October, the Yitian
   710 for Alibaba’s cloud computing business. Alibaba says for now, it has no plans to sell the chip to outsiders. Other rookie
   chip developers including Tencent, a games and social media giant, and smartphone brand Xiaomi are pledging billions of
   dollars in line with official plans to create computing, clean energy and other technology that can build China’s wealth and
   global influence.”
                                                                                                                     Read More >

New measures to boost UK telecoms security
GOV.UK, December 8, 2021

   “2G and 3G mobile networks will be phased out of use in the UK by 2033 as part of measures to increase the security of
   telecoms supply chains and to support a smooth transition to faster mobile networks. Digital Secretary Nadine Dorries
   announced the ambition, alongside £50 million of telecoms research and development projects, ahead of her first visit to
   the United States where she will meet with US Secretary for Commerce Gina Raimondo.”
                                                                                                                      Read More >

HCL Technologies Announces Plan to Create 12,000 New Jobs in the United States
Business Wire, December 6, 2021

   “HCL Technologies (HCL), a leading global technology company, announced plans to create 12,000 new jobs in the United
   States in the next five years. The company expects to recruit more than 2,000 graduates over the next 36 months as part of
   its U.S. early career and training program, Rise at HCL. This is part of the organization’s global New Vistas program, which is
   designed to establish innovation and delivery centers in emerging cities around the world. The company also recently
   launched its HCL Apprenticeship Program, which offers full-time tech jobs and fully-funded higher education for high
   school graduates in the U.S.”
                                                                                                                      Read More >

                                                                                    Technology, Media & Telecom Industry News | Winter 2022 | Page 6
M&A Metrics
Technology Industry
M&A activity in the Technology industry decreased marginally
in the Q4 2021. The number of M&A transactions in the
industry decreased from 2,173 in Q3 2021 to 2,033 in Q4 2021.
The number of sub-$50 million transactions decreased from
1,977 in Q3 2021 to 1,817 in Q4 2021. However, the number of
transactions above $100 million increased from 150 in Q3 2021
to 158 in Q4 2021. The total number of M&A transactions
increased 13.5% year on year from 1,791 in Q4 2020 to 2,033 in
Q4 2021.

M&A Deal Summary Table | Count by Deal Size over Time

Transaction Value     Q1 2019   Q2 2019   Q3 2019   Q4 2019   Q1 2020   Q2 2020   Q3 2020   Q4 2020   Q1 2021   Q2 2021   Q3 2021   Q4 2021

      Not Disclosed      943       938      1,030      994       968       758      1,101     1,260     1,551     1,461     1,643      1,469

     Under $10 MM        170       167       176       184       152       138       187       210       177        201       220       223

      $10 -$25 MM         53        71        29        63        50        52        55        90        73         90        69         73

      $25 -$50 MM         34        34        36        43        36        29        39        64        44         66        45         52

      $50 -$100 MM        25        20        32        33        29        14        26        50        45         43        46         58

     $100 -$500 MM        61        48        38        54        42        34        55        69        68         87        90         90

         $500 MM+         24        32        29        25        15        12        42        48        63         53        60         68
           Total
                        1,310     1,310     1,370     1,396     1,292     1,037     1,505     1,791     2,021     2,001     2,173      2,033
    Transactions

Source: FactSet

                                                                                      Technology, Media & Telecom Industry News | Winter 2022 | Page 7
M&A Metrics – Spotlight on IT

IT Services
The number of M&A transactions in the IT Services increased
from 415 in Q3 2021 to 423 in Q4 2021. The number of sub-$50
million transactions increased from 383 in Q3 2021 to 393 in Q4
2021. The number of transactions above $100 million remained
intact at 25 in Q3 2021 and Q4 2021, however, number of
transactions above $500 million increased from 8 in Q3 2021 to
10 in Q4 2021. The total number of M&A transactions increased
12.2% year on year from 377 in Q4 2020 to 423 in Q4 2021.

 M&A Deal Summary Table | Count by Deal Size over Time

Transaction Value   Q1 2019   Q2 2019   Q3 2019   Q4 2019   Q1 2020   Q2 2020   Q3 2020   Q4 2020    Q1 2021   Q2 2021   Q3 2021    Q4 2021

    Not Disclosed    192       196       220       241       218       158       231        270        326       300        322       327

   Under $10 MM       37        32        33        45        21        31        42         47        31         48        46        44

    $10 - $25 MM      14        11        6         12        9         9         10         20        17         16         8        12

    $25 - $50 MM      10        3         7         10        8         6         4          12         6         17         7        10

   $50 - $100 MM      4         1         10        9         3         2         6          11        12         4          7         5

  $100 - $500 MM      12        9         9         11        8         4         13         10         9         11        17        15

       $500 MM+       4         5         2         3         6         0         6           7         7         7          8        10

            Total
                     273       257       287       331       273       210       312        377        408       403       415        423
     Transactions

 Source: FactSet

                                                                                       Technology, Media & Telecom Industry News | Winter 2022 | Page 8
Industry Metrics
Industry Financial Data and Ratios
NAICs 443142 - Electronics Stores                                     NAICs 423430 - Computer & Computer Peripheral Equipment & Software

  Financial Metric             Last12Mo       2021        2020          Financial Metric              Last12Mo        2021        2020
  Current Ratio                       2.27       2.27          2.99     Current Ratio                        4.62         4.43          2.51
  Gross Profit Margin               41.33%     41.33%       47.38%      Gross Profit Margin                34.09%      34.70%        39.11%
  Net Profit Margin                 9.81%       9.81%        6.45%      Net Profit Margin                  10.01%       9.81%         6.85%
  Accounts Receivable Days           27.29      27.29         32.15     Accounts Receivable Days            54.51       53.14          53.53
  Accounts Payable Days              50.62      50.62         49.69     Accounts Payable Days               55.17       56.68          55.63
  Debt-to-Equity Ratio                2.73       2.73          2.32     Debt-to-Equity Ratio                 2.27         2.96          3.23
  Return on Equity                  36.44%     36.44%       52.88%      Return on Equity                   50.08%      57.37%        49.37%
  Sales per Employee                    --           --          --     Sales per Employee                      --           --            --
  Profit per Employee                   --           --          --     Profit per Employee                     --           --            --
  Sales Growth                      12.22%     12.22%        3.37%      Sales Growth                       49.79%      49.79%        11.34%
  Profit Growth                     89.38%     89.38%       51.43%      Profit Growth                    105.72%      105.72%        55.39%

NAICs 5415 - Computer Systems Design and Related Services             NAICs 5182 - Data Processing, Hosting, and Related Services
  Financial Metric             Last12Mo       2021        2020         Financial Metric                Last12Mo       2021          2020
  Current Ratio                       4.33        4.26         3.37    Current Ratio                          3.96        4.06          3.19
  Gross Profit Margin               58.75%     58.66%       62.06%     Gross Profit Margin                 71.02%      71.42%        66.49%
  Net Profit Margin                 11.12%     10.77%        8.89%     Net Profit Margin                   15.84%      15.25%         4.91%
  Accounts Receivable Days           54.12       59.13        48.99    Accounts Receivable Days              56.44       56.79         57.42
  Accounts Payable Days              29.06       29.68        32.94    Accounts Payable Days                 39.51       40.51         43.68
  Debt-to-Equity Ratio                2.03        2.06         2.12    Debt-to-Equity Ratio                   2.11        2.19          2.05
  Return on Equity                  68.44%     66.00%       57.28%     Return on Equity                    75.23%      69.39%        39.61%
  Sales per Employee                     --          --   $196,674     Sales per Employee                        --          --     $176,707
  Profit per Employee                    --          --     $23,539    Profit per Employee               $234,860     $234,860       $45,933
  Sales Growth                      10.79%     10.26%        8.82%     Sales Growth                        23.79%      25.28%        10.84%
  Profit Growth                     18.22%     18.22%       28.51%     Profit Growth                       35.14%      35.14%        37.89%

 Source: Profit Cents

                                                                                           Technology, Media & Telecom Industry News | Winter 2022 | Page 9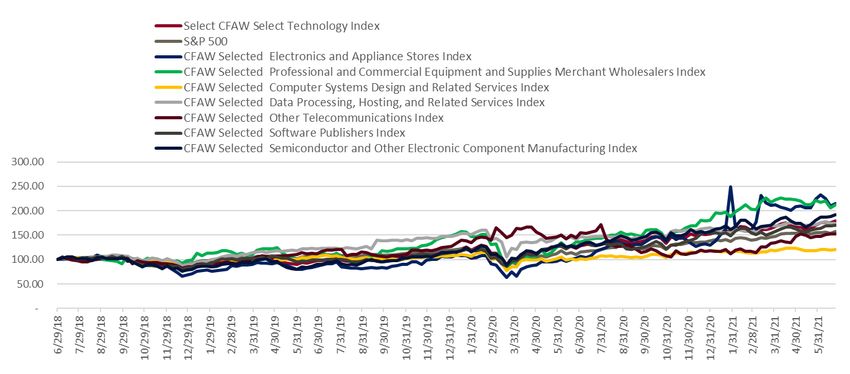
Industry Metrics
Industry Financial Data and Ratios
NAICs 5179 - Other Telecommunications                                   NAICs 5112 - Software Publishers

  Financial Metric            Last12Mo       2021         2020            Financial Metric              Last12Mo       2021        2020
  Current Ratio                      1.96         1.98           2.8      Current Ratio                         2.8         2.78          3.7
  Gross Profit Margin             52.00%       50.70%       56.25%        Gross Profit Margin                79.56%      78.55%      75.83%
  Net Profit Margin               12.24%       11.85%        8.09%        Net Profit Margin                  11.06%       9.42%      -0.96%
  Accounts Receivable Days          37.62         38.2        47.58       Accounts Receivable Days            61.61       64.69        62.33
  Accounts Payable Days              75.4        73.85        53.76       Accounts Payable Days               62.49       57.56        92.85
  Debt-to-Equity Ratio               1.32         1.34         2.35       Debt-to-Equity Ratio                 0.95         0.93        1.86
  Return on Equity                55.28%       52.70%       58.41%        Return on Equity                   32.26%      38.10%      17.14%
  Sales per Employee                    --           --   $136,616        Sales per Employee               $196,039    $196,039            --
  Profit per Employee                   --           --    ($3,184)       Profit per Employee               $29,800     $29,800            --
  Sales Growth                    12.66%       12.66%        1.08%        Sales Growth                        7.72%      12.18%      18.77%
  Profit Growth                   53.39%       53.39%       26.77%        Profit Growth                      72.03%      72.03%      25.70%

NAICs 3344 - Semiconductor & Other Electronic Component Manufacturing

  Financial Metric            Last12Mo       2021         2020
  Current Ratio                       4.23        4.39         3.42
  Gross Profit Margin              31.29%      31.38%       37.29%
  Net Profit Margin                -1.14%       -1.10%       5.11%
  Accounts Receivable Days          50.15        50.15        51.94
  Accounts Payable Days             39.67        39.27        41.44
  Debt-to-Equity Ratio                1.63        1.59         1.32
  Return on Equity                 27.05%      26.16%       24.53%
  Sales per Employee             $105,183     $105,183    $107,228
  Profit per Employee              $8,194       $8,194     $13,861
  Sales Growth                     -5.07%       -7.56%       1.28%
  Profit Growth                    33.98%      20.91%       23.60%

 Source: Profit Cents

                                                                                             Technology, Media & Telecom Industry News | Winter 2022 | Page 10
Transaction Highlights
Technology, Media & Telecom Industry News | Winter 2022 | Page 11Notable Transactions
In December 2021, Oracle Corp entered into a definitive agreement to acquire Cerner Corp for US$27.8 billion in
cash, via tender offer. Under the terms of agreement, Oracle Corp will pay US$95 in cash for every share of
Cerner Corp. The transaction will be funded through sufficient cash and available lines of credit. Cerner Corp is
located in North Kansas City, Missouri, United States and provides healthcare information technology
solutions, healthcare devices and related services.
In December 2021, Thoma Bravo LP entered into a definitive agreement to acquire Bottomline Technologies Inc
for US$2.6 billion in cash. Under the terms of the transaction, Thoma Bravo LP will pay US$57 in cash per share
to the shareholders of Bottomline Technologies Inc, which represents a premium of approximately 42% to
Bottomline’s unaffected closing stock price on October 19, 2021. Bottomline Technologies Inc is located in
Portsmouth, New Hampshire, United States and provides software and support services for automated money
processing for banks.
In December 2021, Kohlberg Kravis Roberts & Co LP entered into a definitive agreement to acquire Yayoi Co Ltd
from ORIX Corp for an undisclosed amount. Yayoi Co Ltd is located in Tokyo, Japan and develops and
distributes business software products.
In December 2021, Permira Advisers LLP, a subsidiary of Permira Holdings Ltd, entered into a definitive
agreement to acquire Mimecast Ltd for GBP5.4 billion (US$4 billion) in cash. The transaction will be funded by
Blackstone Credit and Ares Management Corp. Mimecast Ltd is located in London, Greater London, United
Kingdom and provides cloud security and risk management services for corporate information and email.
The logos shown on this page are property of the respective owners
Technology, Media & Telecom Industry News | Winter 2022 | Page 12Select M&A Transactions
Enterprise
Date Target Name Acquirer Name Value (MM) Revenue EBITDA
12/20/2021 Cerner Corp. Oracle Corp. 28,814 5,708 1,457
12/17/2021 Bottomline Technologies, Inc. Thoma Bravo LP 2,602 483 45
12/17/2021 Yayoi Co., Ltd. Kohlberg Kravis Roberts & Co. LP 2,110 186 NM
12/7/2021 Mimecast Ltd. Permira Advisers LLP 5,198 546 125
11/30/2021 Griid Infrastructure LLC Adit Edtech Acquisition Corp. 3,035 NM NM
11/24/2021 Etraveli AB Booking Holdings, Inc. 1,836 NM NM
Hellman & Friedman LLC; Bain Capital Life Sciences LP; athenahealth, Inc.
11/22/2021 athenahealth, Inc. 17,273 NM NM
/Private Group 2/
11/22/2021 ProKarma, Inc. Concentrix Corp. 1,575 NM NM
11/18/2021 Bitdeer Technologies Holding Co. Blue Safari Group Acquisition Corp. 4,000 NM NM
11/15/2021 Encora Digital, Inc. Advent International Corp. 1,500 NM NM
11/9/2021 Wolt Enterprises Oy DoorDash, Inc. 7,607 NM NM
Advent International Corp.; Permira Advisers LLP; GIC Special Investments
Pte Ltd.; Abu Dhabi Investment Authority (Private Equity); Canada Pension
11/8/2021 McAfee Corp. 13,547 2,177 642
Plan Investment Board Private /US/; Crosspoint Capital Partners LP; McAfee
Corp. /Private Group/
10/28/2021 Momentive Global, Inc. Zendesk, Inc. 4,141 427 -33
10/18/2021 Sirius Computer Solutions, Inc. CDW Corp. 2,500 2,040 NM
10/17/2021 Playtech Plc Aristocrat Leisure Ltd. 3,608 1,159 238
10/11/2021 Aspen Technology, Inc. Emerson Electric Co. 8,653 730 391
($ in millions) Source: Factset
Technology, Media & Telecom Industry News | Winter 2022 | Page 13Public Companies
Technology, Media & Telecom Industry News | Winter 2022 | Page 14Industry Performance
CFAW Select Technology Index
Source: FactSet
Technology, Media & Telecom Industry News | Winter 2022 | Page 15Public Comparables
Electronics and Appliance Stores
Company Share Shares Market Enterprise Revenues EBITDA Enterprise Value /
$USD in Millions Price O/S Cap Value (LTM) (LTM) Revenues EBITDA
Best Buy Co., Inc. $101.60 241 $24,441 $24,788 $52,333 $4,198 0.5x 5.9x
Brimag Digital Age Ltd $12.47 10 $126 $163 $161 $26 1.0x 6.2x
Com7 Public Co. Ltd. $2.45 1,200 $2,937 $3,016 $1,470 $108 2.1x 28.0x
Copperwired Public Co. Ltd. $0.18 600 $110 $109 $128 $7 0.9x 15.5x
ePlus inc. $53.88 27 $1,456 $1,476 $1,634 $134 0.9x 11.1x
Frontier Developments Plc $24.11 39 $950 $928 $142 $50 6.6x 18.7x
GameStop Corp. Class A $148.39 76 $11,330 $10,545 $5,879 ($100) 1.8x NM
PC Depot Corporation $2.71 53 $143 $96 $330 $24 0.3x 3.9x
Syscom Computer Engineering Co.,
$1.05 100 $105 $101 $208 $13 0.5x 7.9x
Ltd.
Paltek Corporation NM NM NM NM $282 $4 NM NM
Mean $4,580 $6,257 $446 1.6x 12.2x
Median $928 $306 $25 0.9x 9.5x
Source: FactSet
Technology, Media & Telecom Industry News | Winter 2022 | Page 16Public Comparables
Professional,Commercial Equipment, Supplies Merchant Wholesalers
Company Share Shares Market Enterprise Revenues EBITDA Enterprise Value /
$USD in Millions Price O/S Cap Value (LTM) (LTM) Revenues EBITDA
Action S.A. $3.64 20 $73 $63 $593 $26 0.1x 2.4x
Argo Blockchain Plc $1.32 468 $620 $586 $52 $33 11.2x 17.8x
D-Link Corporation $0.69 600 $412 $321 $547 $16 0.6x 20.5x
Digiworld Corp. $5.44 88 $481 $503 $741 $19 0.7x 27.0x
Dyntek, Inc. $19.00 2 $43 $196 $10 NM NM
NM
Intevac, Inc. $4.71 25 $116 $79 $73 ($12) 1.1x NM
Paragon Technologies, Inc. $6.80 2 $11 $20 $132 $8 0.1x 2.5x
ScanSource, Inc. $35.08 26 $900 $1,062 $3,251 $126 0.3x 8.5x
SoftwareONE Holding Ltd. $21.63 159 $3,429 $2,886 $8,994 $192 0.3x 15.0x
TD SYNNEX Corporation $114.36 96 $10,929 $14,072 $23,417 $1,001 0.6x 14.1x
Mean $2,177 $3,800 $142 1.7x 13.5x
Median $503 $570 $22 0.6x 14.5x
Source: FactSet
Technology, Media & Telecom Industry News | Winter 2022 | Page 17Public Comparables
Computer Systems Design and Related Services
Company Share Shares Market Enterprise Revenues EBITDA Enterprise Value /
$USD in Millions Price O/S Cap Value (LTM) (LTM) Revenues EBITDA
Amdocs Limited $74.84 125 $9,327 $9,285 $4,289 $768 2.2x 12.1x
Beyondsoft Corporation Class A $1.83 577 $1,058 $892 $769 NM 1.2x NM
CDW Corp. $204.78 136 $27,793 $32,114 $20,240 $1,628 1.6x 19.7x
Cerner Corporation $92.87 292 $27,138 $28,192 $5,708 $1,457 4.9x 19.4x
Cognizant Technology Solutions
$88.72 525 $46,600 $45,865 $17,914 $3,118 2.6x 14.7x
Corporation Class A
Jack Henry & Associates, Inc. $166.99 74 $12,364 $12,443 $1,794 $715 6.9x 17.4x
NetScout Systems, Inc. $33.08 74 $2,444 $2,386 $844 $158 2.8x 15.1x
Perficient, Inc. $129.29 33 $4,259 $4,425 $709 $128 6.2x 34.6x
Science Applications International
$83.59 57 $4,760 $7,371 $7,329 $683 1.0x 10.8x
Corp.
VeriSign, Inc. $253.82 111 $28,194 $28,783 $1,308 $897 22.0x 32.1x
Mean $17,176 $6,090 $1,061 5.1x 19.5x
Median $10,864 $3,042 $768 2.7x 17.4x
Source: FactSet
Technology, Media & Telecom Industry News | Winter 2022 | Page 18Public Comparables
Data Processing, Hosting, and Related Services
Company Share Shares Market Enterprise Revenues EBITDA Enterprise Value /
$USD in Millions Price O/S Cap Value (LTM) (LTM) Revenues EBITDA
Alliance Data Systems Corporation $66.57 50 $3,314 $16,116 $4,306 $1,841 3.7x 8.8x
Automatic Data Processing, Inc. $246.58 421 $103,905 $105,706 $15,367 $3,968 6.9x 26.6x
Blucora, Inc. $17.32 49 $844 $1,252 $862 $116 1.5x 10.8x
Computer Services, Inc. $53.20 28 $1,477 $1,405 $299 $94 4.7x 14.9x
Dropbox, Inc. Class A $24.54 310 $7,605 $10,212 $2,097 $422 4.9x 24.2x
Equinix, Inc. $845.84 90 $76,160 $89,831 $6,519 $4,485 13.8x 20.0x
FactSet Research Systems Inc. $486.01 38 $18,370 $18,504 $1,628 $598 11.4x 31.0x
Global Payments Inc. $135.18 290 $39,223 $48,299 $8,260 $3,500 5.8x 13.8x
IDE Group Holdings Plc $0.02 497 $8 $30 $34 $3 0.9x 11.7x
Rackspace Technology, Inc. $13.47 210 $2,829 $6,603 $2,948 $526 2.2x 12.6x
Mean $29,796 $4,232 $1,555 5.6x 17.4x
Median $13,164 $2,522 $562 4.8x 14.4x
Source: FactSet
Technology, Media & Telecom Industry News | Winter 2022 | Page 19Public Comparables
Other Telecommunications
Company Share Shares Market Enterprise Revenues EBITDA Enterprise Value /
$USD in Millions Price O/S Cap Value (LTM) (LTM) Revenues EBITDA
Alliance Creative Group, Inc. $0.28 1 $0 $2 $11 $0 0.2x 11.6x
Cogent Communications Holdings Inc $73.18 48 $3,489 $4,401 $586 $200 7.5x 22.1x
KonaTel, Inc. $1.75 41 $72 $71 $12 $1 6.2x 55.3x
Liberated Syndication Inc. $3.56 35 $125 $117 $25 $5 4.7x 23.0x
LiveWorld, Inc. $0.18 46 $8 $5 $10 $1 0.5x 6.3x
Mean $919 $129 $41 3.8x 23.6x
Median $71 $12 $1 4.7x 22.1x
Source: FactSet
Technology, Media & Telecom Industry News | Winter 2022 | Page 20Public Comparables
Software Publishers
Company Share Shares Market Enterprise Revenues EBITDA Enterprise Value /
$USD in Millions Price O/S Cap Value (LTM) (LTM) Revenues EBITDA
Bentley Systems, Incorporated Class B $48.33 271 $13,085 $14,811 $913 $170 16.2x 86.9x
Citrix Systems, Inc. $94.59 125 $11,798 $14,857 $3,176 $711 4.7x 20.9x
Digital Turbine, Inc. $60.99 97 $5,893 $6,075 $706 $101 8.6x 60.1x
Electronic Arts Inc. $131.90 283 $37,302 $37,275 $6,475 $1,492 5.8x 25.0x
Fortinet, Inc. $359.40 163 $58,762 $56,730 $3,127 $676 18.1x 83.9x
McAfee Corp. Class A $25.79 183 $4,711 $12,321 $2,177 $642 5.7x 19.2x
Palo Alto Networks, Inc. $556.76 99 $54,934 $55,439 $4,558 ($4) 12.2x NM
Paycom Software, Inc. $415.19 60 $24,922 $21,917 $991 $333 22.1x 65.8x
Tyler Technologies, Inc. $537.95 41 $22,043 $23,235 $1,442 $332 16.1x 70.0x
VMware, Inc. Class A $115.88 420 $48,712 $47,862 $12,614 $3,464 3.8x 13.8x
Mean $29,052 $3,618 $792 11.3x 49.5x
Median $22,576 $2,652 $488 10.4x 60.1x
Source: FactSet
Technology, Media & Telecom Industry News | Winter 2022 | Page 21Public Comparables
Semiconductor and Other Electronic Component Manufacturing
Company Share Shares Market Enterprise Revenues EBITDA Enterprise Value /
$USD in Millions Price O/S Cap Value (LTM) (LTM) Revenues EBITDA
Advanced Micro Devices, Inc. $143.90 1,208 $173,775 $170,749 $14,852 $3,466 11.5x 49.3x
CMC Materials, Inc. $191.69 28 $5,447 $6,208 $1,200 $358 5.2x 17.3x
First Solar, Inc. $87.16 106 $9,267 $7,810 $2,625 $614 3.0x 12.7x
Intel Corporation $51.50 4,067 $209,451 $215,120 $78,474 $34,516 2.7x 6.2x
LightPath Technologies, Inc. Class A $2.44 27 $66 $77 $38 $1 2.0x 113.6x
Micron Technology, Inc. $93.15 1,120 $104,307 $102,351 $29,619 $14,956 3.5x 6.8x
Monolithic Power Systems, Inc. $493.33 46 $22,739 $22,003 $1,104 $258 19.9x 85.4x
NVIDIA Corporation $294.11 2,500 $735,275 $728,392 $24,274 $10,259 30.0x 71.0x
Semtech Corporation $88.93 64 $5,730 $5,641 $715 $157 7.9x 35.9x
Texas Instruments Incorporated $188.47 924 $174,057 $172,014 $17,588 $9,245 9.8x 18.6x
Mean $143,036 $17,049 $7,383 9.5x 41.7x
Median $62,177 $8,739 $2,040 6.5x 27.3x
Source: FactSet
Technology, Media & Telecom Industry News | Winter 2022 | Page 22Public Vs. Private Comparables
Valuation Premiums Can Be Considerable
Regardless of industry, publicly traded companies often trade at premium valuations to privately held companies.
This is reflected in M&A transactions and can lead to unrealistic value expectations for some business owners. The
chart below illustrates this variance and shows that the variance has been both long term and growing.
Transactions between private buyer and private seller tend to be small by comparison and thus do not benefit from
a “size” premium that is associated with transactions in general. While this chart does not breakout private equity
transactions, our analysis indicates those transactions usually fall between public and private and move closer to
public as size increases.
Technology, Media & Telecom Industry News | Winter 2022 | Page 23CFA Overview
Technology, Media & Telecom Industry News | Winter 2022 | Page 24About CFA
Who We Are / What We Do
Corporate Finance Associates (CFA) is an independent
inter- national investment banking firm serving middle-
market businesses. For over 60 years Corporate Finance
Sell-Side Advisory Capital Markets Buy-Side Advisory
Associates has been advocating on behalf of business
owners who are restructuring a company, either through Whether as a divestiture Our commitment to remaining Growth through acquisition is a
strategy or a recapitalization independent from any complex process. It involves
divestiture, merger, acquisition or recapitalization.
strategy selling all or part of a investment or lending affiliates strategy, planning, critical
Combining the knowledge and leverage of a larger bank business requires equal parts ensures that we deliver unbiased analysis, coordination and
with the customer focused detail of a boutique firm, creative think- ing, critical guidance. It also promotes negotiation. When you want to
analysis, expert advice, sound maximum competition among take advantage of the fast growth
from inception to completion, our senior principals
planning and flawless execution. lending sources, helping to fully offered by a consolidation or roll-
provide hands-on expertise to clients buying, selling or Having the right team of leverage value for our clients. up, CFA’s broad reach, sources of
recapitalizing a business. investment banking Our role is to help you raise the financing and efficient closings
professionals working for you is type of capital that best fits your can help you achieve your
critical to ensure success. needs. business growth goals.
This Technology, Media & Telecom Industry Practice Group
was established to draw on the experience of CFA advisors,
many of whom as former business owners and CEOs,
have first-hand knowledge and have completed many
transactions in this industry. Working with your local CFA
representative, you can be sure that the collective wealth
of knowledge is available to every CFA client. Financial Advisory Exit Planning Business Valuation
Now that you have made the Every business will ultimately “What is my business worth” is a
decision to raise capital for your undergo a transfer via sale or question we often hear from
business, choosing the right merger, a charitable donation, a business owners contemplating a
investment banker is critical. transfer to a child or relative or business sale, merger or
Whether you are buying out a even bankruptcy, liquidation or recapitalization. Answering this
partner, financing an acquisition death. Every ownership transfer question depends on many
or seeking growth capital, CFA is carries with it a unique set of factors, including the business
the right choice to help you consequences and the best valuation methods that are
achieve your financing goals consequences usually begin with employed in the calculation.
a clearly defined exit plan.
Technology, Media & Telecom Industry News | Winter 2022 | Page 25Regional Service, Global Reach
Where We Are
With offices across the USA and in Mexico, India, Austria Belgium, Denmark, France, Germany, Ireland, Italy, Netherlands,
Portugal, Switzerland and the United Kingdom providing middle-market companies with a wide range of M&A, financial
advisory services and access to capital resources.
Technology, Media & Telecom Industry News | Winter 2022 | Page 26Delivering Results
Drive Creativity Knowledge
Making it Happen Fresh Solutions Sorting Out Noise
Beyond taking initiative, We achieve superior We serve you best when
the CFA team embodies a results by interpreting we work across external
competitive spirit. It is information differently and internal boundaries
manifested in our drive to from others in our and use our collective
find new opportunities to industry. In today’s knowledge from national
get the job done. We market it is not enough to and international offices
believe that persistence follow precedents; one to manage the outcome
and tenacity are positive must build on the firm’s of complex transactions
values. They guide us in foundation and produce in your favor.
our work for you. creative solutions
through imaginative and
original work.
Founded in 1956 • 70 Managing Directors • 37 Offices Worldwide • Billions in M&A Transactions
Technology, Media & Telecom Industry News | Winter 2022 | Page 27Worldwide Transactions
Technology, Media & Telecom Industry News | Winter 2022 | Page 28Industry Practice Groups
Technology, Media & Telecom
Agriculture
Technology, Media & Telecom practice group is comprised
Aerospace/Defense/Government
of accomplished dealmakers with extensive experience in
advising both public and private companies in the Business Services
industry. These dealmakers offer expert service in
Commercial Real Estate
acquisitions, divestitures, financing, and strategic planning
to a wide range of companies operating in multiple Consumer Retail
subsectors including: Energy
Engineering/Construction
Technology
Equipment
• IT Services & Business Process Outsourcing
• Servers, Equipment & Systems Financial Services
• Semiconductors Food/Beverage
• Software, including embedded applications Healthcare
• Web, Mobile and Social Network Applications & Services
Hospitality/Leisure
Media
Industrials
• Broadcasting & Entertainment
• Digital Marketing & Media Metal Fabrication
• Diversified Media & Publishing Plastics/Rubber
Telecommunications Print/Packaging
• Broadband Networks
Semi Conductor
• Maritime Communications
Technology/Media/Telecom
• Satellite Communications
• Wireless & Wireline Communications Transportation/Logistics/Supply Chain
• Content Delivery Networks Wholesale Distribution
Technology, Media & Telecom Industry News | Winter 2022 | Page 29Recent Industry Transactions
Technology, Media & Telecom Industry News | Winter 2022 | Page 30You can also read