Technology for extracting instant coordinates of sea vessels in a selected part of the World Ocean from online maps
←
→
Page content transcription
If your browser does not render page correctly, please read the page content below

Journal of Physics: Conference Series

PAPER • OPEN ACCESS

Technology for extracting instant coordinates of sea vessels in a
selected part of the World Ocean from online maps
To cite this article: E A Kuzhbanova and S V Porshnev 2020 J. Phys.: Conf. Ser. 1679 032053

View the article online for updates and enhancements.

                             This content was downloaded from IP address 212.193.94.28 on 23/07/2021 at 06:52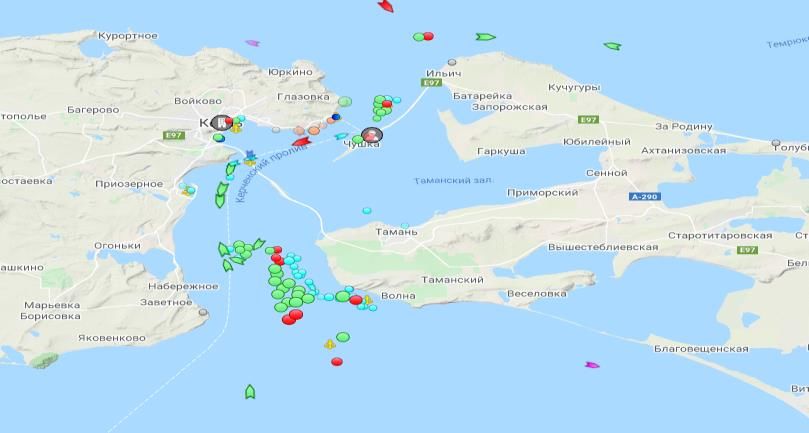
APITECH II                                                                                                      IOP Publishing
Journal of Physics: Conference Series                         1679 (2020) 032053          doi:10.1088/1742-6596/1679/3/032053

Technology for extracting instant coordinates of sea vessels in
a selected part of the World Ocean from online maps

                     Е А Kuzhbanova1 and S V Porshnev1,2
                     1
                       The Institute of Radioelectronics and Information Technologies, Ural Federal
                     University, Mira st. 32, Yekaterinburg, 620002, Russia
                     2
                       N.N. Krasovskii Institute of Mathematics and Mechanics of the Ural Branch of the
                     Russian Academy of Sciences

                     E-mail: kuzhbanova.elena@urfu.ru

                     Abstract. The article describes a technology that provides the extraction of instant coordinates
                     of sea vessels in a selected part of the World Ocean from free online maps and its software
                     implementation, consisting of two MATLAB functions: RecognizeText.m and
                     ComporationImage.m. The first function returns the recognized ship names on the electronic
                     chart and the coordinates of the rectangles described around the given names. The second
                     function is the values of the coordinates of the ships, calculated from the analysis of online map.
                     Current results confirm the performance of the developed software.

1. Introduction
Sea freight is one of the most important components of foreign economic activity of states, where ports
are global transport and logistics providers providing freight traffic [1]. Considering the number of ships
carrying out simultaneous movement in the world water space between ports of different countries,
monitoring the movement of ships is an important task.
    This task is of relevance in the sea straits, where congestion of many ships is possible. This is
confirmed by a typical snapshot of an online map of the Kerch Strait connecting the Black and Azov
seas. Here the markers correspond to the positions of the GPS signal sources. The type of marker
depends on whether the ship is moving (flag) or waiting to pass (circle). The color of the marker is
determined by the type of the given vessel, for example, green - cargo ships, blue - tug, red - tanker.
    Figure 1 shows that at the selected time there are congestions of number of ships awaiting passage
through the Kerch Strait in both directions. It is possible to solve the problem of optimizing the
movement of ships in sea straits with the help of automated control systems for the movement of ships
(STCS), designed, inter alia, to ensure traffic safety [2]. Therefore, the development of mathematical
and software STCS is the object of research by various authors [3-5]. It is obvious that the development
of adequate mathematical models describing the movement of ships and their software implementations
requires the use of the results of the analysis of statistical information on the movement of ships in the
selected area of the World Ocean. The necessary information can be obtained from known sites (see, for
example, [6-9]). On these sites, the current information about the movement of sea vessels, obtained
from various identification systems, is visualized.

              Content from this work may be used under the terms of the Creative Commons Attribution 3.0 licence. Any further distribution
              of this work must maintain attribution to the author(s) and the title of the work, journal citation and DOI.
Published under licence by IOP Publishing Ltd                          1
APITECH II                                                                                  IOP Publishing
Journal of Physics: Conference Series           1679 (2020) 032053    doi:10.1088/1742-6596/1679/3/032053

                                                      Figure 1. An instant snapshot of the online map
                                                      with images of ships.

   A comparative analysis of the functionality of these sites and the structure of the information
displayed on them made it possible to conclude that their interfaces provide users with approximately
the same opportunities to access information. As a rule, on these sites in the public domain on the
electronic map of the selected area of the World Ocean, the location of the ships is displayed, and when
you move the mouse pointer over the corresponding ship marker, the screen displays partial information
about this vessel (ship name, port of destination, dimensions). At the same time, saving this and more
detailed information about the movement of ships in a file is possible only with a paid subscription.
After authorization and connection of the subscription on the site, it becomes possible to turn on the
layer with the display of the destination port or coordinate grid.
   Therefore, the development of alternative methods that ensure the extraction of information from
electronic maps that are in the public domain, in order to form a database on the movement of ships in
the selected area of the World Ocean and its further use for scientific research is relevant.
   The article substantiates the principles of extracting information about ships from a real-time map
and describes a software tool based on these principles.

2. Analysis of sources of primary information
The MarineTraffic [7] website was chosen as a source of information, which without additional
authorization or subscription provides the user with more information than sites [6,8,9]. An example of
displaying information about a ship selected on the map is shown in figure 2.

                                                                          Figure 2. Display of text
                                                                          information about the selected
                                                                          ship.

   Figure 2 shows that when choosing the appropriate scale of the map, not only ship markers are
displayed on it, but also their names. In addition, the text box displays ship name, ship type (tanker, tug,
passenger ship, etc.), ship status and course. Also information about the coordinates of the GPS
transmitter located on the ship is displayed on the map in a test form and they are measured in angular
degrees, minutes, seconds and fractions of a second, as well as the results of their conversion into the
corresponding decimal values.
   This information is available about each of the ships located in a selected part of the World Ocean,
which could be useful for the purposes of further scientific research. Therefore, it was decided to develop

                                                      2
APITECH II                                                                                  IOP Publishing
Journal of Physics: Conference Series           1679 (2020) 032053    doi:10.1088/1742-6596/1679/3/032053

a tool that provides automatic extraction of this information from online real-time maps that are freely
available.

3. Algorithm for analysis of primary information
Consider a frame of an online real-time map of a selected area of the World Ocean, shown in figure 2.
   Figure 2 shows that when visualization of ships and their names, the following rules are used:

    •    the name of the ship is placed to the right of its marker;
    •    the name of the ship is located along a straight line parallel to the abscissa;
    •    the ordinates of the center of gravity of the marker and each of the letters of the ship's name are
         the same;
    •    the name of the ship is placed near the vessel marker.

  Therefore, this algorithm can be used to determine the values of the ship coordinates on a real-time
map:
  Recognize each of the ship names on the available fragment of the online map.

    •    Calculate the coordinates of rectangles circumscribed around the appropriate ship names.
    •    Calculate the coordinates of the midpoint of the vertical side of the rectangle closest to the ship
         marker.
    •    Calculate the distance from the point in step 3 to the ship marker point.
    •    Take the coordinates of the point selected in item 4 as the ship's coordinates.

4. Software tool for map analysis
 At the first stage of the automatic algorithm for extracting the coordinates of ships, described in the
previous section, it is necessary to solve the problem of automatic text recognition on an electronic
image of a map of a selected fragment of the World Ocean. Nowadays there are special software tools
from various manufacturers for recognizing text on images. Therefore, a comparative analysis of the
quality of recognition of ship names on real-time electronic maps was carried out. In this thesis were
considered free computer program Tesseract, which supports, starting from version 3.0 [3] [4], text
recognition in Russian, as well as a software library for optical character recognition (Optical Character
Recognition − OCR), which has implementations in the programming languages Python and C ++, and
also in the MATLAB package in the form of the OCR Trainer software library.
    It turned out that the quality of recognition of ship names on electronic maps using the Tesseract
computer program is lower than the OCR software library. At the same time, the OCR Trainer provides
the user with a fairly wide functionality for working with images, building various graphs, and also
provides the ability to compile a custom dictionary that can be used to exclude some characters that are
recognized as text but are not text. Considering that we used the OCR Trainer while developing
automatic recognition of the coordinates of ships on electronic maps. The example illustrating the results
of analyzing an electronic map using the OCR Trainer is shown in figure 3.
                            Table 1. The enlarged fragments of parts of the
                            map, highlighted by dotted rectangles in figure 3.
                             Fragment number           Enlarged fragment
                                   1                      ‘ ’ Mitridat
                                   2                  Kapitan Cheremnykh
                                   3                       ._; Rb 391
                                   4                        Merkurly
                                   5                      / “ Karadag
                                   1                      ‘ ’ Mitridat

                                                      3
APITECH II IOP Publishing
Journal of Physics: Conference Series 1679 (2020) 032053 doi:10.1088/1742-6596/1679/3/032053
The enlarged fragments of parts of the map, highlighted by dotted rectangles in figure 3, are presented
in table 1.
Figure 3. The result of the analysis of
the electronic map using the OCR
Trainer (the text recognized by the
program is displayed in the yellow
rectangles).
Figure 3 and table 1 show that horizontally located text and text written along a straight line passing
at an angle to the boundaries of the original fragment of the electronic map are recognized. t is not
difficult to exclude italic text from consideration, knowing the coordinates of the vertices of the
rectangles described around the names of the ships. We also note that on fragments No. 1, 3 and 5 the
ship's symbols was recognized as a text, which should be further excluded from consideration.
To calculate the coordinates of ships on an electronic map, based on the results of recognizing the
names of ships using the OCR Trainer in the MATLAB package, the m-function RecognizeText.m was
implemented, the input of which is sequential images of the electronic map. The RecognizeText.m
function returns the text recognized on the map and the coordinates of the rectangles described around
the recognized text. Then, this information is passed to the ComporationImage.m function, which returns
a table containing the name of the ship, the position of the ship and the time at which these coordinates
were determined. A fragment of the table is shown in figure 4.
Figure 4. Resulting table.
The results of comparing the values of the coordinates of ships, calculated using the developed tool,
and data with the corresponding GPS-coordinates are discussed in the next section.
5. Confirmation of the functionality of the developed software tool
To confirm the performance of the developed algorithm, we will consider the results of automatic
determination of the coordinates of ships moving in the water area of the Kerch Strait.
Figure 5 shows a map with a scale of 1 km, on which the names of ships and their coordinates,
presented in table 2, were automatically found.
4APITECH II IOP Publishing
Journal of Physics: Conference Series 1679 (2020) 032053 doi:10.1088/1742-6596/1679/3/032053
Figure 5. Fragment of the
map used to test the
developed software tool.
Table 2. Automatically found ship names and coordinates.
Coordinates calculated from an
GPS - coordinates
Ship name electronic map
Latitude Longitude Latitude Longitude
Vladimir L 45.3001 036.4797 45.3002 036.4797
Vostok 45.3081 036.5027 45.3082 036.5026
Mitridat 45.3162 036.5140 45.3162 036.5140
Ruzgar Bay 45.3398 036.6358 45.3400 036.6357
Volzskiy 40 45.3443 036.6236 45.3443 036.6234
Alevtin S 45.3499 036.6419 45.3499 036.6417
Alice 45.3527 036.6501 45.3527 036.6497
Imanta 45.3442 036.6647 45.3442 036.6645
Table 2 shows that the error in calculating the coordinates is 0.01% and is associated with rounding
off the values of the variables in the calculations.
Figure 6 shows a fragment of the map, with superimposed on it the trajectory of the ship "Scola",
built using GPS-coordinates and coordinates calculated from the analysis of 5 consecutive real-time
maps recorded with a step of 20 minutes.
Figure 6. Trajectories of the vessel «Scala»
built based on the use of GPS-coordinates and
coordinates calculated during the analysis of
electronic maps.
Figure 6 shows that the trajectories of the vessel, built using GPS coordinates and coordinates
calculated in the analysis of real time maps, are close to each other. These results are evidenced by the
efficiency of the developed software tool.
6. Express analysis of data obtained using the developed software tool
Consider the results of the analysis of information on the movement of ships in the Kerch Strait region
from 3 to 9 August 2020. Information is extracted from online maps using a software tool developed by
5APITECH II IOP Publishing
Journal of Physics: Conference Series 1679 (2020) 032053 doi:10.1088/1742-6596/1679/3/032053
the authors. We used Microsoft's comprehensive business analysis software Power BI, which provides
the user with tools to analyze data and visualize its results.
In the period from 3 to 9 August 2020, 326 ships passed through the Kerch Strait. The distribution
of ships by their waiting time for passage through the Kerch Strait at a selected time interval is shown
in a diagram in figure 7.
Figure 7. Distribution of the waiting time of
ships before the passage of the Kerch Strait
in the period from 3 to 9 August 2020.
Figure 7 shows that 55% (186) of ships were waiting for passage through the Kerch Strait less than
one hour, while 19.1% (64) of ships were waiting for passage more than 24 hours, and 3.8% (13) of
ships were more than 10 hours.
Knowing the coordinates of the ships, it is possible to track the direction of their movement through
the strait and count the number of ships that passed from the Black Sea to the Sea of Azov and back
(figure 8).
Figure 8. Number of ships and their
direction of movement.
Figure 8 shows that of the 326 ships that passed through the Kerch Strait in the period from 3 to 9
August 2020, 179 ships moved in the direction of the Azov Sea and 147 of the Black Sea.
Also, based on information extracted from electronic maps, it is possible to analyze the dynamics of
the number of ships in the selected port. This is confirmed by figure 9, which shows the dependence of
the number of ships in the port of Kerch in the period from 3 to 9 August 2020.
Figure 9 shows that the largest number of ships in the port of Kerch for the selected period appeared
at 11:30 (7 ships) and at 17:30 (8 ships).
A more detailed analysis of data on the movement of ships in the Kerch Strait is the subject of
subsequent publications.
6APITECH II IOP Publishing
Journal of Physics: Conference Series 1679 (2020) 032053 doi:10.1088/1742-6596/1679/3/032053
Figure 9. Dependence of the number of ships on the time of day.
7. Conclusion
The paper proposes a technology for extracting information from electronic maps of a selected part of
the World Ocean, and its software implementation. This technology is based on the recognition of ship
names displayed on online maps of the movement of ships, and on the calculation of the coordinates of
ships based on the values of the coordinates of the vertices of the rectangles described around the
received names. Estimates of the accuracy of calculating coordinates on online maps have been obtained,
indicating that the difference between the calculated values of coordinates and similar values of GPS-
coordinates does not exceed 0.01%.
The availability of the developed technology makes it possible to form a database containing
information on the names of ships in the selected area of the World Ocean and their coordinates at
known times. Further analysis of the information contained in this database will make it possible to
study the features of the movement of ships, including in sea straits. Knowledge of these features will
make it possible to build adequate mathematical models describing the movement of sea vessels, which
are necessary for the development of an automated control system for the movement of sea vessels.
References
[1] Titov A V and Ivashkovich D B 2016 Modern ways of development of the world sea ports and
their influence on the port industry in Russia Vestnik of Astrakhan State Technical University
1 115-24
[2] Golovchenko B S and Grinyak V M 2014 Information system for vessels traffic data
capture Vestnik gosudarstvennogo universiteta morskogo i rechnogo flota imeni admirala s.o.
Makarova 2(24) 156-62
[3] Tam C K and Bucknall R 2010 Collision risk assessment for ships. J. of Marine Science and
Technology 15(3) 257-70
[4] Silveira P A M, Teixeira A P and Guedes S G 2013 Use of AIS data to characterise marine traffic
patterns and ship collision risk off the coast of Portugal J. of Navigation 66 879-98
[5] Grinyak V M, Golovenko B S and Malko V N 2011 Recognition of hazardous situations by vessel
traffic control systems Transport: science, technology, management 8 42-5
[6] Vessel Finder Available online: https://www.vesselfinder.com (accessed on 05.06.2019)
[7] Marine Traffic Available online: https://www.marinetraffic.com (accessed on 01.08.2020)
[8] Shipping Explorer Available online: https://www.shippingexplorer.net/ru (accessed on
05.06.2020)
[9] FleetMon Available online: https://www.fleetmon.com (accessed on 05.06.2020)
7You can also read