ANALYSIS OF 30 -90 BLENDED WINGLET ADDITIONS TO CESSNA 172, PIPER MALIBU, AND BOEING 737 WINGS - NSF DOD REU MILESTONE. AWARD # 1950207 UNDER ...
←
→
Page content transcription
If your browser does not render page correctly, please read the page content below
Analysis of 30°-90° Blended Winglet Additions to Cessna 172,
    Piper Malibu, and Boeing 737 Wings

NSF DoD REU Milestone. Award # 1950207
Under Supervision of Dr. Soloiu and Dr. Rahman

John Crowe
Fernando Ramos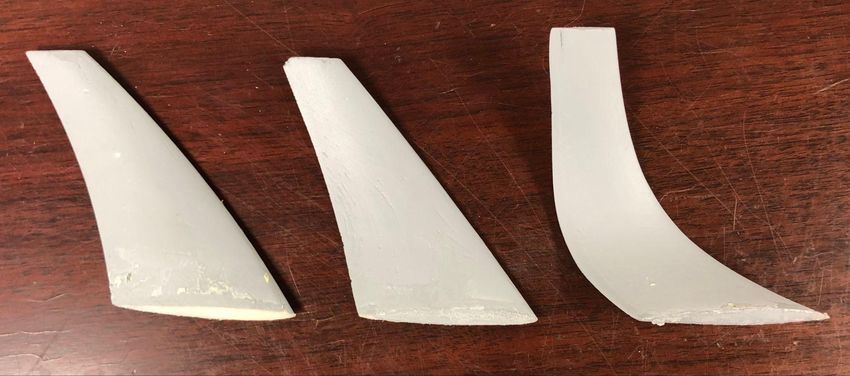
1. Objectives
Contents   2. Background Information

           3. Experimental Methods

           4. Simulations

           5. Results

           6. Conclusions

           7. Acknowledgments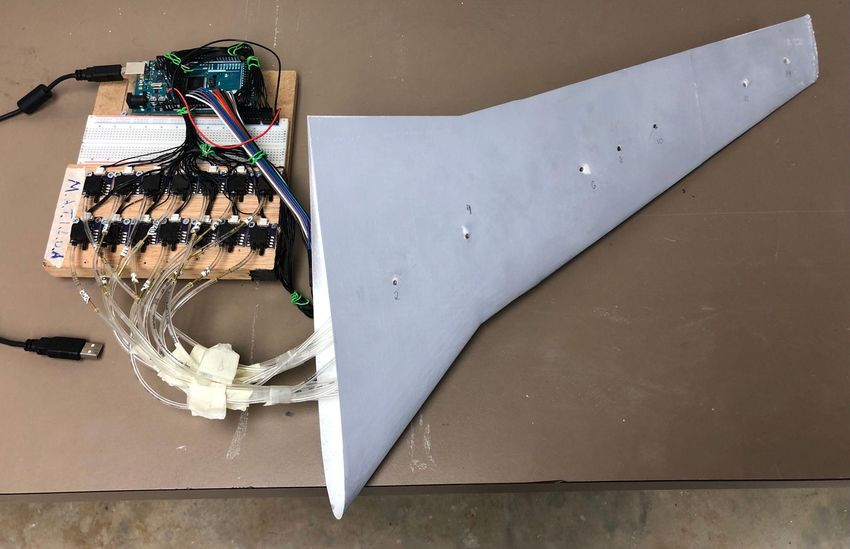
Objectives
●   Gather information that will be helpful for winglet design and optimization.

●   Verify that a blended winglet addition can increase aerodynamic efficiency.

●   Use Computational Fluid Dynamic (CFD) software to find the respective coefficients
    of lift and drag for each wing-winglet configuration.

●   Calculate the coefficients of lift and drag experimentally for comparison.

●   Find the cant angle that creates maximum aerodynamic efficiency for each wing.

●   Discover the structural consequences of winglet additions.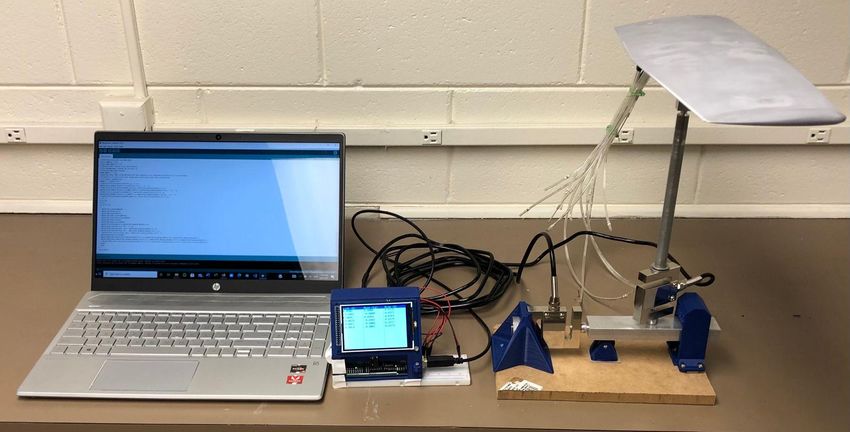
Background Information
1.   There are only 4 forces acting
Aerodynamic                                           on a plane at all times.

Forces
                                                 2.   The aerodynamic efficiency of
                                                      an aircraft can be determined
                                                      by the lift to drag ratio.

                                                 3.   80% of total drag is caused by
                                                      friction and induced drag [2].
                                                       ○   Frictional drag: Due to skin
                                                           friction on the boundary layer.
 Figure 1: Main Forces acting on aircraft [1].
                                                       ○   Induced Drag: Caused by
                                                           wingtip vortices.
1.   The Bernoulli’s Principle says
How is lift                                              that:

generated?                                               “A decrease in pressure results in
                                                         an increase of velocity”

                                               1.    Particles of air are split at the leading
                                                     edge of the airfoil. The particles
                                                     following the path at the top move faster
                                                     than the ones at the bottom.

                                               ●     The faster air stream creates low
                                                     pressure at the top of the wing and the
                                                     slower air stream creates a high pressure
 Figure 2: Airflow speed around airfoil [2].
                                                     below it. This difference creates lift.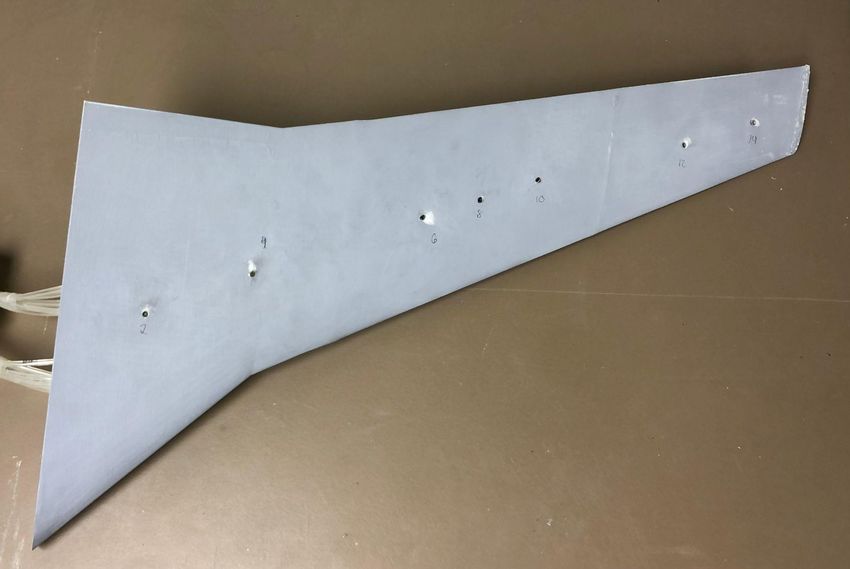
1.   Formed at the tip of a wing due
How are vortices                        to pressure differences
formed?                                 converging.

                                   2.   Cause increased induced drag
                                        due to vortex hitting wing.

                                   3.   Only exist in 3D, real world
                                        cases
                                         ○   Do not exist for 2D, making
   Figure 3: Wingtip vortex [3].
                                             them near impossible to
                                             analyze by hand.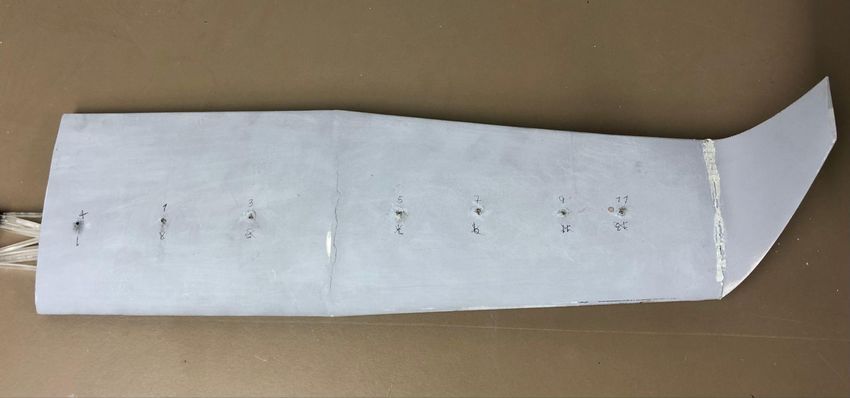
Visualization

Figure 4: Vortex Formation [4].
How do vortices
create induced
drag?
1. Vortex causes a downwash flow
   that tilts the lift vector
   backwards creating induced
   drag.

2. This lowers the fuel efficiency
   of the aircraft.
                                     Figure 5: Induced drag due to vortex [5].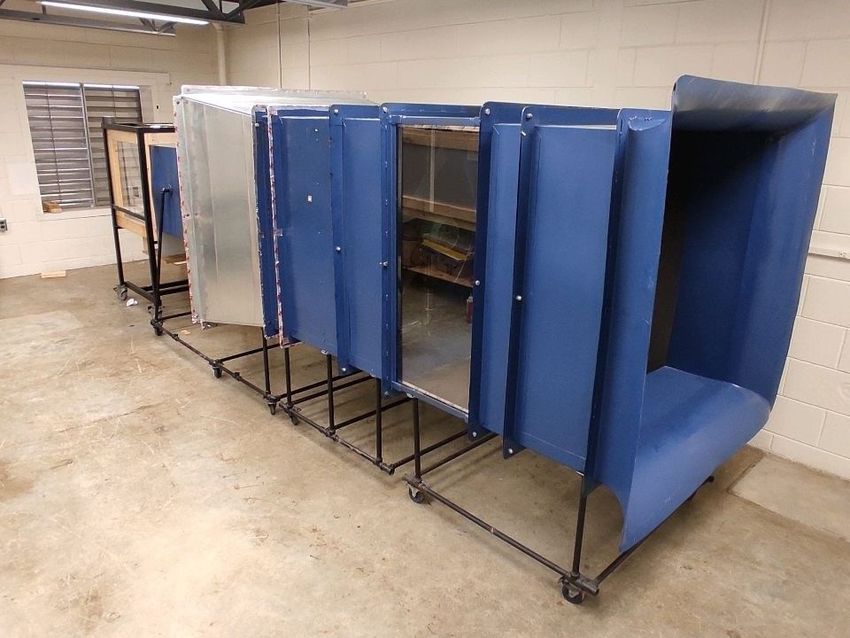
How do winglets
  reduce induced
  drag?
1.   The winglet creates lift that is
     perpendicular to the local relative wind.
2.   The generated lift force has a
     component that opposes the induced
     drag.

Additionally, it reduces the vortex strength
                                                 Figure 6: Reduction of induced drag due to winglet [5].
and it moves it away from the wing.
Wind Tunnel Experimental Method
● Each wing and winglet combination was attached to a strain transducer setup and pressure tubes
were attached to the surface of each wing.
● Setup was placed in the wind tunnel. The speed of the airflow was 10 m/s.
● Lift and drag force from transducer were recorded.
● Pressure difference from top and bottom of the wing was recorded to gather lift force.Selected wing geometries Technical and wing specifications were based on real modes [7-10].
Winglet Geometries

1.   This research aimed to determine
     the aerodynamic/structural effect of
     the change of cant angle of the
     blended winglets.
2.   Winglets with cant angles of:
      ○ 30°
      ○ 60°                                 Figure 7: Cant angle of a winglet [11].
      ○ 90°
1. SolidWorks was used to design
Test Models the wing and winglet models.
2. This models were transferred to
ANSYS for airflow simulation.
● SolidWorks was used to design 3. Models were also 3D printed and
the wing and winglet assembled together using crazy
models.This models were glue.
transferred to ANSYS for Figure 8: SolidWorks model of Cessna 172 wing.
4. Primer was sprayed over the wing
airflow simulation. and then they were smoothed out
● Models were also 3D printed using sandpaper.
and assembled together using
crazy glue.
● Primer was sprayed over the
wing and then they were
smoothed out using sandpaper Figure 9: SolidWorks blended winglets models.3D printed Wing Models
Figure 10: Cessna 172 3D printed model. Figure 11: Piper PA-46 3D printed model.
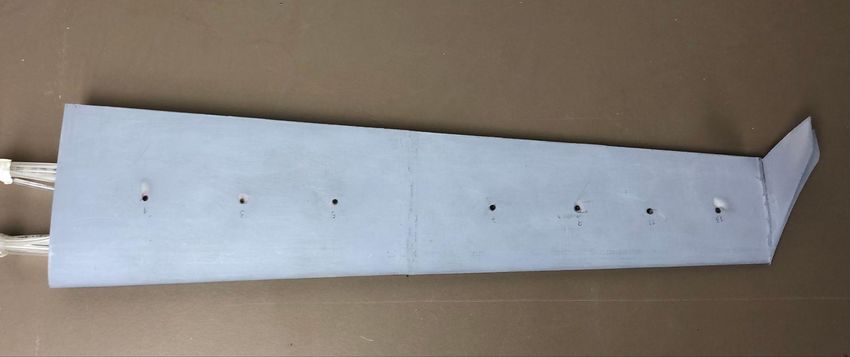
Figure 12: Boeing 737-300 3D printed model.3D Printed Winglet Models
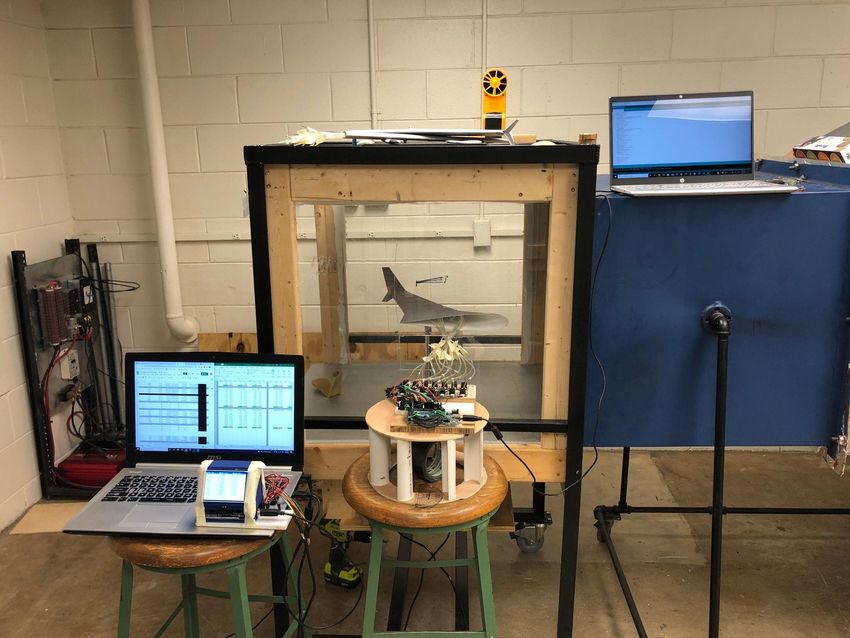
Figure 13: 3D printed blended winglets.Wind tunnel
Experimentation -
Wind tunnel
● Frequency controlled wind speed.
● Air speed range is 1 to 13 m/s.
● Inlet has a mesh to homogenize the
flow.
● 4 ft2 wind outlet.
Figure 14: Strain Transducer Setup.Reynold’s Number
● Re = Reynold’s number.
Equation for Reynold’s number:
● Dimensionless number to determine flight
conditions.
● Reynold’s number for each wing test:
Where:
Table 1: Reynolds Number of each Wing . ● ρ = Density of fluid.
● u = Speed of fluid.
Wing Type Re ● L = Characteristic length.
● μ = Viscosity of fluid.
Cessna 172 7.29e6
Piper Malibu PA-46 5.16e7
Boeing 737-300 5.53e7Wind tunnel 1. Two S-type load cells were
Experimentation - used to determine the overall
lift and drag acting on the wing.
Strain Transducer
2. Vertical sensor determines
overall lift and horizontal
sensor determines overall drag.
3. Arduino was used to get a
calibrated force reading from
both S-type load cells.
4. An LCD was used to display
the readings at all times without
the need of a computer.
Figure 15: Strain Transducer Setup.Strain Transducer -
Arduino
1. Arduino Mega 2560 was used for
data processing.
2. The load cell output voltage signal
is too small for the Arduino to read
(~10 mV).
3. Voltage signal from load cells was
amplified using HX711 breakout
board. It has a 24-bit Analog to
Figure 16: Strain Transducer Arduino sketch [13].
Digital converter (ADC) [12].
4. It allowed for an accuracy of 5V/224
= 0.298µV (on a 5V source).Strain Transducer -
Calibration
1. A code written by Nathan Seidle [14]
was used to determine the coefficient
factor that relates the voltage signal to
the mass placed over sensor.
2. Once the calibration factor was
determined, it was input to a program
that determines the force respective to
the mass reading with the following
equation: Figure 17: Graph that shows accuracy of program used.Wind tunnel
Experimentation -
Strain Transducer
1. The strain transducer determines
the overall Lift (L) and Drag (D)
caused by the wing. The values Where:
- CL = Coefficient of lift
recorded are then input in - CD = Coefficient of drag
- L = Lift
Equations 1 and 2 to determine - D = Drag
- ρ = density of air
the coefficient of lift and drag. - V = velocity of air
- A = wing’s surface areaWindtunnel
Experimentation - ● Multiple Airspeed Sensor
Breakout Board MPXV7002DP
Pressure Sensors sensors were used to determine the
pressure at the surface of the
wings.
● Arduino Mega 2560 was used to
receive data from the sensors and
output the pressure readings on
computer.
● Plastic tubes were placed inside
wings. One end was cut at the
surface of the wing and the other
was connected to the pressure
Figure 18: Strain Transducer Setup. sensors.Pressure Sensors - 1. Arduino Mega 2560 was used for
Arduino data processing.
2. It has a 10-bit Analog to Digital
Converter (ADC).
3. Allowed for an accuracy of 3.3V/210
= 3.22mV.
Figure 19: Pressure Sensors Arduino sketch [15].The slope of the calibration curve
Pressure Sensors - allowed to find the factor value that
Calibration Curve correlates the voltage signal to its
respective pressure.
Equation 3 was implemented in the code to
determine the average pressure difference.
Figure 20: Graph that shows accuracy of program used.Windtunnel
- Pressure Sensors
Experimentation
● Average top and bottom pressure allow ● This relationship can be solved for
to calculate the average pressure average force:
difference that is acting on the wing.
● It is known that: ● Substituting Lift in Equation 1, the
coefficient of lift can be determined:Figure 21: Experimental Setup.
Computational Fluid Dynamic
Simulations
Simulation Equations

● The Navier Stokes governing equations for flow calculation (Eq. 1-4.)
Simulation equations (cont.)
● For the simulations, the k-omega Shear Stress Transport (SST) model within ANSYS
fluent was used to model the turbulence of the airflow as it has high accuracy for
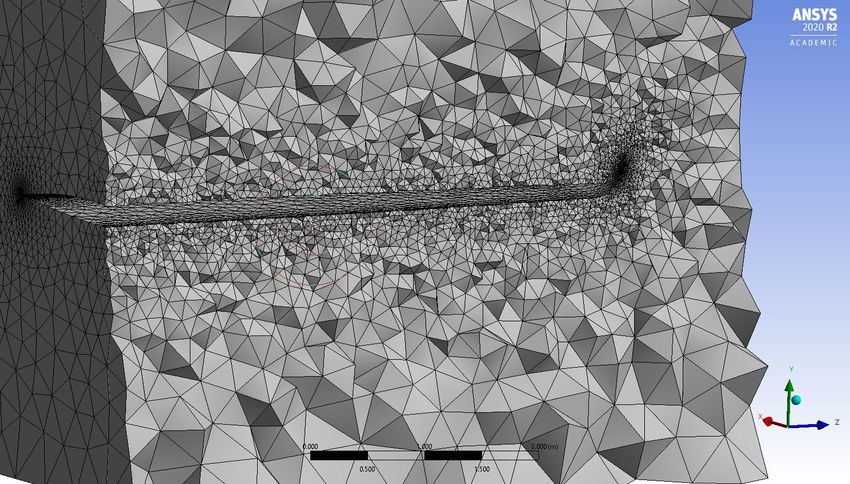
predicting boundary layers and flow separation [5].1. Large, meshed domain to
CFD Simulations capture vortex formation
Using ANSYS Fluent around wing & winglet.
2. Angle of attack simulated at
0°, 5°, and 10° for all
wing/winglet configurations.
1. Observed outputs:
○ Coefficients of lift and drag.
○ Pressure and velocity contours.
○ Overall vortex formation.
Figure 23: Mesh for Cessna 172 with 60° winglet.
Figure 22: Flow domain for Cessna 172 with 60° winglet.1. Surface pressure imported
FEA Simulations from CFD Simulations
2. Determined maximum stress,
strain, modal stress, and
transient stress for each model
3. Al 7075-T6 used for material
of model
Table 2: Properties of material used in FEA[16].
Material Young’s Poisson's Ratio Density
Modulus
Aluminum 71.7GPa 0.33 2.81g/cm3
Figure 24: Imported pressure, gravity and fixed Alloy 7075-T6
support for Boeing 737-300 wingExperimental and Simulation Results
Cessna 172: Wind Tunnel
Cessna 172: SImulation
Cessna 172: Example velocity contours
●    No winglet at α = 5      ●   60° winglet at α = 5
Piper Malibu PA-46: Wind Tunnel
Piper Malibu PA-46: Simulation
Piper PA-46: Example velocity contours
●    No winglet at α = 5     ●   60° winglet at α = 5
Boeing 737-300: Wind Tunnel
Boeing 737-300: Simulation
Boeing 737-300: Example velocity contours
●    No winglet at α = 5     ●   60° winglet at α = 5
Finite Element Analysis
Results
Cessna 172

             Figure 25: Deformation for Cessna 0° (top) and 90° (bottom)
                            winglet at 5° angle of attack.
Piper Malibu PA-46
Figure 26: Deformation for Piper PA-46 0° (top) and 90°
(bottom) winglet at 5° angle of attack.Boeing 737-300
Figure 27: Deformation for Boeing 737 0° (top) and 60°
(bottom) winglet deformation at 5° angle of attack.Conclusions
● All winglets tested more beneficial over wing without winglet
● The 60° winglet was the best for the Cessna 172, the 30° winglet was the best for the Piper PA-46, and the 90°
was the best for the Boeing 737-300.
● As airspeed increases, the positive effect of a winglet reduces
● Lower cant angles more beneficial for lower airspeed, higher cant angles for higher airspeed.
● Winglets do increase stress on wing, but not by large margin.
● Results mostly comparative, further research would allow for exact results for each case for all operating
conditionsAcknowledgements
● Thank you to Dr. Rahman and Dr. Soloiu for allowing us to use your instruments and facilities, as well
as allowing us the amazing opportunity to be a part of this program.
● We also thank the Department of Defense and National Science Foundation for funding the research
involved in this study under Assure REU Site Award 1950207
● Thank you to Charles Fricks, Evan Cathers, and Eric Pernell in assisting us hands-on throughout the
research with preparing simulations, as well as preparing the wind tunnel and models for these
experiments.
● Thank you to everyone involved in the REU program for all of your help and advice.References
1. Toronto, P. (2020, June 22). Forces of flight. Pearson Airport. https://www.torontopearson.com/en/whats-happening/stories/whyyz/forces-of-flight.
2. SKYbrary Wiki. AP4ATCO - Aerofoil Terminology - SKYbrary Aviation Safety. (n.d.). https://www.skybrary.aero/index.php/AP4ATCO_-_Aerofoil_Terminology.
3. This is how winglets work. Online Flight Training Courses and CFI Tools. (n.d.).
https://www.boldmethod.com/learn-to-fly/aerodynamics/how-winglets-work-to-reduce-drag-and-how-wingtip-vortices-form/.
4. “Induced Drag.” Tangvald, November 9, 2013. https://tangvald.wordpress.com/2013/11/09/induced-drag/.
5. Guerrero, J., Sanguineti, M., Wittkowski, K. (2018). CFD Study of the Impact of Variable Cant Angle Winglets on Total Drag Reduction. Aerospace, 5(4), 126.
6. Haddad, Nicolas El. “Aerodynamic and Structural Design of a Winglet for Enhanced Performance of a Business Jet,” 2015.
7. Cessna Aircraft Company. (1998). Cessna Model 172S Information Manual (5th ed.). Cessna Aircraft Company.
8. Estaff, and Editorial Staff. “Piper Malibu-Mirage.” AVweb, April 21, 2016.
https://www.avweb.com/features/piper-malibu-mirage/#:~:text=Malibu%20performance%20puts%20the%20airplane,at%20FL250%20at%2075%20percent.
9. Brady, Chris. “Detailed Technical Data.” The Boeing 737 Technical Site. Accessed June 30, 2021. http://www.b737.org.uk/techspecsdetailed.html
10. UIUC Airfoil Data Site. UIUC Applied Aerodynamics Group. Accessed June 30, 2021.
11. Guerrero, J. E., M. Sanguineti, and K. Wittkowski. “Variable Cant Angle Winglets for Improvement of Aircraft Flight Performance.” Meccanica 55, no. 10 (2020):
1917–47. https://doi.org/10.1007/s11012-020-01230-1.
12. Avia Semiconductor Co. “24-Bit Analog-to-Digital Converter (ADC) for Weigh Scales”
13. “Load Cell Straight Bar 0-1/5/10/20/50kg Force Pressure Weight Sensor / HX711 Module for Arduino IoT.” Shopee Malaysia. Accessed July 23,
2021.https://shopee.com.my/Load-Cell-Straight-Bar-0-1-5-10-20-50kg-Force-Pressure-Weight-Sensor-HX711-Module-for-Arduino-IoT-i.33091591.568966941?__
hybrid_pc__=1&stm_referrer=https%3A%2F%2Fwww.google.com%2F
14. Load Cell Amplifier HX711 Breakout Hookup Guide. Sparkfun. Accessed July 23, 2021.
https://learn.sparkfun.com/tutorials/load-cell-amplifier-hx711-breakout-hookup-guide/all.
15. Hrisko, Joshua. “Arduino Pitot TUBE Wind Speed and Airspeed Indicator - Theory and Experiments.” Maker Portal. Maker Portal, April 2, 2021.
https://makersportal.com/blog/2019/02/06/arduino-pitot-tube-wind-speed-theory-and-experiment.
16. Metals Handbook, Vol.2 - Properties and Selection: Nonferrous Alloys and Special-Purpose Materials, ASM International 10th Ed. 1990.You can also read