Synthetic Aperture Radar and Optical Mapping Used to Monitor Change and Replacement of Phragmites australis Marsh in the Lower Mississippi River ...
←
→
Page content transcription
If your browser does not render page correctly, please read the page content below
Prepared in cooperation with the U.S. Fish and Wildlife Service

Synthetic Aperture Radar and Optical Mapping Used to
Monitor Change and Replacement of Phragmites australis
Marsh in the Lower Mississippi River Delta, Louisiana

Open-File Report 2021–1046

U.S. Department of the Interior
U.S. Geological Survey
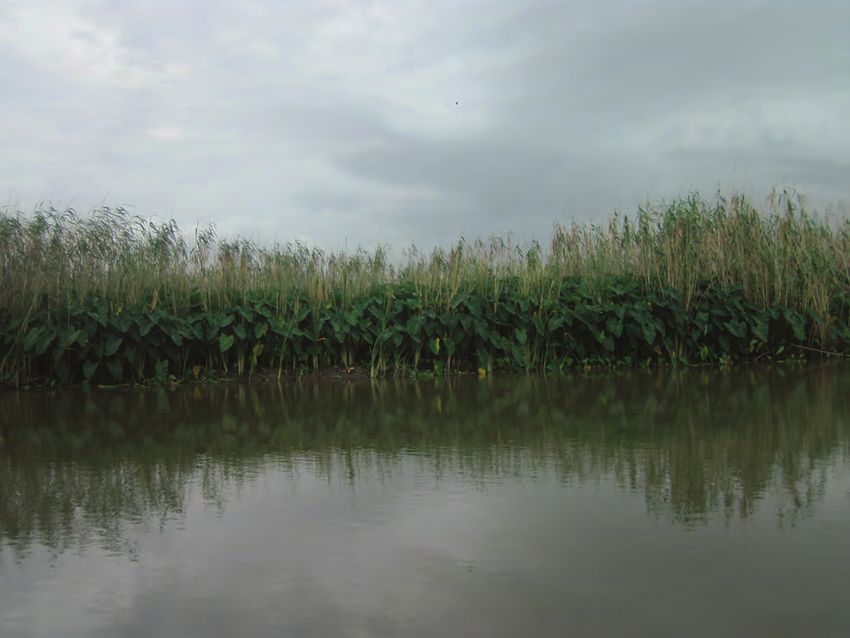
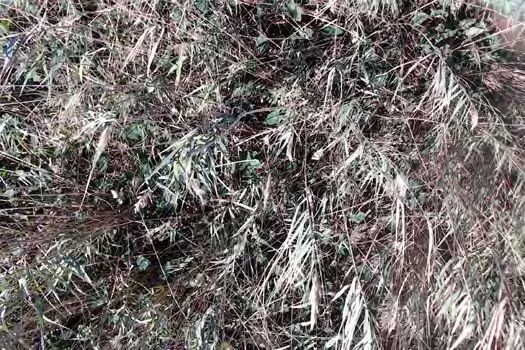
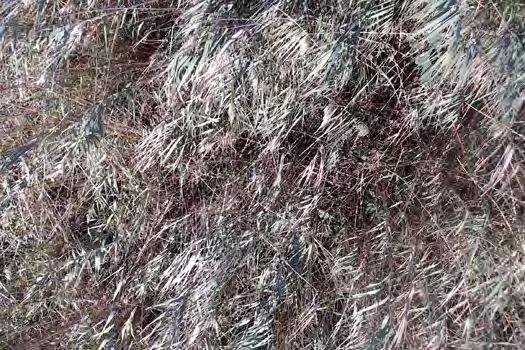
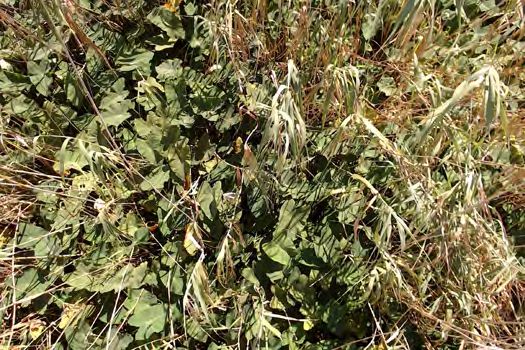
Cover. Photograph showing Phragmites australis marsh replacement by elephant-ear in 2019, lower
Mississippi River Delta, Louisiana.
Synthetic Aperture Radar and Optical
Mapping Used to Monitor Change and
Replacement of Phragmites australis
Marsh in the Lower Mississippi River
Delta, Louisiana

By Elijah W. Ramsey III and Amina Rangoonwala

Prepared in cooperation with the U.S. Fish and Wildlife Service

Open-File Report 2021–1046

U.S. Department of the Interior
U.S. Geological Survey
U.S. Geological Survey, Reston, Virginia: 2021 For more information on the USGS—the Federal source for science about the Earth, its natural and living resources, natural hazards, and the environment—visit https://www.usgs.gov or call 1–888–ASK–USGS. For an overview of USGS information products, including maps, imagery, and publications, visit https://store.usgs.gov/. Any use of trade, firm, or product names is for descriptive purposes only and does not imply endorsement by the U.S. Government. Although this information product, for the most part, is in the public domain, it also may contain copyrighted materials as noted in the text. Permission to reproduce copyrighted items must be secured from the copyright owner. Suggested citation: Ramsey, E.W., III, and Rangoonwala, A., 2021, Synthetic aperture radar and optical mapping used to monitor change and replacement of Phragmites australis marsh in the lower Mississippi River Delta, Louisiana: U.S. Geological Survey Open-File Report 2021–1046, 19 p., https://doi.org/10.3133/ofr20211046. ISSN 2331-1258 (online)
iii

Acknowledgments
We thank William G. Thomas II (Invasive Species Coordinator/Strike Team Leader, U.S. Fish and
Wildlife Service [FWS] Region 4) for supporting our proposed work and Sue Wilder, previously
with the FWS, for help in preparing the study proposal. Neil Lalonde (Project Leader at the FWS
Southeast Louisiana National Wildlife Refuges [NWR] Complex) and Barret K. Fortier (Regional
Energy Coordinator I, Southeast Region, and Acting Refuge Manager for the Delta and Breton
NWRs) are thanked for allowing access to the Delta NWR and for providing transport to the field
sites throughout the NWR. We thank Max Latham, FWS, whose knowledge and persistence
helped us obtain the field data we needed for this study.

The Advanced Land Observing Satellite (ALOS) and ALOS-2 data used in this study were
provided to the U.S. Geological Survey by the Japan Aerospace Exploration Agency (JAXA) and
Japan Resources Observation System Organization (JAROS) under a Collaborative Research
Agreement (nonfunded).
v
Contents
Acknowledgments����������������������������������������������������������������������������������������������������������������������������������������iii
Abstract�����������������������������������������������������������������������������������������������������������������������������������������������������������1
Introduction����������������������������������������������������������������������������������������������������������������������������������������������������1
Purpose and Scope������������������������������������������������������������������������������������������������������������������������������2
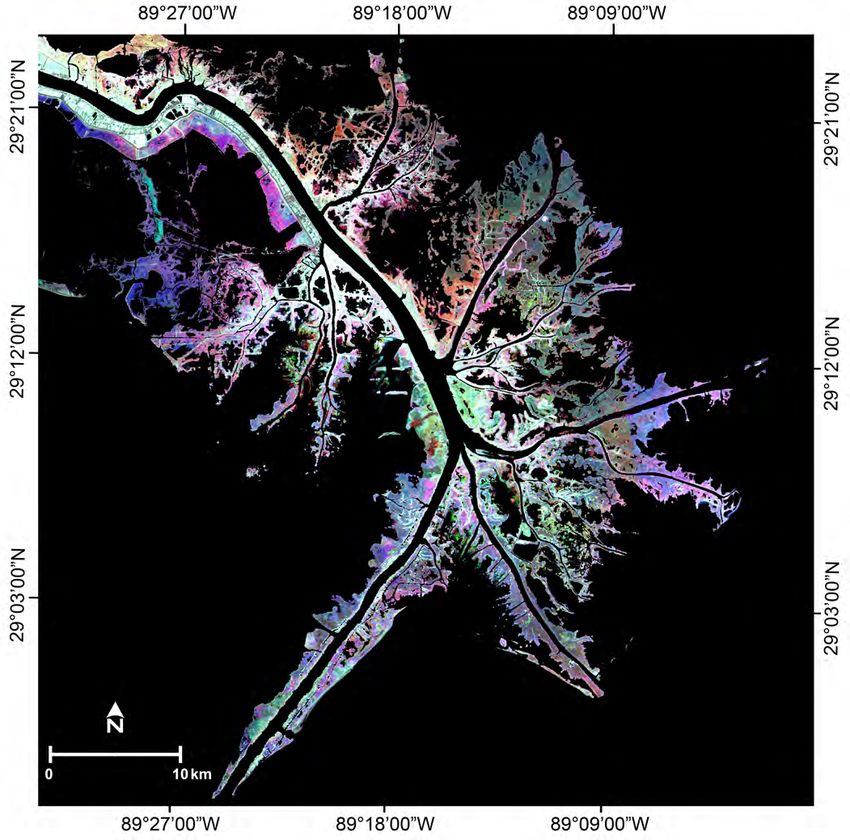
Study Area���������������������������������������������������������������������������������������������������������������������������������������������2
Methods����������������������������������������������������������������������������������������������������������������������������������������������������������3
Mapping Data Sources������������������������������������������������������������������������������������������������������������������������3
Satellite Optical-LFC Mapping���������������������������������������������������������������������������������������������������3
Satellite SAR and P. australis Marsh Density��������������������������������������������������������������������������3
Production of Yearly Density-Indicator Maps from 2016 to 2018��������������������������������������������������5
Water Mask Creation and Above-Surface Water Levels��������������������������������������������������������������5
Site Selection and Field Data Collections�����������������������������������������������������������������������������������������6
Challenges in Relating Field to Satellite Measurements������������������������������������������������������6
HV, LFC, and Elephant-Ear Graphical Comparisons������������������������������������������������������������������������6
Elephant-Ear Increase and HV and LFC Response����������������������������������������������������������������6
Fused HV-Density and Optical-LFC Trajectory Status Monitors������������������������������������������6
Field Site Trajectory Plots�����������������������������������������������������������������������������������������������������������6
Regional Site Trajectory Plots����������������������������������������������������������������������������������������������������6
Results�������������������������������������������������������������������������������������������������������������������������������������������������������������7
ALOS HV-Density-Indicator Mapping������������������������������������������������������������������������������������������������7
LFC and HV-Density Comparison������������������������������������������������������������������������������������������������������10
2018 and 2019 Field Site Comparison��������������������������������������������������������������������������������������10
HV Related to LFC�������������������������������������������������������������������������������������������������������������10
Elephant-Ear Increase Related to HV and LFC������������������������������������������������������������10
Trajectory Descriptions and Comparisons�������������������������������������������������������������������������������������10
Field Trajectory Descriptions and Comparisons�������������������������������������������������������������������10
Regional Trajectory Descriptions and Comparisons������������������������������������������������������������10
Discussion�����������������������������������������������������������������������������������������������������������������������������������������������������11
Elephant-Ear Increase Related to HV and LFC������������������������������������������������������������������������������17
Technology Transfer���������������������������������������������������������������������������������������������������������������������������17
Summary�������������������������������������������������������������������������������������������������������������������������������������������������������17
References Cited�����������������������������������������������������������������������������������������������������������������������������������������18
Figures
1. A Sentinel-2 optical image of the lower Mississippi River Delta study region,
Louisiana, August 31, 2019 ���������������������������������������������������������������������������������������������������������3
2. Image showing Phragmites australis within the U.S. Fish and Wildlife Service
Delta National Wildlife Refuge in 2016 �������������������������������������������������������������������������������������4
3. Webcam photographs of two field sites: site S1, 2018; site S1, 2019; site S3,
2018; and site S3, 2019 �����������������������������������������������������������������������������������������������������������������7
4. Composited Advanced Land Observing Satellite synthetic aperture radar HV
images, 2016, 2017, 2018, and 2019 ��������������������������������������������������������������������������������������������8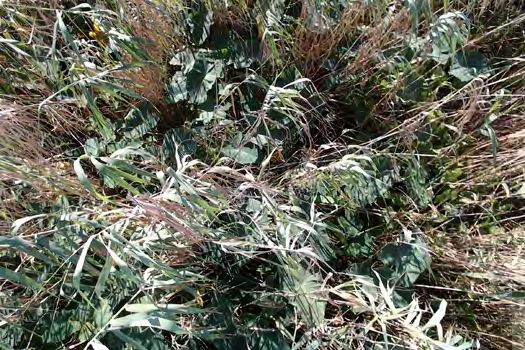
vi

           5.    Advanced Land Observing Satellite-2 HV color composite displaying the 2016
                 HV amplitude as red, 2017 HV amplitude as green, and 2018 HV amplitude as blue ��������9
           6.    Graphs showing the 2019 minus 2018 elephant-ear difference compared to the
                 2019 minus 2018 HV-amplitude and live fractional cover differences at berm sites ������11
           7.    Graphs showing trajectories for Sentinel-2 live fractional cover and Advanced
                 Land Observing Satellite-2 HV amplitudes for field sites, 2016–19 ������������������������������������13
           8.    Sentinel-2 composite image showing live fractional cover for 2016, 2017, and
                 2018; and Advanced Land Observing Satellite-2 composite image showing HV
                 amplitudes for 2016, 2017, and 2018 ����������������������������������������������������������������������������������������14
           9.    Sentinel-2 composite image showing live fractional cover for 2016, 2017, and
                 2018; and Advanced Land Observing Satellite-2 composite image showing HV
                 amplitudes for 2016, 2017, and 2018 ����������������������������������������������������������������������������������������14
          10.    Graphs showing trajectories for Sentinel-2 live fractional cover and Advanced
                 Land Observing Satellite-2 HV backscatter amplitudes for regional sites, 2016–19 ������15

     Tables
           1. Surface-water levels at Louisiana Coastwide Reference Monitoring System
              sites in the U.S. Fish and Wildlife Service Delta National Wildlife Refuge at the
              times of image collections����������������������������������������������������������������������������������������������������������5
           2. Simple regressions describing HV and LFC relationships���������������������������������������������������10
           3. Mid-range normalized HV and LFC differences between years at field sites
              and regional sites at the U.S. Fish and Wildlife Service Delta National Wildlife
              Refuge, 2016–19��������������������������������������������������������������������������������������������������������������������������12

     Conversion Factors
     International System of Units to U.S. customary units

                              Multiply                                         By                                   To obtain
                                                                         Length
      meter (m)                                                             3.281            foot (ft)
      kilometer (km)                                                        0.6214           mile (mi)
      kilometer (km)                                                        0.5400           mile, nautical (nmi)
      meter (m)                                                             1.094            yard (yd)

     Temperature in degrees Fahrenheit (°F) may be converted to degrees Celsius (°C) as follows:
     °C = (°F – 32) / 1.8.
vii Abbreviations < less than ≤ less than or equal to ALOS Advanced Land Observing Satellite CRMS Coastwide Reference Monitoring System EE elephant-ear (Colocasia esculenta) FWS U.S. Fish and Wildlife Service GSA ground surface area HH horizontal send and horizontal return HV horizontal send and vertical return LFC live fractional cover NDVI normalized difference vegetation index NWR National Wildlife Refuge PALSAR phased array type L-band SAR radar SAR synthetic aperture radar USGS U.S. Geological Survey VH vertical send and horizontal return VV vertical send and vertical return
Synthetic Aperture Radar and Optical Mapping Used to
Monitor Change and Replacement of Phragmites australis
Marsh in the Lower Mississippi River Delta, Louisiana
By Elijah W. Ramsey III1 and Amina Rangoonwala2

Abstract                                                          Introduction
      Synthetic aperture radar (SAR) mapping of density as an           Recent and widespread nonnative scale insect
enhancement of Phragmites australis optical live fractional       (Nipponaclerda biwakoensi) infestation and Phragmites
cover (LFC) mapping was carried out in the lower Mississippi      australis dieback has been documented in southeast Louisiana
Delta during 2016 to 2019. Also, as part of the study, the        (Ramsey and Rangoonwala, 2017). Although invasive, P. aus-
replacement of P. australis with elephant-ear was analyzed.       tralis is the dominant plant species in many southeast coastal
To that end, yearly maps from 2016 to 2019 of L-band SAR          marshes (Baurick, 2017).
horizontal send, vertical receive (HV) data representing                P. australis marsh dieback is devastating for gulf coastal
marsh density were produced for the lower Mississippi River       marshes because it protects them from erosion. Its height and
Delta. The mapping indicated high local variability within        extensive root system absorb wave impact, thus thwarting ero-
broad yearly density change in P. australis marsh. LFC map-       sion and promoting land building to help stabilize coastal wet-
ping indicated a similar pattern of broad yearly change. That     lands. Its loss is likely to spur erosion, worsening the already
overall density and LFC linear correspondence was confirmed       alarming rate of land loss (Baurick, 2017) and threatening the
with regressions of P. australis marsh HV-density data and        ecological and economic functions of the Mississippi River
optical-LFC data. Local differences reflected as high scat-       Delta. Loss of P. australis undermines the deltaic wetland
ter in the plots. Based on those results, a combined LFC and      support of large populations of ducks, wading birds, fish, and
HV-density assessment tracker of P. australis condition was       shellfish and the viability of Federal and State wildlife refuges
developed. Major findings from the use of the trajectory tool     that manage significant populations of wintering waterfowl.
were the high decrease in HV density from 2016 to 2017, the       Increased erosion could clog shipping channels, posing a
identification of severely degraded P. australis marsh and        threat to navigation. Erosion could also expose oil and gas
European P. australis marsh in some areas, and indications of     infrastructure, possibly leading to catastrophic loss and rupture
linkage between the density decline from 2016 to 2017 and the     and contamination of already degraded coastal resources.
elephant-ear replacement from 2018 to 2019. The trajectory              A limited study by the U.S. Geological Survey (USGS)
tool application also indicated an inverse relationship between   indicated that satellite mapping of the normalized difference
elephant-ear occurrence and HV-density changes from 2018 to       vegetation index (NDVI) with satellite optical data could help
2019. A similar but weaker relationship was found between         track changes in P. australis live composition through time
elephant-ear and LFC. These relationships may provide a           (Ramsey and Rangoonwala, 2017). A subsequent study by
means for early detection of replacement of P. australis marsh    the USGS quantified the relationship between NDVI and P.
by elephant-ear and other unwanted plant species.                 australis live fractional cover (LFC) and used the developed
                                                                  relationship to map LFC yearly changes from 2009 to 2016
                                                                  with Landsat and yearly plus seasonal LFC changes from 2017
                                                                  to 2019 with Sentinel-2 optical image data (Rangoonwala
                                                                  and others, 2020). Although that LFC mapping development
                                                                  provides the ability to quantitatively track live composition
                                                                  changes relatable to the onset and progression of dieback
                                                                  (Ramsey and others, 2014; Ramsey and Rangoonwala, 2017),
                                                                  it does not directly measure another critical indicator of
  1
   U.S. Geological Survey.                                        change, P. australis canopy density. As mentioned in Ramsey
  2
                                                                  and Rangoonwala (2017) and Rangoonwala and others (2020),
  Cherokee Nation Technologies under contract to the U.S.
Geological Survey.
2 SAR and Optical Mapping Used to Monitor Change and Replacement, P. australis, Lower Mississippi River Delta, Louisiana
synthetic aperture radar (SAR) remote sensing is directly mapping systems to track the detected abnormality. To assess
tuned to the structural aspects of the vegetation canopy, such those mapping capabilities, three study objectives were
as density (Ramsey and others, 2014, 2015, 2016). pursued. The initial objective was to use SAR mapping to
SAR-density mapping provides an indicator of marsh document the yearly spatial P. australis marsh density patterns
thinning and heightens differences in marsh type when com- and changes in those patterns from 2016 to 2019. The sec-
bined with optical mapping (Bourgeau-Chavez and others, ond objective was to evaluate possible relationships between
2009, 2013). Those enhanced capabilities should promote observed elephant-ear replacement and changes in density
discernment of P. australis marsh dieback onset and progres- identified through optical-LFC and SAR-density mapping. The
sion and increase the ability to identify replacement by other final objective was to assess covariance of optical LFC and
plant species. In response to observations of replacement of SAR density as an early indicator of causal change to inform
P. australis by Colocasia esculenta (elephant-ear) in 2018–19 resource managers charged with mitigation efforts.
by Rangoonwala and others (2020), the USGS, in cooperation
with the U.S. Fish and Wildlife Service (FWS), used SAR-
density and LFC mapping to expand tracking of P. australis Study Area
marsh changes at the FWS Delta National Wildlife Refuge
The study area is the lower Mississippi River Delta in
(NWR) from 2016 through 2019.
southeastern Louisiana (fig. 1). Within this study area, map-
ping efforts were focused on the FWS Delta NWR (fig. 2).
Purpose and Scope Assessments and comparisons of the produced maps were also
focused on the Delta NWR. P. australis marsh extent in 2016
The primary purpose of this study was to develop map- is based on the Dugas and others (2018) mapped P. australis
ping systems to identify abnormal changes in P. australis marsh coverage of the Delta NWR.
marsh near onset, and when identified, to use the developedMethods 3
89°30' 89°20' 89°10'
29°20'
29°10'
29°00'
0 5 MILES
0 5 KILOMETERS
Figure 1. A Sentinel-2 optical image of the lower Mississippi River Delta study region, Louisiana, August 31, 2019. In this
near-infrared, red and green band image composite, healthy vegetation tends to appear bright red. The yellow polygon
outlines the U.S. Fish and Wildlife Service Delta National Wildlife Refuge.
Methods Satellite SAR and P. australis Marsh Density
The Advanced Land Observing Satellite (ALOS and
Mapping Data Sources ALOS-2, referred to as “ALOS” in this report) phased array
type L-band SAR data were used for assessment of mapping
Satellite Optical-LFC Mapping P. australis marsh density for this study. The initiation of the
SAR and optical P. australis marsh mapping was guided by
Production of the LFC maps used in this study is
works of Bourgeau-Chavez and others (2009, 2013).
described in Rangoonwala and others (2020). The P. australis
In general, L-band SAR penetration into taller and denser
marsh LFC status and change mapping relied on Sentinel-2
vegetation canopies is greater than that of shorter wavelength
for current to future mapping and Landsat for histori-
systems (Ramsey, 1998). For this study, the higher penetra-
cal mapping.
tion provides enhanced perception of the entire P. australis4 SAR and Optical Mapping Used to Monitor Change and Replacement, P. australis, Lower Mississippi River Delta, Louisiana
89°15' 89°10'
29°20'
R2S10 S6
R2S11
S10
CRMS 0161
R1S1 S5
R1S2 R2S9
R1S3 S8 S7 R1S6R1S7
R2S12
R1S5
R1S4 R1S8
S9
29°15'
S1
CRMS 2634 CRMS 2627 S3
S2
CRMS 4448
S13
S12 S11
R3S13
29°10'
R3S14
0 1 2 Kilometers
Figure 2. Phragmites australis (green) within the U.S. Fish and Wildlife Service Delta National Wildlife Refuge (gray
outline) in 2016 (Dugas and others, 2018). Louisiana Coastwide Reference Monitoring System (CRMS; Coastal Protection
and Restoration Authority, 2020) sites are shown in yellow (table 1), and field sites are shown in red (table 3). The regional
trajectory development sites are shown in orange (table 3).Methods 5
marsh vertical profile. The cross-polarized HV (send horizon- images. Although only minor senescence was expected, a
tal and receive vertical polarization) or VH (send vertical and decrease of canopy LFC portends lower canopy water volume,
receive horizontal polarization) backscatter is a more sensitive likely decreasing SAR HV amplitude (Ramsey, 1998; Ramsey
indicator of vegetation volume than like-polarized HH (send and others, 2015). Due to that sensitivity, minor decreases in
and receive horizontal polarization) or VV (send and receive both LFC and SAR HV may have occurred from September to
vertical polarization) backscatter (Ramsey, 1998; Ramsey and late October and early November.
others, 1999, 2014). The HV backscatter based on increased Landsat LFC maps indicate an overall LFC increase from
penetration should be more closely aligned with the marsh September 30, 2016, to September 17, 2017 (Rangoonwala
density. The HV backscatter was used as the P. australis marsh and others, 2020). While Sentinel-2 LFC maps show a
density indicator. similar broad LFC increase from September 20, 2016, to
October 25, 2017, these maps contain scattered pockets of
LFC percent decrease within the Delta NWR (Rangoonwala
Production of Yearly Density-Indicator Maps and others, 2020). Sentinel-2 LFC decrease from October 30
from 2016 to 2018 to December 4, 2018, was higher than in 2016–17 but still
lower than 20 percent. The demonstrated overall LFC stabil-
The ALOS SAR dual polarization HH and HV data were ity through late October was expected to extend into early
calibrated as sigma naught and expressed as amplitude. A 3 by November. While the timing offset is expected to result in
3 average filter was applied to each 6.25-meter (m) ground- some seasonally related LFC change, and thereby, untraceable
surface-area (GSA) image to reduce speckle (Bourgeau- changes in the SAR backscatter, the resulting variability is not
Chavez and others, 2013). In only the regional site analyses, a expected to impede the interpretability of the LFC and ALOS
3 by 3 average filter was applied twice to the speckle filtered HV density covariance patterns.
HV images to enhance graphical depiction of change.
ALOS SAR image coverages of the Mississippi River
Delta were created for September 2016, November 2017 and Water Mask Creation and Above-Surface Water
2018, and October 2019 (table 1). Coverage of the Mississippi Levels
River Delta required the composite of three SAR images.
Although complete coverage of the Mississippi River Delta A water mask was created from a mix of Sentinel-2 SAR
used SAR images from January 2017, 2018, and 2019, in the and optical images that visually best preserved P. australis
composite, the January image only covered the far eastern marsh while eliminating intermittently ponded water bodies
edge of the lower Mississippi River Delta. The composite east- and most bare and vegetated mud flats. Except for minor edits,
ern edge was not included in any comparisons or assessments. the same water mask was applied to all map products.
The yearly SAR HV-amplitude composites were resampled to Above the marsh surface, water levels at four Coastwide
a 10-m GSA matching Sentinel-2 and registered to Sentinel-2 Reference Monitoring System (CRMS) sites (Coastal
images for the same year. Protection and Restoration Authority, 2020) within the Delta
LFC and HV density maps were based on the months of NWR were documented at the times of all satellite image
September 2016 and October 2019 (table 1). The 2017 and collections (table 1). Optical remote sensing and SAR are
2018 late October LFC maps were also temporally comparable sensitive to subcanopy flooding (Ramsey and others, 2013).
to the SAR maps based on early November HV-amplitude Although, water levels and interior flooding vary regionally
Table 1. Surface-water levels at Louisiana Coastwide Reference Monitoring System sites in the U.S. Fish and Wildlife Service Delta
National Wildlife Refuge at the times of image collections.
[CRMS, Louisiana Coastwide Reference Monitoring System (Coastal Protection and Restoration Authority, 2020)]
Water levels at CRMS sites (fig. 2), in meters above ground level
Satellite Date
0161 2634 2627 4448
Sentinel-2 September 30, 2016 0.321 0.05 0.181 0.373
October 25, 2017 0.129 –0.067 0.096 0.353
October 30, 2018 0.083 0.258 0.361 0.425
October 20, 2019 no data 0.322 0.473 0.720
ALOS-2 September 14, 2016 0.528 0.199 0.356 0.482
November 8, 2017 0.539 0.405 0.453 0.578
November 7, 2018 0.646 0.281 0.514 0.669
October 7, 2019 0.278 0.094 0.186 0.8086 SAR and Optical Mapping Used to Monitor Change and Replacement, P. australis, Lower Mississippi River Delta, Louisiana
throughout the Delta NWR, correspondence of low or high HV, LFC, and Elephant-Ear Graphical
water across multiple CRMS sites indicates similarity of water
Comparisons
levels at all sites.
Elephant-Ear Increase and HV and LFC Response
Site Selection and Field Data Collections In 2018 and 2019, percentages of elephant-ear cover-
Data were collected at sites (hereinafter referred to as age at field sites were estimated by visual inspection of field
“field sites”) in the FWS Delta NWR during November 15–16, webcam photography (fig. 3). HV and LFC magnitudes were
2018, and August 20–22, 2019, to encompass the full range of extracted from 2018 and 2019 SAR HV and LFC collocated
P. australis growth. Sites were located beside waterways and field sites. Scatterplots were used to inspect the covariance of
were accessible by boat (fig. 2). HV and LFC change with change of elephant-ear from 2018
In 2018, of the 13 field sites, 10 were purely or domi- to 2019. The change plots were used to remove variability in
nantly composed of P. australis marsh, 1 was composed of the starting values, and in this case, localize the dependent
elephant-ear, 1 was mud, and 1 was water. Of the 10 vegeta- response to the independent change to a single year.
tion field sites in 2019, only 3 were purely or dominantly
composed of P. australis marsh, and 7 were heavily mixed Fused HV-Density and Optical-LFC Trajectory
with or were purely elephant-ear. Eight of the field sites
studied in 2018 were revisited in 2019. In addition, four Status Monitors
observation sites in 2018 and five observation sites in 2019 Temporal HV-LFC trajectory plots were used to enhance
had no instrument data collections. At all site locations, Global tracking of change, in this case, change in P. australis marsh.
Positioning System coordinates and photographic and field The trajectory plots provide three-dimensional (HV, LFC,
note descriptions were obtained. At field sites, radiometer and time) transition patterns that reveal changes, such as growth,
webcam photography were collected and analyzed (Ramsey degradation, regrowth, or replacement, that are unlikely to
and Jensen, 1995; Rundquist and others, 2014). Radiometer be noticed on one-dimensional status or change maps unless
data were used in the LFC mapping (Rangoonwala and oth- change is dramatic.
ers, 2020).
The webcam photography was vital for visual documen-
tation of the percentage of elephant-ear occurrence and change Field Site Trajectory Plots
from 2018 to 2019. The webcam system mounted at the same
point as the radiometer obtained an approximate 4-m by 6-m Trajectory plots were used to inspect the covariance of
red-green-blue picture of the canopy coincident with the radi- HV and LFC magnitudes extracted from 2016, 2017, 2018,
ometer measurement (Rangoonwala and others, 2020). and 2019 ALOS HV and LFC collocated field sites. These
trajectory plots incorporate the 2018 and 2019 field-observed
P. australis condition. Due to the field sampling logistics,
Challenges in Relating Field to Satellite these sites represent berms along canal edges. The 2018 and
Measurements 2019 field observations indicated that higher P. australis marsh
densities occur on the berms while lower densities occupy the
Webcam data were collected at two to three directions intervening basins.
or locations at each field site. Although the boat platform was
inserted as far as possible into the marsh and the webcam
was further extended into the marsh via the support pole, all Regional Site Trajectory Plots
sampled locations were near the open water and marsh edge. To include basin P. australis marsh trajectories, an HV
That closeness to the edge increased the possibility of bound- color composite was created for 2016–18. The HV color
ary pixels in the satellite images being contaminated to some composite was combined with the LFC color composite
extent by open water. (Rangoonwala and others, 2020) and was used to select
To lessen that possible contamination, locations where regional trajectory sites within three Delta NWR regions
the overall marsh characteristics extended at least 2 pixels, or (fig. 2) based on hue and tonal differences. The tonal differ-
20 m, beyond the edge into the interior were preferred for data ences were expected to reflect variation of P. australis marsh
collection. While that criterion tended to minimize edge-pixel trajectories over the 3 years. The inclusion of basin sites
contamination, variable water levels increased the variance broadens the scope of the P. australis marsh trajectory analysis
of the satellite measurements. Further, variability of each and contrasts differences in berm-basin LFC and HV density.
individual pixel composition was caused by georeferencing in Fifteen sites (hereinafter referred to as “regional sites”)
optical and SAR images and by resampling and filtering of the were chosen from 3 regions in the Delta NWR (fig. 2), and
SAR images; this variability taxed the analyses applied in this LFC and HV image data for 2016, 2017, 2018, and 2019
study based on single pixel correspondences. were extracted from the 3- by 3-pixel area encompassingResults 7
A B
C D
Figure 3. Webcam photographs of two field sites: A, site S1, 2018; B, site S1, 2019; C, site S3, 2018; and D, site S3, 2019 (fig. 2, table 3).
Increased elephant-ear cover is seen at both field sites.
each site’s central coordinate. Eleven of the 15 sites were in in 2017; most apparent in comparison to HV amplitudes in
P. australis marsh exhibiting different hues and in different 2018. A 2016 (red), 2017 (green), and 2018 (blue) HV image
types of locations, such as along waterways, in basins between composite shows the spatial variation of marsh density among
waterways, and in the eastern extent of the Delta NWR. Site the 3 years (fig. 5).
R3S13 of region 3 (fig. 2) was in European P. australis marsh As in the LFC maps of Rangoonwala and others (2020),
(Knight and others, 2019) just outside the southern extent of hue and tonal differences represent variation in the yearly
Delta NWR. combination of HV amplitudes, or P. australis marsh densities
(fig. 5). In contrast to the Delta NWR LFC composite depic-
tion (Rangoonwala and others, 2020), the HV-density ampli-
tude composite exhibits larger areas of uniformity and overall,
Results less heterogeneity. In figure 5, the higher densities are most
often represented by oranges, pinks, and off-whites. Orange
ALOS HV-Density-Indicator Mapping represents higher 2016 HV amplitudes, indicating higher
P. australis marsh densities, mixed with equally low 2017
The HV densities were mapped for 2016, 2017, 2018, and and 2018 HV amplitudes, or lower P. australis densities. Pink
2019 (fig. 4). The gray shading indicates the HV amplitude; indicates that 2016 HV amplitudes are higher than in 2017 and
the higher the HV amplitude, the lighter the gray shading. The 2018, and white indicates that 2016 and 2018 HV amplitudes
most striking features within all four maps are the relatively are nearly equal and high and that 2017 HV amplitudes are
high amplitudes, or P. australis marsh densities, lining the slightly lower than 2017 and 2018 amplitudes. Greenish hues
waterways and the low amplitudes in the interceding basins. indicate overall moderate but slightly higher densities in 2017.
Higher amplitudes are seen toward the western Delta NWR, P. australis marsh occupying basins lying between canals
particularly in 2018 (fig. 4C). The next notable contrast is the and waterways have low HV amplitudes reflecting generally
overall lower amplitudes, or lower P. australis marsh densities, low P. australis marsh densities. Subtle changes of green, red,8 SAR and Optical Mapping Used to Monitor Change and Replacement, P. australis, Lower Mississippi River Delta, Louisiana
89°27' 89°18' 89°09' 89°27' 89°18' 89°09'
A B
29°21' 29°21'
29°12' 29°12'
29°03' 29°03'
89°27' 89°18' 89°09' 89°27' 89°18' 89°09'
C D
29°21' 29°21'
29°12' 29°12'
29°03' 29°03'
Figure 4. Composited Advanced Land Observing Satellite (ALOS) synthetic aperture radar HV images. A, 2016, B, 2017, C, 2018, and D, 2019.
Lighter gray indicates higher HV amplitudes, and darker gray indicates lower HV amplitudes. The gray shading is directly comparable among
all four images.Results 9
89°27' 89°18' 89°09'
29°21'
29°12'
29°03'
0 5 MILES
0 5 KILOMETERS
Figure 5. Advanced Land Observing Satellite-2 HV color composite displaying the 2016 HV amplitude as red, 2017 HV amplitude as
green, and 2018 HV amplitude as blue. The same HV-magnitude color rendition was used for all 3 years.
and blue hues in images of these marshes represent slight vari- (Rangoonwala and others, 2020). In fact, similar features
ability in the marsh density from year to year. Some images shown in the LFC composite and HV composite indicate
of areas in the northeast part of Delta NWR exhibit more changes in density. A comparison of selected common regions
vivid hues indicating a somewhat elevated density contrast outlined on the LFC and HV composites helps elucidate the
between years. Low differences between years were also covariance of LFC and density in the P. australis marsh.
exhibited in the LFC composite within the eastern Delta NWR10 SAR and Optical Mapping Used to Monitor Change and Replacement, P. australis, Lower Mississippi River Delta, Louisiana
LFC and HV-Density Comparison A common pattern in the HV and LFC differences is
the 2016 to 2017 high decrease of HV amplitude, averaging
2018 and 2019 Field Site Comparison 74±22 percent (n=8) at all field sites. Also noticeable is that
while the HV consistently exhibited substantial decreases, 2016
HV Related to LFC to 2017 LFC differences were mixed, averaging –2±39 percent,
a value suggesting high variability in overall LFC change.
Although point scatter was high as indicated by the high
From 2017 to 2018, positive changes at all sites resulted in an
standard error (SE) associated with the regression intercepts,
overall 30±18-percent LFC increase and a 60±16-percent HV
the covariances exhibited by HV and LFC within 2018 and
increase from 2017 to 2018. From 2018 to 2019, decreases
separately within 2019 and between 2019 and 2018 are highly
at sites S6, R1S2, and R1S7 resulted in a low overall LFC
significant (≤0.0007) (table 2). The regressions for 2018 and
increase of 6±24 percent. Moderate to low increases character-
2019 exhibit a positive linear increase in HV with LFC. The
ized HV sites, leading to an overall increase of 34±21 percent
2019 and 2018 HV regression slope depicts a positive linear
from 2018 to 2019.
relationship close to 1, and the intercept indicates that HV
magnitudes were clearly higher in 2019 than in 2018 (table 2).
Regional Trajectory Descriptions and
Elephant-Ear Increase Related to HV and LFC Comparisons
The regressions between elephant-ear and HV, and par-
The 2016, 2017, and 2018 HV color-composite image
ticularly elephant-ear and LFC, contained scatter that could not
(fig. 5) was combined with the LFC color composite image
be conclusively accounted for. The variability in the alignment
from Rangoonwala and others (2020) for selection of regional
of the image pixel, especially after necessary post-processing
trajectory sites from the three regions shown in figure 2
for spatial alignment and scale and noise, was expected to be
(figs. 8 and 9). Trajectory plots constructed from LFC and HV
at times high at the single pixel level. Our decision was to
extracted from each of the 14 regional sites for 2016, 2017,
highlight the dominant trend by eliminating sites exhibiting
2018, and 2019 were plotted and normalized differences were
little relevance to that trend. In this regard, the noted trends
tabulated (table 3, fig. 10). As in the field trajectory workup,
are based on a reasonable expectation but are still subjective.
the most striking feature of the plots was change. At 12 of the
With that interpretation caveat, the 2019–2018 elephant-ear
15 regional sites, change was noted between 2016 and 2017,
versus 2019–2018 HV difference plot clearly exhibits a linear
between 2017 and 2018, and between 2018 and 2019. At the
decrease of HV with increase of elephant-ear percentage
remaining three regional sites (sites R1S3, R2S9, and R3S13),
(fig. 6A). Although high scatter weakens trend clarity, elephant-
change was notable only between one or two time periods.
ear tends to increase as LFC decreases (fig. 6B).
Secondly, P. australis berm HV magnitudes (regional sites
R1S2, R1S3, and R1S6) were substantially higher than basin
Trajectory Descriptions and Comparisons magnitudes as noted in the axes’ scales (figs. 10B, C, and E).
On average, the berm sites had somewhat higher LFC and sub-
Field Trajectory Descriptions and Comparisons stantially higher HV-density ranges than basin sites. Thirdly,
the berm sites exhibited a high decrease of HV density from
Along with HV and LFC dataset pairs from field sites 2016 to 2017, and even though of lower magnitudes, relatively
occupied in 2018 and 2019, similar datasets were incorporated substantial decreases occurred at 6 of the 12 basin sites (sites
from 2016 to 2017 in the trajectory analysis. Graphic portray- R1S4, R1S5, R1S8, R2S10, R3S13, and R3S14). At the four
als depict the trajectory pattern of selected field sites (fig. 7), remaining P. australis regional sites (sites R1S1, R2S9, R2S11,
and normalized and tabulated year-to-year HV and LFC R2S12), HV density did not change much from 2016 to 2017.
differences expose yearly patterns, groupings, and anomalies
(table 3).
Table 2. Simple regressions describing HV and LFC relationships.
[SE, standard error; R2, regression coefficient; obs, observations; model p>F, regression model; p, p value; >, greater than; F, F statistic; HV, horizontal send,
vertical receive; LFC, live fractional cover]
Regression Dependent Intercept (SE) Slope (SE) R2 obs model p>F
2018HV_2018LFC 2018HV 400.5 (148.7) 6.1 (1.4) 43.4 27 0.0002
2019HV_2019LFC 2019HV 471.3 (176.1) 9.1 (1.4) 61.6 27Discussion 11
A B
80 80
Incr EE = –0.0507 * HV + 75.31, n=12, R 2=0.89, RMSE=7.02
2019–2018 percent elephant-ear difference
2019–2018 percent elephant-ear difference
60 60
40 40
20 20
2019–2018 EE Change = –0.737 X 2019–2018 LFC Change + 65.345
0 0
0 400 800 1,200 1,600 −20 0 20 40 60 80
2019–2018 HV-amplitude difference 2019–2018 LFC-magnitude difference
Figure 6. The 2019 minus 2018 elephant-ear (EE) difference compared to the 2019 minus 2018 (A) HV-amplitude and (B) live fractional
cover (LFC) differences at berm sites (fig. 2; table 3). Sites shown with green symbols were used in the regression, and sites shown
with red symbols were not. [RMSE, root-mean-square error]
Discussion Trajectory plots from 2016 to 2019 represented 2018
and 2019 calibration field sites located on berms and non-
Yearly maps of the lower Mississippi River Delta from calibration regional sites primarily located in basins. Unless
2016 to 2019 of L-band SAR HV indicated that P. australis noted, all sites were located in P. australis marsh as defined
marsh density was highest along waterways and lowest within by a 2016 classification of the Delta NWR (Dugas and oth-
the intervening basins. HV mapping also indicated that the ers, 2018). Onsite observations in 2018 and 2019 at all field
P. australis marsh density was highly heterogeneous. Optical- sites and during one or both years at more than half of the
based maps of LFC exhibited similar patterns of variability regional sites documented the nature of the 2018 and 2019
(Rangoonwala and others, 2020). transitions. Trajectories show that 6 of the 8 berm field sites
The overall HV, as a density indicator, and LFC cor- and 4 of the 10 basin regional sites exhibited full P. australis
respondence was confirmed in regressions including HV and recovery (density and LFC) by 2019 after the decreases from
LFC data from field site locations for 2018 and 2019. All 2016 to 2017.
between- and within-year correspondences were positive and The common trajectory feature for all eight field sites is
significant (p ≤ 0.0007); however, point scatter was high, the large decrease in HV density from 2016 to 2017 that often
indicating high local variance. The similar patterns of mapped accompanied a mixed LFC response. Although trajectories
and plotted HV density and LFC overall correspondence, for field sites differed, following those decreases, HV density
while exhibiting high local variability, led to inspection of the and LFC mostly recovered or exceeded the 2016 magni-
HV and LFC local variability as an enhanced mechanism for tudes by 2019. At three of the five marsh field sites that were
tracking P. australis change. pure P. australis in 2018 (sites S1, S5, S9), that P. australis
The two-dimensional HV and LFC time-sequence plot is recovery included elephant-ear or weed partial replacement by
effective for highlighting change as well as showing the nature 2019. Of the two remaining pure P. australis field sites (sites
of the change; HV supplies the density, and LFC supplies S6, S8), site S6 is located on the edge of the Gulf of Mexico
the live composition information. HV changes are exhibited and experiences a high frequency of flushing, which may sus-
along one dimension, and LFC changes are exhibited along tain the pure monoculture. The second (site S8) is located near
the orthogonal dimension. The HV-LFC trajectories document another field site (S9) that was also pure P. australis marsh in
biophysical movement while retaining the capability of show- 2018 but had considerable weed replacement in 2019. Until
ing the density and live composition of the P. australis marsh. 2019, the only substantial difference between the S8 and
S9 sites was the much lower 2016 HV and LFC magnitudes12 SAR and Optical Mapping Used to Monitor Change and Replacement, P. australis, Lower Mississippi River Delta, Louisiana
Table 3. Mid-range normalized HV and LFC differences between years at field sites and regional sites at the U.S. Fish and Wildlife
Service Delta National Wildlife Refuge, 2016–19.
[Sites described as “not observed” were not visited in 2018 or 2019. Sites described as “not classified” were not included in the classification from Dugas and
others (2018). LFC, live fractional cover; HV, horizontal send, vertical receive; P. australis, Phragmites australis. LFC values calculated from maps contained in
Rangoonwala and others (2020)]
Site identifier LFC HV LFC HV LFC HV
Site description
(fig. 2) 2017–2016 2018–2017 2019–2018
Field sites (berm sites) occupied in 2018 and 2019
S1 75 –112 5 65 52 36 P. australis site in 2018; mixed P. australis and
elephant-ear site in 2019.
S2 –38 –96 33 88 2 13 Disturbed P. australis and elephant-ear site in 2018;
increased elephant-ear in 2019.
S3 5 –67 20 37 4 27 Low P. australis and high elephant-ear in 2018;
increased elephant-ear in 2019.
S5 –18 –44 17 61 –9 35 P. australis site in 2018; mixed P. australis and
elephant-ear site in 2019.
S6 35 –67 12 49 –38 –1 Eastern fringe P. australis site in 2018 and 2019.
S7 0 –93 52 79 4 42 Elephant-ear site in 2018; increased elephant-ear in
2019.
S8 –20 –51 48 63 20 74 P. australis site in 2018 and 2019.
S9 –56 –59 53 41 16 47 P. australis site in 2018; mixed P. australis and weeds
in 2019.
Regional sites (All basin sites except those identified as berm sites or tree stand)
R1S1 7 43 –16 5 –1 2 Not observed. Classified P. australis in 2016.
R1S2 –30 –92 34 13 –74 17 Berm: Not observed. Classified P. australis in 2016.
R1S3 14 –124 –3 24 –26 54 Berm: Not observed. Classified P. australis in 2016.
R1S4 –23 –83 –161 36 166 60 Not observed. Classified P. australis in 2016. Not
shown in figure 10.
R1S5 –38 –65 7 45 6 3 Observed edge 2018 and 2019. Increasing elephant-
ear subcanopy.
R1S6 –2 –106 16 40 15 53 Berm: Observed 2018 and 2019. No P. australis;
increasing elephant-ear.
R1S7 –30 –32 40 7 –65 24 Observed 2018 and 2019. Tree and shrub stand.
R1S8 –6 –88 –39 51 29 10 Observed edge 2018 and 2019. Mix with increasing
elephant-ear in 2019.
R2S9 –4 –16 –22 23 1 –8 Observed 2019. High mix of woody and grass types.
R2S10 –63 –41 –20 39 35 2 Not observed and not classified in 2016. Not shown
in figure 10.
R2S11 21 9 –6 39 –18 –39 Observed. Plants, shrubs, grasses. Eastern fringe site.
R2S12 10 –14 –33 32 25 –36 Observed at distance. Degrading P. australis eastern
fringe.
R3S13 –11 –98 5 34 0 –8 Not observed. Site referenced in Knight and others
(2019).
R3S14 26 52 –13 15 –24 –44 Not observed and not classified in 2016.Discussion 13
160 120
A B
Sentinel-2 live fractional cover (X 2.56)
120
100
80
80
40
Field site 1 Field site 2
0 60
400 800 1,200 1,600 2,000 2,400 0 400 800 1,200 1,600 2,000
140 100
C D
Sentinel-2 live fractional cover (X 2.56)
120
90
100
80
80
60
Field site 3 Field site 5
40 70
400 800 1,200 1,600 2,000 400 800 1,200 1,600
90 180
E F
Sentinel-2 live fractional cover (X 2.56)
160
80
140
70
120
60
100
50
80
Field site 6 Field site 7
40 60
200 400 600 800 1,000 1,200 0 400 800 1,200 1,600 2,000 2,400
ALOS-2 HV backscatter amplitude (X 10,000) ALOS-2 HV backscatter amplitude (X 10,000)
Figure 7. Trajectories for Sentinel-2 live fractional cover and Advanced Land Observing Satellite-2 (ALOS-2) HV
amplitudes for field sites, 2016–19 (table 3). On graphs circles signify 2016 data, squares 2017 data, triangles 2018
data, and crosses 2019 data. Note: The graph for field site 3 does not have trajectory arrows because a pattern
was unclear.14 SAR and Optical Mapping Used to Monitor Change and Replacement, P. australis, Lower Mississippi River Delta, Louisiana
160 160
G H
Sentinel-2 Live Fractional Cover (X 2.56)
140 140
120 120
100 100
80 80
Field site 8 Field site 9
60 60
400 800 1,200 1,600 2,000 2,400 400 800 1,200 1,600 2,000
ALOS-2 HV backscatter amplitude (X 10,000) ALOS-2 HV backscatter amplitude (X 10,000)
Figure 7.—Continued
A
A B
B
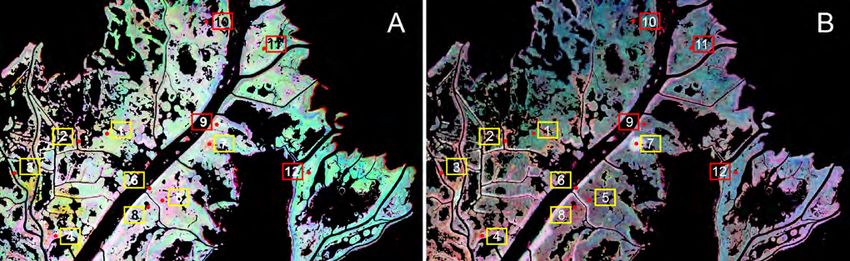
Figure 8. (A) Sentinel-2 composite image showing live fractional cover for 2016, 2017, and 2018. (B) Advanced Land Observing
Satellite-2 composite image showing HV amplitudes for 2016, 2017, and 2018. Sites in region 1 are outlined in yellow; sites in region
2 are outlined in red (all sites shown in orange in fig. 2).
A
A B
B
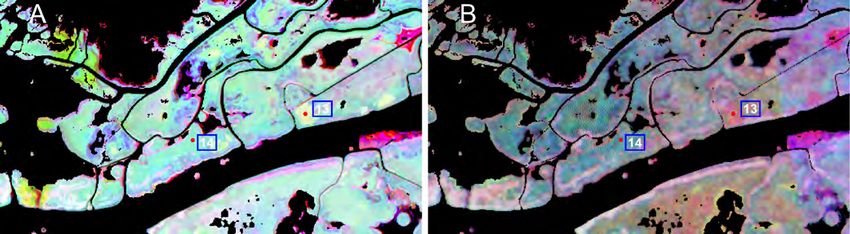
Figure 9. (A) Sentinel-2 composite image showing live fractional cover for 2016, 2017, and 2018. (B) Advanced Land Observing
Satellite-2 composite image showing HV amplitudes for 2016, 2017, and 2018. Sites shown are in region 3 (shown in orange in fig. 2).Discussion 15
130 150
A 140
B
Region 1 Site 1
Sentinel-2 live fractional cover (X 2.56) 125 130
120
120
110
100
115
90
80
110
70
105 60
50 Region 1 Site 2
100 40
200 400 600 800 400 800 1,200 1,600 2,000
130 160
C Region 1 Site 3 D Region 1 Site 5
150
Sentinel-2 live fractional cover (X 2.56)
120
140
130
110
120
100 110
100
90
90
80 80
400 800 1,200 1,600 2,000 2,400 200 300 400 500 600 700 800
205 160
200 E F Region 1 Site 7
Region 1 Site 6 150
Sentinel-2 live fractional cover (X 2.56)
195
190 140
185 130
180
120
175
170 110
165
100
160
155 90
150 80
145
70
140
135 60
400 800 1,200 1,600 2,000 2,400 2,800 3,200 1,200 1,600 2,000 2, 400
ALOS-2 HV backscatter amplitude (X 10,000) ALOS-2 HV backscatter amplitude (X 10,000)
Figure 10. Trajectories for Sentinel-2 live fractional cover and Advanced Land Observing Satellite-2 (ALOS-2)
HV backscatter amplitudes for regional sites, 2016–19 (table 3). [Circles signify 2016 data, squares 2017 data,
triangles 2018 data, and crosses 2019 data]16 SAR and Optical Mapping Used to Monitor Change and Replacement, P. australis, Lower Mississippi River Delta, Louisiana
140 135
G Region 1 Site 8 H
130
Sentinel-2 live fractional cover (X 2.56)
130 Region 2 Site 9
125
120
120
110 115
110
100
105
90
100
80 95
200 400 600 800 1,000 200 300 400 500 600
140 140
I J
Region 2 Site 11
Sentinel-2 live fractional cover (X 2.56)
130
120
110 120
100
90
Region 2 Site 12
80 100
300 400 500 600 700 800 900 200 300 400 500 600 700 800 900
150 140
K L Region 3 Site 14
Region 3 Site 13 135
Sentinel-2 live fractional cover (X 2.56)
130
125
140
120
115
110
105
130
100
95
90
120 85
400 600 800 1,000 1,200 1,400 1,600 200 300 400 500 600 700 800
ALOS-2 HV backscatter amplitude (X 10,000) ALOS-2 HV backscatter amplitude (X 10,000)
Figure 10.—ContinuedSummary 17
at the S8 site relative to S9. That observed single incidence elephant-ear increase and HV-density and LFC decrease can
does not confirm the 2016 to 2017 dieback as related to the be used to spatially map probable locations of elephant-ear
increased replacement of P. australis by weeds and elephant- increase throughout the Delta NWR for 2019.
ear in 2019. That observation does, however, show the power
of the trajectory tool to advance the understanding of P.
australis response to causal agents of change and dramatically Technology Transfer
advance early identification of adverse change.
To maximize the potential for technology transfer, the
At the field sites that were composed of P. australis and
SAR mapping is based on consistently collected ALOS satel-
elephant-ear or pure elephant-ear in 2018 (sites S2, S3, S7),
lite image data that, along with free optical data, can be pro-
elephant-ear had dramatically increased in size (height and
cessed with free software implemented on a local workstation
width) by 2019. At the field sites that were composed of mixed
and subsequently analyzed and output with free geographic
P. australis and elephant-ear in 2018 (sites S2, S3), elephant-
information system software.
ear increased in cover by 2019. The elephant-ear growth spurt
is likely related to the elephant-ear replacement of P. australis
marsh from 2018 to 2019.
From 2016 to 2017, HV and LFC decreased at five of the Summary
nine regional basin sites (R1S4, R1S5, R1S8, R2S10, R3S13),
increased at three sites (R1S1, R2S11, R3S14), and remained The U.S. Geological Survey (USGS), in cooperation
largely unchanged at site R2S12. Two of the basin sites (sites with the U.S. Fish and Wildlife Service (FWS), used satellite
R1S5, R1S8) exhibiting decrease were observed as mixed P. mapping of Phragmites australis marsh density along with
australis sites in 2018, with increasing elephant-ear replace- Advanced Land Observing Satellite (ALOS) L-band synthetic
ment in 2019. Additional basin sites exhibiting increase were aperture radar (SAR) HV data to determine P. australis marsh
located at the northeastern extreme of the Delta NWR bound- dieback onset and progression in the lower Mississippi River
ary. At one of these sites (R2S11), direct observation in 2019 Delta. The ALOS L-band SAR HV polarization provides a
revealed that the region has converted to a mixture of shrubs unique perspective of the lower Mississippi River Delta, and
and plants with little or no P. australis. Another of these sites in particular, the FWS Delta National Wildlife Refuge (NWR)
(R2S12) was reported to be highly degraded. P. australis marsh density patterns. HV-density maps identi-
In addition to revealing changing compositions solely fied two broad classes of density: high density on berms lining
related to 2016 to 2018 HV-density and LFC changes, the full the many canals and low P. australis marsh density in basins
2016 to 2019 regional trajectories identified non-P. austra- lying between intermediate berms. Density maps prepared
lis marsh (fig. 10). Observations in 2019 confirmed that the for 2016, 2017, 2018, and 2019 indicated dramatic to subtle
abnormal trajectory pattern for site R1S7 indicated a stand local changes of P. australis density throughout the lower
of trees and shrubs, and observations at site R1S9 confirmed Mississippi River Delta within a backdrop of broad yearly
a variable mix of vines, plants, and sparse P. australis. change. The yearly density changes mostly aligned with exist-
The abnormal trajectory for site R3S13 revealed a stand of ing optical live fractional cover (LFC) status and trends maps,
European P. australis. That stand experienced extreme loss but local variability within density and LFC maps differed.
of density and moderate loss of LFC from 2016 to 2017 and That yearly alignment and local difference motivated the
showed little recovery through 2019. This variety of P. austra- development of a unique tool to detect and track P. australis
lis marsh is easily discerned in the SAR temporal composite marsh change and to assess the causal nature of the change.
(fig. 9). This tool comprised trajectory plots complemented by tabular
statistics to represent the coupled temporal changes of both
critical biophysical components of the P. australis marsh: LFC
Elephant-Ear Increase Related to HV and LFC and density.
Trajectory plots and tabular statistics were developed for
One possible consequence of decreasing P. australis
berm and basin P. australis marsh sites by using data extracted
marsh density was the replacement by elephant-ear at field
from the yearly 2016 to 2019 HV-density and LFC maps of
and observed regional sites. The initial contention was that
sites throughout the Delta NWR. Trajectories indicated a
elephant-ear replacement would result in increased LFC and
dramatic density decrease from 2016 to 2017 at all 8 berm
decreased HV density in comparison to pure P. australis
sites and 6 of the 12 basin sites; LFC change was mixed. Full
marsh. Although scatter reduced confidence, the correla-
HV and LFC recovery occurred at most of those sites by 2019.
tion results support the HV-density decrease but not the
Between November 2018 and August 2019, however, partial
LFC increase. The elephant-ear addition increasingly damp-
replacement of P. australis marsh by elephant-ear occurred at
ened the 2018 to 2019 HV-density and LFC increase until
most of the berm field sites, and replacement increased in two
elephant-ear covered 60–80 percent of the site. At that point,
observed basin sites. In addition, the trajectory tool identified
the overall 2018 to 2019 HV-density and LFC increase was
abnormal trajectories for two basin sites that had transitioned
reversed. Work is needed to assess whether these patterns of
to a mixture of plant species and for a third basin site that had18 SAR and Optical Mapping Used to Monitor Change and Replacement, P. australis, Lower Mississippi River Delta, Louisiana
transitioned to degraded marsh. A fourth basin site was identi- Knight, I., Cronin, J., Diaz, R., Nyman, A., and Wilson,
fied as having European P. australis instead of the dominant B., 2019, Understanding the role the roseau cane scale
P. australis. The trajectory tool exposed a density loss event on Phragmites die‐offs at the Mississippi River Delta:
that may have increased the P. australis marsh exposure to Louisiana State University AgCenter, 30-slide presentation,
latent replacement during the 2018 to 2019 elephant-ear May 10, 2019.
growth spurt. These examples from the myriad patterns pos-
sible demonstrate the enhanced information the trajectory tool Ramsey, E., III, 1998, Radar remote sensing of wetlands,
can provide for resource managers. This tool can help move in Lunetta, R., and Elvidge, C., eds., Remote sensing
management response from restoration to early detection and change detection—Environmental monitoring methods and
mitigation, thus decreasing irreversible changes, such as dam- applications: Ann Arbor, Michigan, Ann Arbor Press, Inc.,
age caused by insect infestation. p. 211–243.
The same field data used in development of the trajectory Ramsey, E., III, and Jensen, J., 1995, Modeling mangrove
tool were used to explore detection of elephant-ear replace- canopy reflectance using a light interaction model and an
ment of P. australis marsh. The data indicated a significant optimization technique, in Lyon, J., and McCarthy, J., eds.,
negative relationship between HV-density change and change Wetland and environmental applications of GIS: Boca
in the percentage of elephant-ear coverage from 2018 to 2019. Raton, Florida, CRC Press, Inc., p. 61–81.
A similar but more scattered decrease in LFC with increasing
elephant-ear was indicated. Although corroboration is needed, Ramsey, E., III, Nelson, G., Sapkota, S., Laine, S., Verdi,
evidence indicates that a refined trajectory tool could be used J., and Krasznay, S., 1999, Using multiple polariza-
to detect P. australis marsh replacement. tion L band radar to monitor marsh burn recovery: IEEE
Transactions on Geoscience and Remote Sensing, v. 37,
no. 1, p. 635–639. [Also available at https://doi.org/10.1109/
36.739136.]
References Cited
Ramsey, E., III, and Rangoonwala, A., 2017, Mapping the
Baurick, T., 2017, Roseau cane plague on Louisiana change of Phragmites australis live biomass in the lower
coast might have started a year earlier: New Orleans, Mississippi River Delta marshes: U.S. Geological Survey
Louisiana, The Times-Picayune, August 12, 2017, accessed Open-File Report 2017–1098, accessed February 23, 2021,
October 19, 2020, at https://www.nola.com/environment/ at https://doi.org/10.3133/ofr20171098.
index.ssf/2017/08/mississippi_delta_wetland_plag.html. Ramsey, E., III, Rangoonwala, A., and Bannister, T.,
Bourgeau-Chavez, L.L., Kowalski, K.P., Carlson Mazur, M.L., 2013, Coastal flood inundation monitoring with satel-
Scarbrough, K.A., Powell, R.B., Brooks, C.N., Huberty, B., lite C-band and L-band synthetic aperture radar data:
Jenkins, L.K., Banda, E.C., Galbraith, D.M., Laubach, Z.M., Journal of the American Water Resources Association,
and Riordan, K., 2013, Mapping invasive Phragmities aus- v. 49, no. 6, p. 1239–1260, accessed February 23, 2021, at
tralis in the coastal Great Lakes with ALOS PALSAR satel- https://doi.org/10.1111/jawr.12082.
lite imagery for decision support: Journal of Great Lakes Ramsey, E., III, Rangoonwala, A., Chi, Z., Jones, C.E., and
Research, v. 39, no. 1, p. 65–77, accessed February 23, Bannister, T., 2014, Marsh dieback, loss, and recovery
2021, at https://doi.org/10.1016/j.jglr.2012.11.001. mapped with satellite optical, airborne polarimetric radar,
Bourgeau-Chavez, L.L., Riordan, K., Powell, R.B., Miller, N., and field data: Remote Sensing of Environment, v. 152,
and Nowels, M., 2009, Improving wetland characterization p. 364–374. [Also available at https://doi.org/10.1016/
with multi-sensor, multi-temporal SAR and optical/infrared j.rse.2014.07.002.]
data fusion, in Jedlovec, G., ed., Advances in geoscience Ramsey, E., III, Rangoonwala, A., and Jones, C.E., 2015,
and remote sensing, p. 679–708, accessed February 23, Structural classification of marshes with polarimetric SAR
2021, at https://cdn.intechopen.com/pdfs/9542.pdf. highlighting the temporal mapping of marshes exposed to
Coastal Protection and Restoration Authority, 2020, Coastwide oil: Remote Sensing, v. 7, no. 9, p. 11295–11321, accessed
Reference Monitoring System: Coastal Protection February 23, 2021, at https://doi.org/10.3390/rs70911295.
and Restoration Authority online database, accessed Ramsey, E., III, Rangoonwala, A., and Jones, C.E., 2016,
November 25, 2020, at https://www.lacoast.gov/CRMS/. Marsh canopy structure changes and the Deepwater
Dugas, J.L., SooHoo, W.M., Enwright, N.M., and Couvillion, Horizon oil spill: Remote Sensing of Environment, v. 186,
B.R., 2018, Phragmites australis maps and change, Delta p. 350–357. [Also available at https://doi.org/10.1016/
National Wildlife Refuge, Louisiana (2011, 2013, 2016): j.rse.2016.08.001.]
U.S. Geological Survey data release, accessed March 8,
2021, at https://doi.org/10.5066/F7K936RG.You can also read