Brine Pipeline and Outfall - Appendix E Discharge Monitoring and Management Plan February 2021
←
→
Page content transcription
If your browser does not render page correctly, please read the page content below
Appendix E
 Discharge Monitoring and Management Plan
 Brine Pipeline and Outfall
 February 2021

WATER | ENERGY & RESOURCES | ENVIRONMENT | PROPERTY & BUILDINGS | TRANSPORTATION
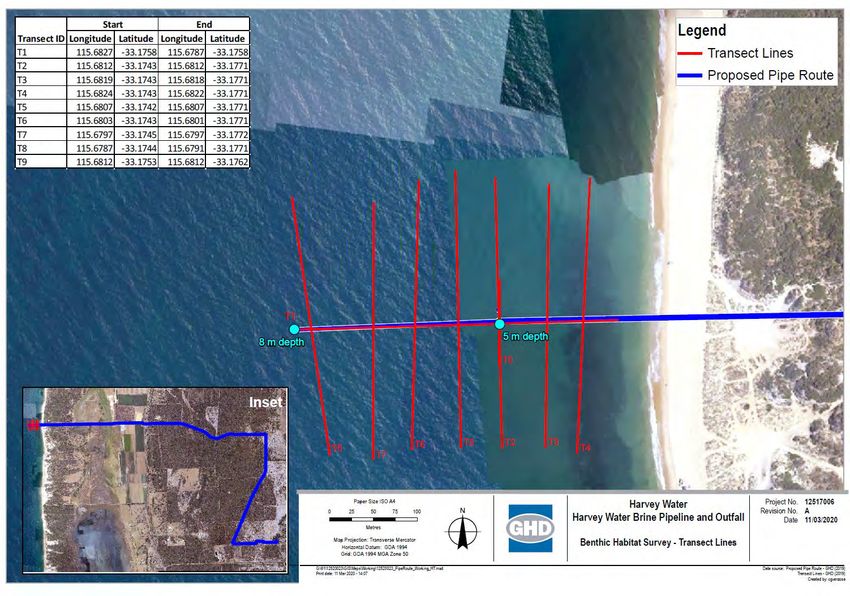
Table of contents
 1. Introduction ...............................................................................................................................1
 1.1 The Harvey Water KSIA Project.......................................................................................1
 1.2 Document Purpose..........................................................................................................1
 1.3 Scope..............................................................................................................................2
 1.4 Assumptions and limitations ............................................................................................2
 1.5 Review Period .................................................................................................................2
 1.6 Limitation of Liability ........................................................................................................3
 2. Regulatory Regime ...................................................................................................................4
 2.1 Environmental Protection Act 1986 ..................................................................................4
 2.2 Environmental Quality Criteria .........................................................................................5
 3. Water Quality Objectives ...........................................................................................................6
 3.1 Defining Water Quality Objectives ...................................................................................6
 3.2 Modelling-based WQO considerations .............................................................................6
 3.3 Modelling Results ............................................................................................................8
 4. Environmental Effects .............................................................................................................11
 4.1 Benthic Habitats ............................................................................................................11
 4.2 Water Quality ................................................................................................................15
 5. Monitoring Programme ............................................................................................................16
 5.1 Mixing Zone ..................................................................................................................16
 5.2 Baseline Water Quality Monitoring ................................................................................. 16
 5.3 Monitoring Transects and Target Locations ................................................................... 16
 5.4 Field Monitoring Frequency ........................................................................................... 16
 5.5 Reference Sampling ......................................................................................................21
 5.6 Underwater Video Monitoring ........................................................................................ 21
 5.7 Data Collection and Recording ...................................................................................... 22
 5.8 Record Keeping, Data Sharing and QA/QC ................................................................... 23
 5.9 Limitations .....................................................................................................................23
 6. Safety, Roles and Responsibilities ...........................................................................................24
 6.1 Quarterly Field Monitoring .............................................................................................24
 6.2 Yearly Underwater Video Monitoring.............................................................................. 25
 7. Reporting ................................................................................................................................27
 7.1 Biannual Field Monitoring and Water Sample Analysis................................................... 27
 7.2 Annual Benthic Underwater Video Monitoring ................................................................ 27
 7.3 Management Response.................................................................................................28
 8. References .............................................................................................................................29

 | Harvey Water Report - Brine Pipeline and Outfall, 12543714 | i
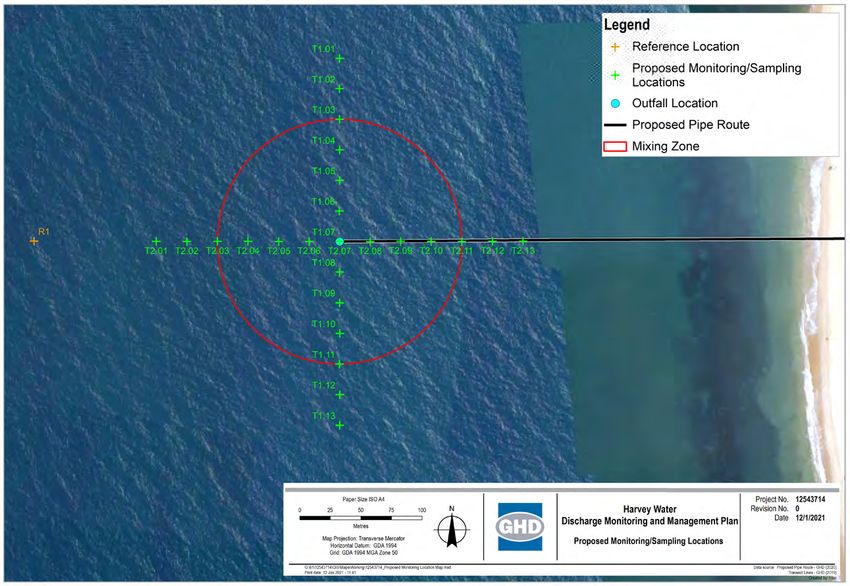
Table index
 Table 1-1 Location of proposed Harvey Water KSIA outfall..................................................................2

 Table 2-1 Environmental factors and objectives for theme ‘Sea’ (EPA, 2020a).....................................4
 Table 3-1 Summary of water quality data and dilution calculations .......................................................7
 Table 4-1 Summary of the biota encountered during the underwater video survey (GHD,
 2021b)...........................................................................................................................12
 Table 5-1 Proposed KSIA outfall monitoring transect location details ................................................. 18
 Table 5-2 Water sample analytes and proposed laboratory methods (note: will be refined in
 consultation with the selected laboratory) ...................................................................... 20
 Table 5-3 Water sample identifiers ....................................................................................................22

Figure index
 Figure 1-1 Proposed wastewater pipeline and ocean outfall location....................................................1
 Figure 3-1 Maximum predicted extent to achieve a dilution of 46-fold or greater for the
 summer simulation (left) and winter simulation (right) (GHD, 2020a) .............................. 10
 Figure 4-1 KSIA outfall benthic habitat underwater video survey location and target transect
 lines (GHD, 2020b)........................................................................................................11
 Figure 4-2 Reef types encountered during the underwater video survey (GHD, 2021b)...................... 12
 Figure 4-3 Seagrass patch (Amphibolis spp.) in nearshore waters (GHD, 2020b) .............................. 13
 Figure 4-4 Seagrass distribution along the underwater video survey transect lines (actual)
 (GHD, 2020b) ................................................................................................................13
 Figure 4-5 Macroalgae distribution along the underwater video survey transect lines (actual)
 (GHD, 2020b) ................................................................................................................14
 Figure 5-1 Proposed transect locations .............................................................................................19

 | Harvey Water Report - Brine Pipeline and Outfall, 12543714 | ii

Abbreviations
 Abbreviation Definition

 ANZECC Australian and New Zealand Environment and Conservation Council

 ARMCANZ Agriculture and Resource Management Council of Australia and New
 Zealand

 COC Chain of Custody

 DMMP Discharge Monitoring and Management Plan

 EPA Environmental Protection Authority

 EPIRB Emergency Position Indicating Radio Beacon

 EQC Environmental Quality Criteria

 HSE Health Safety and Environmental

 IUCN International Union for the Conservation of Nature

 JHA Job Hazard Analysis

 km kilometres

 KSIA Kemerton Strategic Industrial Area

 LOR Limit of Reporting

 m Metres

 NATA National Association of Testing Authorities

 NWQMS National Water Quality Management Strategy

 PPE Personal Protective Equipment

 PSU Practical Salinity Units

 QA/QC Quality Assurance/ Quality Control

 RIB Rigid Inflatable Boat

 RPD Relative Percentage Difference

 RO Reverse Osmosis

 SDS Safety Data Sheet

 TDS Total Dissolved Solids

 UM3 Update Merge 3

 WA Western Australia

 WET Whole Effluent Toxicity

 WQO Water Quality Objective

 | Harvey Water Report - Brine Pipeline and Outfall, 12543714 | i
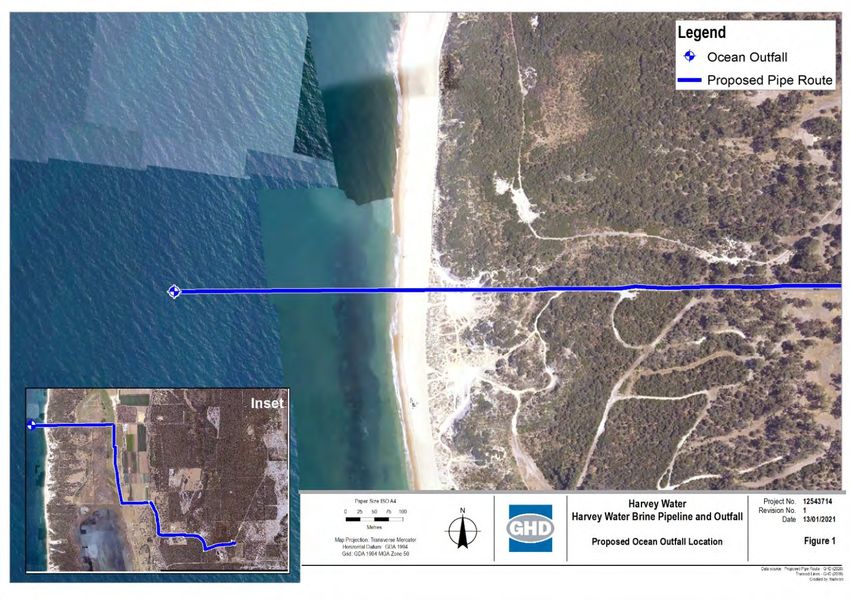
1. Introduction
 1.1 The Harvey Water KSIA Project
 Harvey Water supplies non-potable water to rural areas in the south-west region primarily for
 agricultural industry use. Water is drawn under license from Waroona, Drakesbrook, Logue
 Brook, Harvey and Wellington Dams, and the Wokalup pipe head. Water is piped under gravity
 pressure through 495 kilometres (km) of closed pipelines and 256 km of open channels to its
 customers (Harvey Water, 2020).
 Harvey Water is constructing enabling infrastructure at the Kemerton Strategic Industrial Area
 (KSIA), Western Australia (WA) to provide wastewater disposal services to customers
 established in the KSIA. This enabling infrastructure consists of a pipeline, approximately 9.5
 km long, connecting to an existing 1.5 km section. The final pipeline is approximately 11 km in
 length and extends from the Kemerton Strategic Industry Area to the Indian Ocean. The
 proposed pipeline route and ocean outfall (the Proposal) are shown in Figure 1-1.

 Figure 1-1 Proposed wastewater pipeline and ocean outfall location

 1.2 Document Purpose
 Harvey Water has a planning proposal for the construction of the KSIA pipeline and marine
 outfall that will be submitted to the responsible authority (Shire of Harvey Planning and
 Environment Department). The Proposal will also be referred to the Environmental Protection

 GHD | Report for Harvey Water - Brine Pipeline and Outfall, 12543714 | 1
Authority (EPA) for assessment under Section 38 of the Environmental Protection Act 1986
(Government of Western Australia, 2020).
The EPA has stated that a Discharge Monitoring and Management Plan (DMMP) is required for
the Proposal. The Proposal will operate with a peak discharge of 15 liters per second (L/s).
The pipeline infrastructure has a maximum flow capacity of 72 L/s which may be utilised in the
event of a future expansion of the customer base, noting that the initial flow rates once
commissioned and operational, will be in line with the peak flow rate referred to the EPA for the
Proposal (15 L/s).
The purpose of this document is to provide the foundation for a long-term monitoring framework
and safisfy the EPA monitoring requirements.

1.3 Scope
The scope of this DMMP is for the proposed KSIA pipeline outfall at the location shown in Table
1-1 and Figure 1-1, which lies 3.3 km west of Parkfield, and approximately 2.5 km south of
Binningup, WA. The outfall will be buried and extend from the shoreline to approximately 400
metres (m), where it will emerge from the seabed. The outfall will lie on the seabed in
approximately 8 m of water.
Table 1-1 Location of proposed Harvey Water KSIA outfall

 Easting Northing Geodetic Reference
 Proposed Harvey
 Water KSIA outfall 115.678997 -33.175668 GDA94, MGA Zone 50
 location

This DMMP covers the monitoring of discharge into the Indian Ocean from this specific location
from the proposed KSIA pipeline outfall.

1.4 Assumptions and limitations
It should be noted that no specific baseline data are available for water quality in the vicinity of
the proposed KSIA outfall, as no baseline water quality monitoring has been undertaken to date.
Baseline reference data may be available from outfalls in the wider area; Harvey Water is
currently investigating to determine if such data is available from other operators.
Criteria for monitoring have been derived based upon relevant guidelines. Further criteria can
also be derived from future reference water sampling once a suitable number of samples have
been obtained.
The monitoring programme proposes taking measurements and samples of surface waters in
the field in the vicinity of the discharge that will require the use of a small vessel. This has the
potential to affect the measurements and samples, and hence affect the monitoring results.
Consideration of this has been taken into account in the procedures developed for the
monitoring programme.

1.5 Review Period
This document should be reviewed in accordance with applicable Harvey Water internal policies
and procedures. As the monitoring programme will be ongoing on a quarterly basis the DMMP
be reviewed annuallly to ensure that the monitoring programme is achieving its objectives.
The review period acknowledges the likelihood that the customer base of the KSIA system is
likely to increase in the future, and hence the wastewater discharge rate has potential to

 GHD | Report for Harvey Water - Brine Pipeline and Outfall, 12543714 | 2
increase. The DMMP be reviewed each time a significant change to the KSIA system is
proposed.

1.6 Limitation of Liability

This report: has been prepared by GHD for Harvey Water and may only be used and relied on by Harvey
Water for the purpose agreed between GHD and Harvey Water as set out in section 1.3 of this report.

GHD otherwise disclaims responsibility to any person other than Harvey Water arising in connection with
this report. GHD also excludes implied warranties and conditions, to the extent legally permissible.

The services undertaken by GHD in connection with preparing this report were limited to those specifically
detailed in the report and are subject to the scope limitations set out in the report.

The opinions, conclusions and any recommendations in this report are based on conditions encountered
and information reviewed at the date of preparation of the report. GHD has no responsibility or obligation
to update this report to account for events or changes occurring subsequent to the date that the report was
prepared.

The opinions, conclusions and any recommendations in this report are based on assumptions made by
GHD described in this report. GHD disclaims liability arising from any of the assumptions being incorrect.

GHD has prepared this report on the basis of information provided by Harvey Water and others who
provided information to GHD (including Government authorities), which GHD has not independently
verified or checked beyond the agreed scope of work. GHD does not accept liability in connection with
such unverified information, including errors and omissions in the report which were caused by errors or
omissions in that information.

 GHD | Report for Harvey Water - Brine Pipeline and Outfall, 12543714 | 3
2. Regulatory Regime 2.1 Environmental Protection Act 1986 The Environmental Protection Authority exercises its powers under the Environmental Protection Act 1986 (Government of Western Australia, 2020). Section 44 (2) establishes that the EPA must make reference to key environmental factors when assessing the potential environmental impacts of a referred proposal. Environmental factors are those parts of the environment that may be impacted by an aspect of a proposal or scheme. The EPA has 14 environmental factors, organised into five themes: Sea, Land, Water, Air and People. The factors and objectives for sea are set out in Table 2-1. Table 2-1 Environmental factors and objectives for theme ‘Sea’ (EPA, 2020a) Theme Factor Objective Sea 1. Benthic Communities To protect benthic communities and habitats so that and Habitats biological diversity and ecological integrity are maintained. 2. Coastal Processes To maintain the geophysical processes that shape coastal morphology so that the environmental values of the coast are protected. 3. Marine Environmental To maintain the quality of water, sediment and biota Quality so that environmental values are protected. 4. Marine Fauna To protect marine fauna so that biological diversity and ecological integrity are maintained. Of particular relevance to this DMMP are ‘to protect benthic communities and habitats’ (factor 1), and ‘to maintain the quality of water’ (factor 3). These are the key EPA considerations around which the monitoring programme defined within this DMMP has been designed. 2.1.1 Water Quality The EPA environmental factor guideline for marine environmental quality (EPA, 2016a) applies to the State’s coastal waters and estuaries. Environmental quality refers to the level of contaminants in water, sediments or biota or to changes in the physical or chemical properties of waters and sediments relative to a natural state; in the context of marine water quality, emissions or discharges that can cause water quality deterioration are the key considerations. The National Water Quality Management Strategy (NWQMS) defines five nationally agreed (i.e. applicable to all States) environmental values that must be protected: Ecosystem health; Fishing and aquaculture; Recreation and aesthetics; Industrial water supply; Cultural and spiritual. 2.1.2 Benthic Communities and Habitats The environmental factor guideline for benthic communities and habitats recognises that benthic habitats and communities are important components of all marine ecosystems and are GHD | Report for Harvey Water - Brine Pipeline and Outfall, 12543714 | 4
fundamental to the maintenance of ecological integrity and biological diversity of the marine
environment as a whole. Wastewater discharges have the potential to affect the quality of
water, sediment and biota in the vicinity of the discharge and impact on the health of benthic
communities (EPA, 2016b).
When considering potential impacts to benthic communities the EPA is mainly concerned with
changes that are likely to significantly impact biological diversity and ecological integrity and is
therefore focused on the extent, severity and duration of impacts and whether any consequent
losses to benthic communities are temporary or permanent.

2.2 Environmental Quality Criteria
Environmental quality criteria (EQC) are scientifically derived limits of acceptable change (Δ) to
a measurable environmental quality indicator that is important for the protection of the
associated environmental value (EPA, 2016c). EQC are commonly applied through a risk-
based approach intended to capture uncertainty around the level of impact by staging
monitoring and management responses according to the degree of risk to environmental quality
(EPA, 2016b), which in the case of the KSIA outfall is deemed as low risk due to the make-up of
the wastewater discharge, the relatively modest flow rate and the dispersive nature of the
receiving environment.
For the proposed KSIA outfall, a low level of ecological protection is proposed that is defined by
the zone of initial dilution. Relevant water quality objectives (WQOs) have been defined based
upon the make-up of the wastewater discharge and using a precautionary approach (refer to
section 3).

 GHD | Report for Harvey Water - Brine Pipeline and Outfall, 12543714 | 5
3. Water Quality Objectives 3.1 Defining Water Quality Objectives The Water Quality Objectives (WQOs) at the edge of the mixing zone for key parameters of concern in the wastewater discharge were developed as follows: For toxicants or physical and chemical stressors, the mixing zone criteria are adopted from the ANZG (2018) guidelines. 1 For water treatment chemicals, ecotoxicity information was sourced from Safety Data Sheets (SDSs) of each chemical for various marine species. As a conservative measure, the lowest toxicity concentration (i.e. requiring the highest dilution) was adopted as the WQO for each water treatment chemical. Ecotoxicity dosages are dependent on concentration and exposure time (e.g. 50 mg/L over 96 hours). The time component was not considered during modelling, so the concentration was conservatively assumed to be toxic for instantaneous exposure. For salinity, a conservative salinity target of
− = − where: D = Target dilution factor CO = Outlet concentration CT = Target concentration to achieve the WQO CA = Ambient (background) concentration At the time of the modelling assessment, no ambient data for the discharge site were available, therefore dilution targets are calculated on the basis of assumed ambient concentrations using professional judgement. Concentrations for each analyte are provided in Table 3-1. For the water treatment chemicals, concentrations were given for the feedwater to the reverse osmosis (RO) plant (not the outlet concentrations). Therefore, outlet concentrations for water treatment chemicals were estimated on the following basis: The treatment chemical is assumed to be conserved (i.e. not degraded) throughout the RO process and within the wastewater holding tanks and discharge pipe. This assumption is very conservative, as these chemicals are highly reactive. The entire mass of the chemical is assumed to be removed from the RO product water and transmitted entirely to the wastewater stream (i.e. the outlet). The concentration in the RO feed water was therefore assumed to increase in the wastewater discharge proportionally to the ratio of RO feedwater flow-rate to the wastewater discharge flow-rate (a factor of 7.7). The calculated dilution targets for the analytes of interest are summarised in Table 3-1. Table 3-1 Summary of water quality data and dilution calculations Parameter Units CO CT CA D Total Dissolved Solids mg/L 11,996.0 Refer to Salinity Refer to Salinity Refer to Salinity (TDS) pH unitless 8.51 8.0-8.4 8.3 2 23 4 Temperature °C 20-25 Not Assessed Hardness as CaCO3 mg/L 7,798.6 No Criterion 5 NA 5 Calcium mg/L 899.5 No Criterion NA 5 Magnesium mg/L 1,354.2 No Criterion NA Sodium mg/L 7,488.3 No Criterion5 NA 5 Potassium mg/L 229.1 No Criterion NA 5 Barium mg/L 1.9 No Criterion NA 5 Alkalinity mg/L 3,650.5 No Criterion NA Sulphate mg/L 1,796.6 No Criterion5 NA 5 Chloride mg/L 13,572.8 No Criterion NA 5 Fluoride mg/L 9.8 No Criterion NA 2 Ambient pH assumed to be 75th percentile of the acceptable water quality range. 3 Dilution was calculated on the basis of H+ ion concentrations (not pH directly, since pH is a logarithmic scale). 4 Discharged water will have a similar temperature to the ambient air temperature. No significant differences are expected between the discharge and the near-shore coastal water. 5 Parameter is not classed as a marine toxicant – no criterion available. GHD | Report for Harvey Water - Brine Pipeline and Outfall, 12543714 | 7
Parameter Units CO CT CA D
 6
 Nitrate mg/L 2.8 0.70 0.0025 4
 Phosphate mg/L 0.2 No Criterion5 NA
 Silica mg/L 356.1 No Criterion5 NA
 Boron mg/L 2.0 5.10 NA NA 7
 Salinity PSU 11.91 8 34.5 9 359 46
 Water Treatment Chemicals
 Sodium Molybdate mg/L 152.7 10 50 (Acohs, 2014) 0 3

 THPS (Biocide) mg/L 381.710 15 (Frayne, 2017) 0 25

 Phosphonates (PBTC) mg/L 77.410 33.3 (NM&C Co., 2015) 0 2

 Phosphonates (HEDP) mg/L 77.410 3 (SPE Chemicals, 2020) 0 26

 Polyacrylate mg/L 2.910 100 (Recyc PHP, 2020) 0 No dilution required

 Azole mg/L 38.210 100 (Ibis Water, 2019) 0 No dilution required

 Molybdate mg/L 119.110 41 (HACH, 2017) 0 3

 Colour Legend:

 ANZECC & ARMCANZ (2000) Physical and Chemical Stressors for Inshore Marine Water – south-west Australia.

 ANZECC & ARMCANZ (2000) Low reliability trigger value for marine waters.

 Conservative mixing zone target of
The near field modelling results indicated that the buoyant plume is predicted to reach the sea
surface at a horizontal distance of 6-9 m west of the outlet. This distance defines the edge of
the near-field zone. Average plume dilutions (average dilution across the plume width) at the
edge of the near-field were predicted to reach 350-fold for the referred Proposal moderate flow
rate (5 L sec-1), 146-fold for the referred Proposal peak flow rate (15 L sec-1) and 58-fold for the
infrastructure capacity peak flow rate (72 L sec-1), while plume centreline dilutions (lowest
dilution in plume centre where a lower degree of ambient mixing occurs) were 104-fold, 50-fold
and 28-fold, respectively. The referred Proposal flow rates assessed are predicted to achieve
the target dilution of 46-fold in close proximity to the outlet (within the near-field zone and within
a distance of 5 m). Average plume dilutions for the infrastructure capacity peak flow case (72 L
sec-1) achieved the dilution target, however the central portion of the plume was predicted to
require additional far-field dilution in order to achieve the water quality standards.
To inform the far-field dilution, far-field modelling with MIKE3 FM was also undertaken, which
indicated that the 46-fold dilution target (i.e. achievement of the WQOs) for the infrastructure
capacity flow of 72 L sec-1 will be achieved within a maximum distance of ~40 m from the outlet
for both summer conditions and winter conditions (Figure 3-1).

 GHD | Report for Harvey Water - Brine Pipeline and Outfall, 12543714 | 9
Figure 3-1 Maximum predicted extent to achieve a dilution of 46-fold or
 greater for the summer simulation (left) and winter simulation
 (right) (GHD, 2020a)

The far-field modelling predictions which indicate the WQOs will be achieved at a maximum
distance of 40 m from the outlet for the infrastructure capacity peak flow (72 Ls-1). A 100 m
radius around the outlet is recommended to be established as the regulatory mixing zone
(ecological protection zone) for compliance monitoring purposes. The 100 m radius allows
additional distance beyond that predicted by the modelling to account for any uncertainties
inherent with a modelled approach and to demonstrate adequate sampling of the surrounding
area. It also allows for consistent sampling in the event that the peak flow rate is increased in
the future.

The salinity dispersion modelling has shown that near ambient levels of salinity, temperature,
pH and treatment chemicals concentration are likely to be achieved close to the outfall as
defined by the predicted boundary of the mixing zone. The model output and the above
regulatory mixing zone has been used to inform the design of the monitoring programme.

 GHD | Report for Harvey Water - Brine Pipeline and Outfall, 12543714 | 10
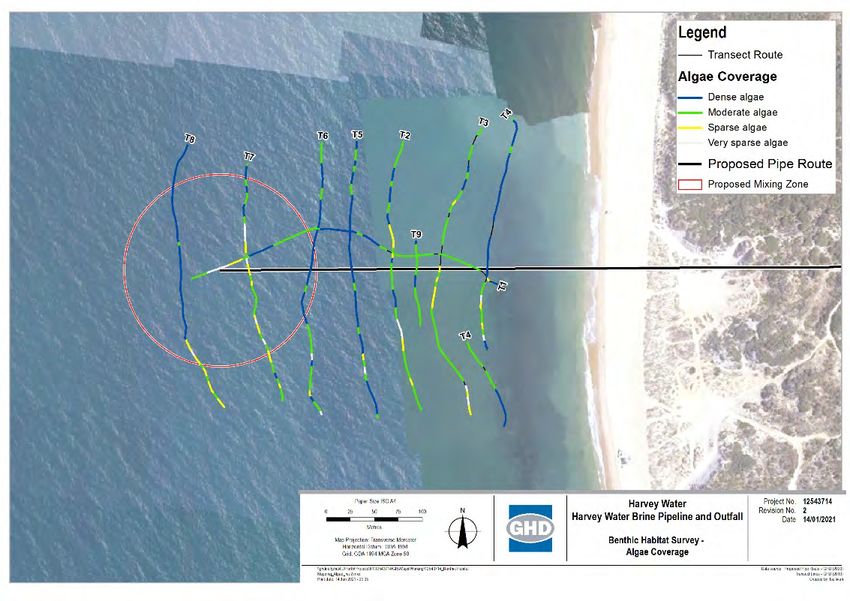
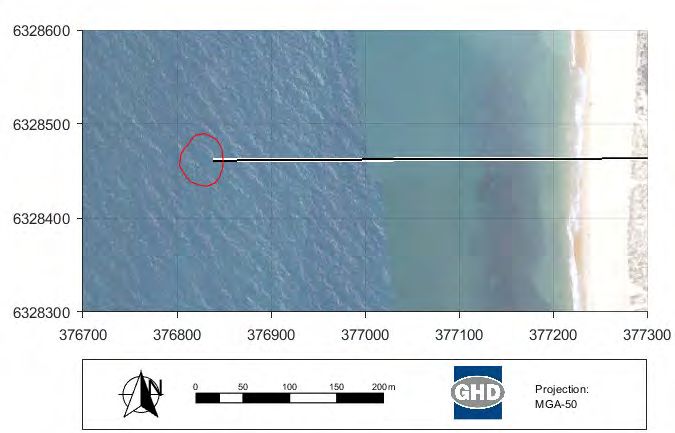
4. Environmental Effects
 The purpose of this section is to give a high-level summary of the potential for environmental
 impacts in the vicinity of the proposed KSIA outfall, used to inform the design of the monitoring
 programme. This is focused on two areas: benthic habitats and water quality.

 4.1 Benthic Habitats

 4.1.1 Introduction

 A benthic habitat survey took place on 15th November 2019 by GHD (GHD, 2021b). A towed
 underwater video system was used to conduct a visual assessment of seabed conditions to
 assess habitat type or dominant species in the vicinity of the proposed pipeline construction and
 outfall location. The purpose of the benthic habitat survey was to identify any potential sensitive
 habitats or species that could be impacted by the proposal. Figure 4-1 shows the target video
 transect survey lines.
 Further information on the benthic habitat survey conducted by GHD is provided in the benthic
 habitat survey report (GHD, 2021b).

 Figure 4-1 KSIA outfall benthic habitat underwater video survey location and
 target transect lines (GHD, 2020b)

 4.1.2 Survey Results

 The following sections presents the survey findings as collected and documented by GHD .

 GHD | Report for Harvey Water - Brine Pipeline and Outfall, 12543714 | 11
4.1.2.1 Benthic Substrate
Based on towed imagery analysis, two substrate types were clearly distinguishable;
unconsolidated (sand) and consolidated (reef/hard rock/boulders). Consolidated substrate was
predominantly colonised, forming reefs. Reef types identified included low relief (
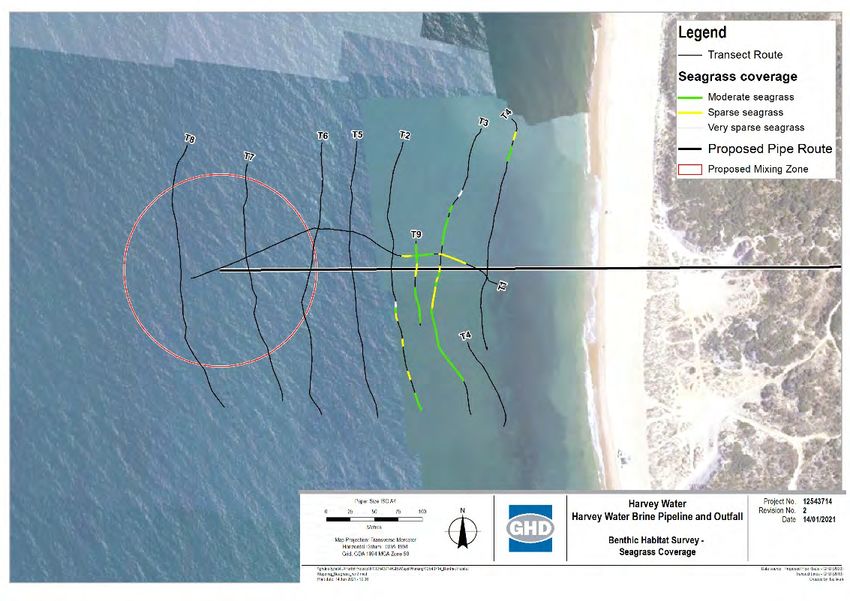
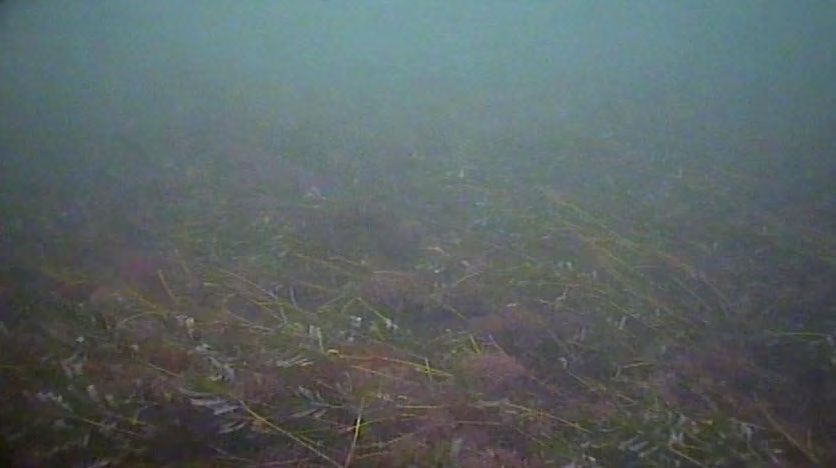
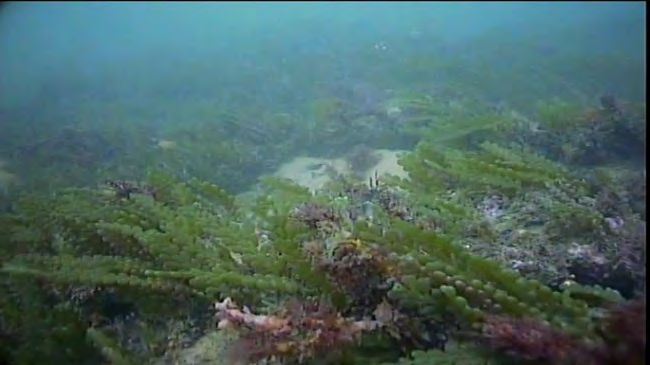
Figure 4-3 Seagrass patch (Amphibolis spp.) in nearshore waters (GHD,
 2020b)

Figure 4-4 Seagrass distribution along the underwater video survey transect
 lines (actual) (GHD, 2020b)

Few species of macroalgae could be identified to species level (Table 4-1), however there
appeared to be high diversity and abundance throughout all transects ranging from filamentous
to large canopy forming, with moderate to dense coverage across the survey area (Figure 4-5).
Large macroalgae (e.g. Ecklonia spp.) dominated the near-shore waters and macroalgae
reduced in size with distance offshore (GHD, 2021b).

 GHD | Report for Harvey Water - Brine Pipeline and Outfall, 12543714 | 13
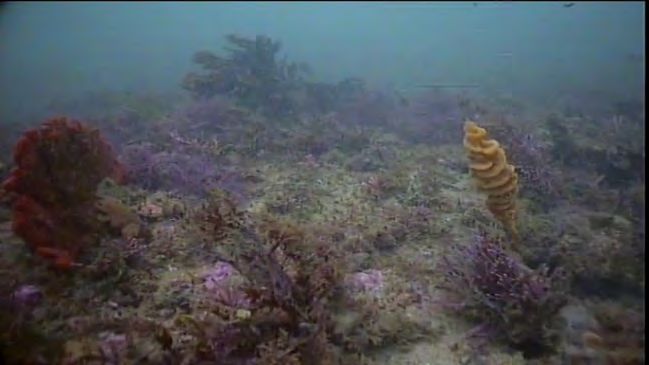
Figure 4-5 Macroalgae distribution along the underwater video survey
 transect lines (actual) (GHD, 2020b)

Epifauna were observed on most consolidated substrate; however, given the density of
macroalgae, coverage was rarely estimated to be >30%. Sponges were the dominant benthic
macro-organism and appeared relatively diverse, ranging in colour from encrusting to erect
forms. The sea tulip (Pyura spp.), a sessile ascidian, was also observed regularly. There were
only a small number of other invertebrates that could be discerned due to poor visibility (GHD,
2021b).
There was one observation of a western rock lobster (Panulirus Cygnus) and there were several
fishing pots just south of transect T4. The Western Rock Lobster is listed as a Key Ecological
Feature identified in the South-west Marine Bioregional Plan, with one of the pressures
assessed as of potential concern being physical habitat modification (Clifton et al., 2007, in:
DAWE, 2020).
Four fish (two species) were observed during the survey; three observations of female Shaw’s
cowfish (Aracana aurita), and one observation of Globe fish (Diodon nicthemerus). Both
species are endemic to Australia and are not listed as threatened or vulnerable (noting that
Globe fish has not been evaluated by the IUCN (IUCN, 2020).

4.1.3 Summary

The most notable biota observed during the survey was seagrasses, which were observed in
the inshore areas but not out to the approximate location of the outfall.. Reefs were the
dominant habitat type, containing relatively diverse assemblages of macroalgae and
invertebrates, namely sponges. Reef structure and assemblages changed with distance from
shore, where sandy patches became more frequent (GHD, 2021b).
The seagrass identified during the underwater video transects were not at a density and
coverage considered to constitute a seagrass meadow. However, further underwater video

 GHD | Report for Harvey Water - Brine Pipeline and Outfall, 12543714 | 14
monitoring of benthic communities and habitats is proposed as part of the monitoring
programme (refer to section 5.6).

4.2 Water Quality
This section provides a high-level summary of the potential impacts of wastewater discharges
on marine water quality in order to inform the monitoring programme design.
Wastewater discharge can potentially give rise to environmental impacts due to localised
changes in water quality, characterised by changes in salinity, temperature and the use of
chemicals in the RO process (such as coagulants and coagulant aids, anti-foam agents,
cleaners and biocides). These chemicals are used primarily to avoid fouling of the RO screens.
At a high level, the main potential impacts specifically from wastewater discharge into marine
water include potential impacts on plankton, fish, and benthic habitats such as coral reefs and
seagrasses.
Due to the relatively small spatial extent of the predicted change in salinity to the marine waters
expected from the proposed wastewater discharge (Δ 0.5 PSU and primarily in the surface
waters) the environmental impacts from this discharge are expected to be negligible.
In addition, the near-field dispersion modelling indicates that the wastewater discharge will rise
because of its lower salinity (and hence density) rather than sink (with little to no seabed
impact); consequently the wastewater discharge during operation is expected to cause a
negligible impact to the surrounding reef habitat or to other benthic habitats (e.g. seagrass) and
their associated fauna (GHD, 2020a).
In summary, negligible impacts on water quality are anticipated as a result of the proposed KSIA
wastewater discharge. However, this DMMP commits to monitoring of water quality in the
vicinity of the KSIA outfall to establish a monitoring regime for future uses

 GHD | Report for Harvey Water - Brine Pipeline and Outfall, 12543714 | 15
5. Monitoring Programme
 5.1 Mixing Zone
 It is common practice to define a mixing zone, which is a defined area around a marine outfall,
 where reduced water quality due to the discharge can be reasonably expected to occur
 (ANZECC & ARMCANZ, 2000).
 Discharged water from the KSIA outfall may temporarily alter water salinity and quality from
 background levels, and may potentially temporarily alter other parameters, such as temperature,
 hydrogen ion concentration (pH) and dissolved oxygen content, in the immediate vicinity of the
 outfall.
 regulatory mixing zone (ecological protection zone) for compliance monitoring purposes
 The regulatory mixing zone (ecological protection zone) for compliance monitoring purposes for
 the KSIA outfall has been set within this DMMP at 100 m (north-south) x 100 m (east-west),
 centred on the discharge location. Within this area, the WQOs defined in Table 3-1 are
 predicted to be achieved, based on a target dilution factor of 46 (GHD, 2020a) (refer to section
 3.3).
 The monitoring programme adequately samples the area of higher potential impact as defined
 by the mixing zone boundary predicted in the far-field modelling (Figure 3-1).

 5.2 Baseline Water Quality Monitoring
 No baseline water quality monitoring has been undertaken to date within the proposed outfall
 area. Harvey Water is currently investigating whether baseline reference data may be available
 from outfalls in the wider area from other operators.
 Reference water monitoring and sampling is recommended, which will be undertaken during the
 monitoring programme (refer to section 5.5).

 5.3 Monitoring Transects and Target Locations
 The ocean outfall monitoring programme area will be a circle, with diameter 100 m, centred on
 the discharge location.
 The proposed monitoring programme is based on a combination of field measurements (of
 salinity, pH and water temperature) and laboratory analysis of surface water samples.

 5.4 Field Monitoring Frequency
 It is proposed that the field monitoring be conducted on a biannual basis (i.e. one fieldwork
 monitoring excursion event every six months). Harvey water commits to this monitoring for an
 initial period of two years. Following this initial period, the monitoring requirement/ frequency
 will be re-evaluated based on the field results. If quality targets are consistently met, the
 monitoring programme will cease. The need for re-establishing field monitoring will be
 evaluated based on operational condition changes (i.e. future increased discharge flow rate).
 The monitoring events will be targeted (where practicable) for anticipated worst-case mixing
 conditions i.e. a slack tide, with low wind and low swell conditions. Tidal predictions will be used
 to inform slack tide timings, whilst meteorological/ metocean forecasts will be used to inform
 anticipated wind and swell conditions.

 GHD | Report for Harvey Water - Brine Pipeline and Outfall, 12543714 | 16
5.4.1 Field Measurements

The field monitoring programme will involve the measurement of vertical profiles of salinity, pH
and water temperature with a multi-parameter sonde (e.g. Hanna HI98194 or equivalent (Hanna
Instruments, 2020)).
The field measurements will be conducted along two proposed transects, each measuring 300
m in length, centred on the outfall location (Table 5-1 and Figure 5-1). Vertical profiles of
salinity, pH and temperature measurements will be made along each transect at 25 metre
intervals; a total of 13 sampling points along each transect.

 GHD | Report for Harvey Water - Brine Pipeline and Outfall, 12543714 | 17
Table 5-1 Proposed KSIA outfall monitoring transect location details

 Vertical Profiles QA/QC
 Sample Target location Primary Split or
 Remarks
 point ID (GDA94 MGA Zone 50) 1 2 3 Sample Replicate
 Sample
Transect 1 (300 m north-south, centred on discharge location)
 T1.01 150 m north of outfall 115.679017 -33.174316 Salinity (PSU) pH Temp. (°C)
 T1.02 125 m north of outfall 115.679013 -33.174541 Salinity (PSU) pH Temp. (°C)
 T1.03 100 m north of outfall 115.679011 -33.174767 Salinity (PSU) pH Temp. (°C) Yes Possible
 T1.04 75 m north of outfall 115.679007 -33.174992 Salinity (PSU) pH Temp. (°C)
 T1.05 50 m north of outfall 115.679004 -33.175218 Salinity (PSU) pH Temp. (°C)
 T1.06 25 m north of outfall 115.678997 -33.175443 Salinity (PSU) pH Temp. (°C)
 Outfall location Yes Possible
 T1.07 115.678997 -33.175668 Salinity (PSU) pH Temp. (°C)
 (transect centre)
 T1.08 25 m south of outfall 115.678994 -33.175893 Salinity (PSU) pH Temp. (°C)
 T1.09 50 m south of outfall 115.678991 -33.176118 Salinity (PSU) pH Temp. (°C)
 T1.10 75 m south of outfall 115.678988 -33.176343 Salinity (PSU) pH Temp. (°C)
 T1.11 100 m south of outfall 115.678982 -33.176569 Salinity (PSU) pH Temp. (°C) Yes Possible
 T1.12 125 m south of outfall 115.678981 -33.176794 Salinity (PSU) pH Temp. (°C)
 T1.13 150 m south of outfall 115.678978 -33.17702 Salinity (PSU) pH Temp. (°C)
Transect 2 (300 m east-west, centred on discharge location)
 T2.01 150 m west of outfall 115.67739 -33.17565 Salinity (PSU) pH Temp. (°C)
 T2.02 125 m west of outfall 115.677658 -33.175654 Salinity (PSU) pH Temp. (°C)
 T2.03 100 m west of outfall 115.677926 -33.175656 Salinity (PSU) pH Temp. (°C) Yes Possible
 T2.04 75 m west of outfall 115.678193 -33.175659 Salinity (PSU) pH Temp. (°C)
 T2.05 50 m west of outfall 115.678462 -33.175663 Salinity (PSU) pH Temp. (°C)
 T2.06 25 m west of outfall 115.678729 -33.175665 Salinity (PSU) pH Temp. (°C)
 Outfall location
 T2.07 115.678997 -33.175668 Salinity (PSU) pH Temp. (°C)
 (transect centre)
 T2.08 25 m east of outfall 115.679265 -33.175671 Salinity (PSU) pH Temp. (°C)
 T2.09 50 m east of outfall 115.679532 -33.175672 Salinity (PSU) pH Temp. (°C)
 T2.10 75 m east of outfall 115.6798 -33.175675 Salinity (PSU) pH Temp. (°C)
 T2.11 100 m east of outfall 115.680069 -33.175679 Salinity (PSU) pH Temp. (°C) Yes Possible
 T2.12 125 m east of outfall 115.680337 -33.175681 Salinity (PSU) pH Temp. (°C)
 T2.13 150 m east of outfall 115.680605 -33.175683 Salinity (PSU) pH Temp. (°C)
Reference Location
 R1 250 m west of outfall 115.676318 -33.175636 Salinity (PSU) pH Temp. (°C) Yes Possible
Wastewater Stream Location
 Wastewater Access
 W1 TBD TBD Salinity (PSU) pH Temp. (°C) Yes Possible
 Point

 The transect lengths are greater than the predicted 100 metre mixing zone to assess that the
 target dilution factor is being achieved within the boundaries of the 100 m mixing zone.
 Target locations have been specified in Table 5-1 to aid in navigation to the proposed sampling
 points. The location of each sample point will be recorded with a GPS device, used in tandem
 to record the vertical profiles with the multi-parameter sonde at each location.

 GHD | Report for Harvey Water - Brine Pipeline and Outfall, 12543714 | 18
Figure 5-1 Proposed transect locations

 GHD | Report for Harvey Water - Brine Pipeline and Outfall, 12543714 | 19
5.4.2 Water Sampling and Testing

A primary sample will be collected of the surface (~0.25 m depth) waters at the outfall location,
each 100-metre point on each transect and the reference site, and from the KSIA wastewater
stream (at a suitable location prior to release to the sea) a primary sample will be collected
(Table 5-1). Sampling will be in accordance with the Department of Water Field Sampling
Guidelines (Government of Western Australia, 2009).
Water samples will be sent to a NATA certified laboratory for analysis of the analytes shown in
Table 3-1. The suitable laboratory analytical methods used for these analyses will be confirmed
in consultation with the selected laboratory but are likely to include those listed in Table 5-2.
Results will be compared against the WQO criteria specified in Table 3-1. For analytes where
no criteria are available, a ‘baseline 80th percentile’ approach can be adopted. At the current
time, no baseline water quality information is available, therefore these criteria can be
developed from the reference samples once a suitable number of sample replicates have been
obtained.
Table 5-2 Water sample analytes and proposed laboratory methods (note: will
 be refined in consultation with the selected laboratory)

 Analyte Lab. method code

 Total Dissolved Solids (TDS) EA016: Solids – Total dissolved (TDS)

 Total Suspended Solids (TSS) TM022: Total Suspended Solids (TSS)

 pH EA005/EA070: pH – Saturation value

 Temperature NA - Field measurement

 Hardness as CaCO3 EA065: Hardness (Total)

 Calcium USEPA 3005: Analysis for elements; saline waters

 Magnesium USEPA 3005: Analysis for elements; saline waters

 Sodium ED093F: Dissolved Major Cations

 Potassium ED093F: Dissolved Major Cations

 Barium USEPA 3005: Analysis for elements; saline waters

 Alkalinity ED037P: Alkalinity (Total as CaCO3)

 Sulphate ED040N: Sulfate - Calcium phosphate extractable

 Chloride ED045G: Chloride by discrete analyser

 Flouride EK040: Fluoride; Saline waters

 Nitrate EK058G: Nitrate as N by Discrete Analyser

 Phosphate EK067G: Phosphorus - Total

 Silica USEPA 3005: Analysis for elements; saline waters

 Boron USEPA 3005: Analysis for elements; saline waters

 GHD | Report for Harvey Water - Brine Pipeline and Outfall, 12543714 | 20
Analyte Lab. method code Salinity EA020: Salinity Water treatment chemicals Sodium Molybdate Recommended water treatment chemicals analysis methods to be confirmed in consultation with the selected laboratory. THPS (Biocide) Phosphonates (PBTC) Phosphonates (HEDP) Polyacrylate Azole Molybdate 5.5 Reference Sampling As no baseline water sampling information is available for the area, reference water sampling is proposed. A reference sampling site is proposed, 250 m west of the proposed outfall location (refer to Table 5-1). This location is at a distance outside of the mixing zone and away from the influence of nearshore water effects (e.g. wave shoaling). At the reference location, vertical profiles with the multi-parameter sonde (as per section 5.4.1) and surface water sampling (as per section 5.4.2) will take place. 5.6 Underwater Video Monitoring Underwater video will be collected to monitor the benthic habitat conditions in the vicinity of the KSIA outfall location. It is proposed that this monitoring take place on an annual basis, with the first underwater video monitoring to take place immediately after the installation of the KSIA pipeline and at yearly intervals thereafter. The purpose of the underwater video monitoring will be to assess the benthic conditions in the vicinity of the KSIA outfall to assess: Areas of benthic habitat that have been disturbed due to the installation of the outfall relative to the baseline survey (November 2019); Recovery of benthic habitats and associated species in areas that are potentially disturbed during the installation; and Condition of the benthic habitats to ascertain any deterioration of the existing habitats and species. The monitoring will utilise a drop-down camera system (or similar). The underwater video monitoring will aim to sub-sample the habitats identified during the November 2019 baseline survey (Table 4-1), with a particular focus on the areas of seagrass identified in close proximity to the outfall (Figure 4-4). The design of the target locations for the underwater video monitoring will take into account the locations of the transects in the baseline survey, and the location of the as-built outfall pipeline once this has been constructed. GHD | Report for Harvey Water - Brine Pipeline and Outfall, 12543714 | 21
5.7 Data Collection and Recording

5.7.1 Field Measurements

During field measurement data collection vertical profiles will be collected with the multi-
parameter sonde at each location. The probe will be lowered over ~0.5 m intervals and held to
allow the readings to stabilise, after which measurements will be logged/recorded. The field
measurements will be recorded within the device memory, with the operative periodically
checking that measurements have been recorded successfully.
At the end of the field monitoring activities, the field measurement data will be downloaded from
the device onto a laptop. The data logs will be downloaded and saved securely on the laptop,
and server.

5.7.2 Water Samples

Surface water samples will be collected from nine sample points (Table 5-3) in the manner
described in Section 5.4.2 and dispensed into laboratory provided bottles.
At two different locations one field split (one Niskin bottle sample spilt into two samples) and one
field replicate (two samples from two Niskin bottle collections) will be collected for QA/QC
purposes. The field split involves splitting one sample into two subsamples and submitted as
separate samples. The field split samples reveal the magnitude of errors (such as
contamination, random and systematic errors) occurring between sampling and sample
analysis. The field replicate is obtained when two or more samples are taken from the same
site at the same time, using exactly the same method. The replicate samples are representative
of the same environmental condition. Replicate samples are used to detect both natural
variations in the environment and variations caused by the field sampling methods (Government
of Western Australia, 2009).
Samples will be carefully packaged in the field in a chilled thermal box (e.g. Esky or similar) to
minimise transient temperature effects during transit.
Chain of custody (COC) documentation shall be completed for all samples as per the
Department of Water Field Sampling Guidelines (Government of Western Australia, 2009).
Water samples shall be given the identifiers in Table 5-3.
Table 5-3 Water sample identifiers

 Sample Identifier

 Water sample directly from the KSIA wastewater waste stream. Accessed at pigging KSIA_OF01
 outlet location 1.2 km up pipe from outfall )

 Surface water sample 100 m north of outfall at sample point T1.03 KSIA_T1.03

 Surface water sample at outfall location at sample point T1.07 / 2.07 KSIA_T1.07

 Surface water sample 100 m south of outfall at sample point T1.11 KSIA_T1.11

 Surface water sample 100 m west of outfall at sample point T2.03 KSIA_T2.03

 Surface water sample 100 m east of outfall at sample point T2.11 KSIA_T2.11

 Reference surface water sample 250 m west of outfall at sample point R1 KSIA_R1

 Blind Field Split (location to be selected on the day) KSIA_FS

 GHD | Report for Harvey Water - Brine Pipeline and Outfall, 12543714 | 22
Sample Identifier

 Blind Replicate (location to be selected on the day) KSIA_BR

5.8 Record Keeping, Data Sharing and QA/QC
Following the field measurements, the raw data will be transferred into a standardised
spreadsheet to enable analysis and reporting as per section 7.
Data and records will be kept from the monitoring programme in accordance with the Harvey
Water data management procedure, with no plans for the periodic deletion of destruction of
data. All data and records shall be kept on secure systems that are subject to regular back-up
to minimise the risk of data loss.
Data shall only be shared externally once all analyses are completed in full to satisfactory
QA/QC and once periodic reporting has been finalised (as per section 7). QA/QC of water
samples will be based on acceptable relative percentage differences (RPDs) of the field split
(nominally RPD
6. Safety, Roles and Responsibilities 6.1 Quarterly Field Monitoring In order to conduct the quarterly field monitoring works, the use of a small vessel is required (e.g. rigid inflatable boat (RIB)). It is proposed that the monitoring vessel shall have a minimum of two crew as follows, with the roles and responsibilities of each defined in sections 6.1.1 to 6.1.3 below: 1 x vessel master/skipper; 1 x fieldwork operative. The addition of a third crew member (fieldwork assistant) may be needed for the annual underwater video survey. All persons involved in the field monitoring works shall have the appropriate training and qualifications to perform their duties as defined in sections 6.1.1 to 6.1.3 below. All crew members shall have suitable PPE, including as a minimum: Appropriate clothing and footwear; High-visibility vest or jacket; Lifejacket fitted with EPIRB; Hat, to mitigate against sun exposure; Sunglasses, to mitigate against sun glare induced eye fatigue; Sunblock, to mitigate against sunburn; Waterproof jacket in cold conditions. The vessel will have at least 1 x marine band radio on board. All persons on board are responsible for ensuring that adequate water and food are taken along for each fieldwork excursion. Equipment and bags carried on board the vessel must be safely stowed and secured prior to transit and during the fieldwork. Prior to the fieldwork excursions, an approved Job Hazard Analysis (JHA) will be in place, and all persons involved in the fieldwork shall familiarise themselves with the JHA and follow any practices/mitigations defined in the JHA to safety perform and complete the fieldwork programme. 6.1.1 Vessel master The vessel master shall have the following roles and responsibilities: Ensuring appropriate consumables are on board prior to departure (fuel, oil, water, etc.); Performing pre-mobilisation vessel safety checks; Familiarisation with the area and its navigation requirements, including consulting the relevant marine chart(s); Skippering of the vessel; Safety of the vessel and its crew; Communication with other vessels and sea users as necessary; GHD | Report for Harvey Water - Brine Pipeline and Outfall, 12543714 | 24
Safe navigation and watchkeeping; Safe navigation to the target sample points and holding of position at sample points to enable sampling; Safe navigation to/from the vessel home Port; Safe launch and recovery (if necessary); Assisting with the field collection. The vessel master will at minimum have a coxswain ticket and have the competence and experience necessary to carry out the tasks required for the fieldwork programme. It should be noted that the monitoring programme is based on sampling of surface waters, therefore the vessel master is to avoid creating an unnecessary wash with the vessels propellers when moving in the vicinity of the mixing zone, as this will disturb the mixing zone waters and monitoring results. 6.1.2 Fieldwork operative The fieldwork operative shall have the following roles and responsibilities: Overall responsibility for the collection of data according to the fieldwork programme specified within this DMMP; Assist the vessel master in navigating to the sample points; Safe taking and recording of field measurements; Safe taking and storage of water samples; Completion of COC documents for water samples; Overall responsibility for the fieldwork assistant, including delegation and management of tasks; Overall responsibility for the recording and reporting of field monitoring results in accordance with this DMMP. Contributing towards a safe navigation lookout at all times, including reporting of observed and perceived risks to the vessel master. The fieldwork operative shall have the necessary experience and competence to perform the above tasks to the specification of the fieldwork monitoring programme. As a minimum, the fieldwork operative shall be a qualified environmental scientist with marine sampling experience. 6.1.3 Fieldwork assistant If a fieldwork assistant is needed, then they shall have the following roles and responsibilities: Carrying out of tasks delegated by the fieldwork operative. Contributing towards a safe navigation lookout at all times, including reporting of observed and perceived risks to the vessel master. 6.2 Yearly Underwater Video Monitoring The yearly drop-down underwater camera survey will require a vessel with a stable platform and adequate deck space for the camera deployment and recovery equipment. This may be larger GHD | Report for Harvey Water - Brine Pipeline and Outfall, 12543714 | 25
than the small vessel used for the field measurements, which may therefore need to be
contracted for the yearly drop-down camera work. The underwater video survey will be
accompanied by a suitable marine benthic environmental scientist that is familiar with the
project to supervise/ QA/QC the underwater drop-down camera monitoring work.

 GHD | Report for Harvey Water - Brine Pipeline and Outfall, 12543714 | 26
7. Reporting Following each monitoring event, reporting will take place. The ultimate aim of the reporting is to ensure that the WQO’s have been met within the limits of the ecological monitoring zone and to report on the condition of the benthic habitats in the vicinity of the KSIA outfall. Regular reporting form part of Harvey Water’s internal Environmental Management Plan requirements. 7.1 Biannual Field Monitoring and Water Sample Analysis Following each field monitoring event and on receipt of laboratory results, a report will be developed. The report will be organised as follows: Introduction: An outline of the field monitoring that has taken place, including dates, times, measurements and water samples taken, and a description of the fieldwork excursion, including any problems that were encountered. The section will also include sample target location performance and general field excursion HSE performance. Assessment Criteria: A description of the WQOs used for assessment of the results from field measurements and laboratory analyses and how the results are compared to these to demonstrate achievement of the WQO’s. Field Measurements Assessment: This section will present the results of the field measurements. The section will include: o General presentation of results including trends identification; o Comparison of results to WQOs and reference field measurements; o Field instrument QA/QC and calibration. Water Sampling Assessment: This section will present the results of the water sampling and laboratory analyses. The section will include: o General presentation of laboratory results including trends identification; o Analysis of water treatment chemical usage during the time of sampling (provided by Harvey Water); o Comparison of results to WQOs and reference water samples; o Laboratory QA/QC performance (field replicates and splits, RPDs, lab QA/QC). Recommendations: Recommendations for future field monitoring and trends identification/analysis. Conclusion: Overall conclusions, including a statement on whether the WQOs have been met in accordance with this DMMP. 7.2 Annual Benthic Underwater Video Monitoring Following each annual benthic underwater video survey, a report will be developed. The report will be organised as follows: Introduction: An outline of the underwater video monitoring that has taken place, including dates, times, target and actual locations, and a general description of the fieldwork excursion, including any problems that were encountered. The section will also include sample target location performance and general field excursion HSE performance. GHD | Report for Harvey Water - Brine Pipeline and Outfall, 12543714 | 27
Analysis: Analysis of the underwater video, including identification of benthic habitat type, coverage and identification of epifaunal species encountered. Comparison to baseline: Commentary on the condition of the benthic habitat encountered in comparison to the November 2019 baseline survey, including specific commentary on recovery of any disturbed areas from installation and on the condition of seagrass. Conclusion and Recommendations: Overall conclusion of the underwater video survey, including any recommendations for future monitoring. 7.3 Management Response In the event that the WQOs have not been met within the regulatory mixing zone, a management response will be triggered. Depending on the nature and severity of the exceedance, management response actions may include: Confirmation of the exceedance: o Confirming field measurement equipment calibration and function; o Re-sampling of surface waters and/or the KSIA wastewater discharge; o Investigation of exceedance causes: o Assessment of changes to KSIA outfall operating conditions; o Confirmation of correct operation and maintenance of plant; o Assessment of changes to water treatment chemical use; Corrective actions: o Amendment to chemicals and/or dosing concentrations; o Changes to operational protocols/procedures; o Changes to operations and maintenance activities; o Training and competence assessment of key operational staff. GHD | Report for Harvey Water - Brine Pipeline and Outfall, 12543714 | 28
You can also read