Stormwater Quality of Discharges into Lake Wānaka
←
→
Page content transcription
If your browser does not render page correctly, please read the page content below
Stormwater Quality of Discharges into Lake Wānaka

Technical Report Prepared for Wai Wānaka
Mar 2021

Prepared by:
Victoria Grant, University of Otago

School of Geography, University of Otago
PO Box 56
Dunedin 9054

Version 1.1
Final report prepared by Victoria Grant, reviewed by Sarah Mager (Mar-2021)

                                                1
Table of Contents

Stormwater Quality of Discharges into Lake Wānaka ............................................................................1
1    Executive Summary ..........................................................................................................................5
2    Introduction .......................................................................................................................................6
3    Main Findings....................................................................................................................................8
    3.1    Urban Sprawl in Wānaka since 1956 .........................................................................................8
    3.2    Data Collection and Sampling Sites .........................................................................................11
    3.3    Base Flow Conditions of Perennially-Flowing Watercourses .................................................16
      3.3.1       Natural Watercourses ........................................................................................................16
      3.3.2       Perennially-Flowing Drains ..............................................................................................20
    3.4    Stormwater Outfalls during Rain Events..................................................................................22
    3.5    Evidence for a First Flush Response in Stormwater ................................................................26
      3.5.1       E. coli behaviour in Bremner Drain and Old Wharf Drain ...............................................35
    3.6    Influence of Imperviousness on Stormwater Quality ...............................................................36
    3.7    Influence of Storm Duration and Intensity on Stormwater Quality .........................................37
4    Recommendations and Conclusions ................................................................................................39
5    References .......................................................................................................................................40
6    Appendices ......................................................................................................................................41
      6.1.1       Technical Notes on Methods and Sample Acquisition .....................................................41
      6.1.2       Supplementary Tables of Data ..........................................................................................43

                                                                           2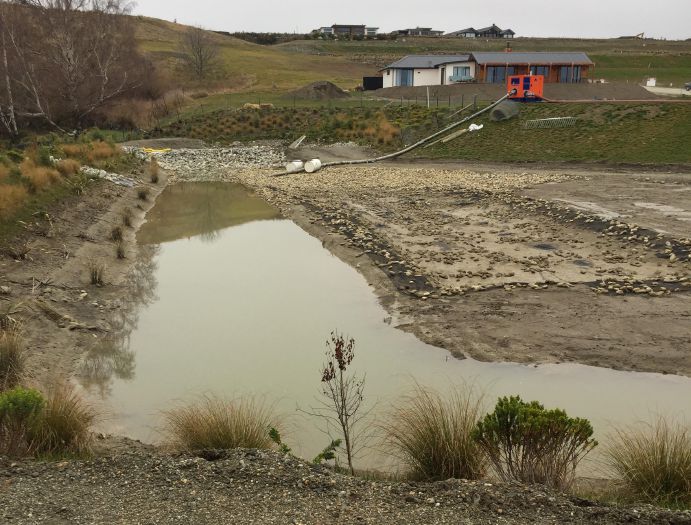
List of Tables
Table 1: Concentrations of water quality variables for natural water courses and stormwater drains
    discharging into Lake Wanaka. .......................................................................................................7
Table 2: Physical description, human use, and distinguishing factors of the natural waterways and/or
    rivers that receive stormwater inflows. ..........................................................................................13
Table 3: Physical description, human use, and distinguishing factors of the stormwater outflows that
    discharge directly into Lake Wānaka.............................................................................................14
Table 4:Stormwater sampling campaigns in Wānaka township, with details of rainfall amount,
    intensity, and holding period (in hours) that describes the time between significant rain events
    (i.e., > 1 mm hr−1) as recorded at the NIWA CWS Station in Wānaka. Datasource: NIWA Cliflo
    (2020). ............................................................................................................................................15
Table 5: Baseflow water quality of natural waterways in Wānaka above stormwater outfall effects. All
    measurements in mg L−1, except for E. coli which is in units of CFU per 100 mL. .....................18
Table 6: Average (mean) concentrations of water quality indicators from perennially-flowing drains
    that discharge into Lake Wānaka, as measured under baseflow conditions between 5–21 days
    after any significant rain. All measurements in mg L−1, except for E. coli which is in units of
    CFU per 100 mL. ...........................................................................................................................20
Table 7: Median baseflow and stormflow concentrations for 7 stormwater contaminants including:
    turbidity, suspended sediment, E. coli, total phosphorus, dissolved reactive phosphorus, total
    nitrogen, and nitrate. Baseflow concentrations were available for 7 sites whilst stormflow
    concentrations were available for all 12 sites. Values that exceed both the ANZECC Guidelines
    and Schedule 15 thresholds are highlighted in blue below. ...........................................................23
Table 8: Median stormflow concentrations for total recoverable and dissolved metals for the 12
    monitored sites and the percentage of sample which is in dissolved form. Values that exceed both
    the ANZECC Guidelines and Schedule 15 thresholds are highlighted in blue. (ND –below the
    method detection). .........................................................................................................................24
Table 9: Kendall’s Tau correlation between impervious surface coverage percentage and contaminant
    concentration for a variety of contaminants sampled in this study. P-values indicate a significant
    correlation between the two variables at the 0.1* and ** 0.05 level. ............................................36
Table 10: Sample handing and storage. .................................................................................................41
Table 11: Analytical methods and associated detection limits for analysis completed at Hills
    Laboratories and where Otago University (specified only where different). Detection limits in
    units of milligrams per litre, unless otherwise specified. ..............................................................42
Table 12: Receiving Water Group 3 numerical limits and targets for achieving good water quality in
    Plan Change 6a – Schedule 15. ......................................................................................................43
Table 13: Receiving Water Group 5 numerical limits and targets for achieving good water quality in
    Plan Change 6a – Schedule 15. ......................................................................................................43
Table 14: Catchment Area 2 contaminant discharge thresholds and targets for achieving good water
    quality in Plan Change 6a – Schedule 16. Discharges leaving open or tile drains or paddocks
    must meet these thresholds when the representative monitoring site for the area is at or below
    median flow (Applying from April 1st, 2020)................................................................................44
Table 15: Establishment of reference conditions and trigger values for chemical, physical, and
    microbiological indicators in New Zealand streams and rivers – median and 80th percentile
    values of the estimates at the 3rd level (i.e. climate by topography by geology) of the REC
    (McDowell et al., 2013; ANZG, 2018). CDH / HS classification used at Stoney Creek Sites (i.e.,
    Stoney Creek Headwaters and Stoney Creek Lower) and CDH / AL classification used at
    Bullock Creek and Water Race Sites (i.e., Bullock Creek Headwaters, Bullock Creek Middle,
    Bullock Creek Lower, Middle Water Race/Control, and Lower Water Race). Classifications were
    determined through the New Zealand River Environment Classification User Guide (Snelder et
    al., 2010). .......................................................................................................................................45
Table 16: Kendall’s Tau correlation between stormwater contaminants sampled in this study. P-values
    ≤ 0.05 indicate a significant correlation between the two variables at the 0.05 level. ..................50

                                                                            3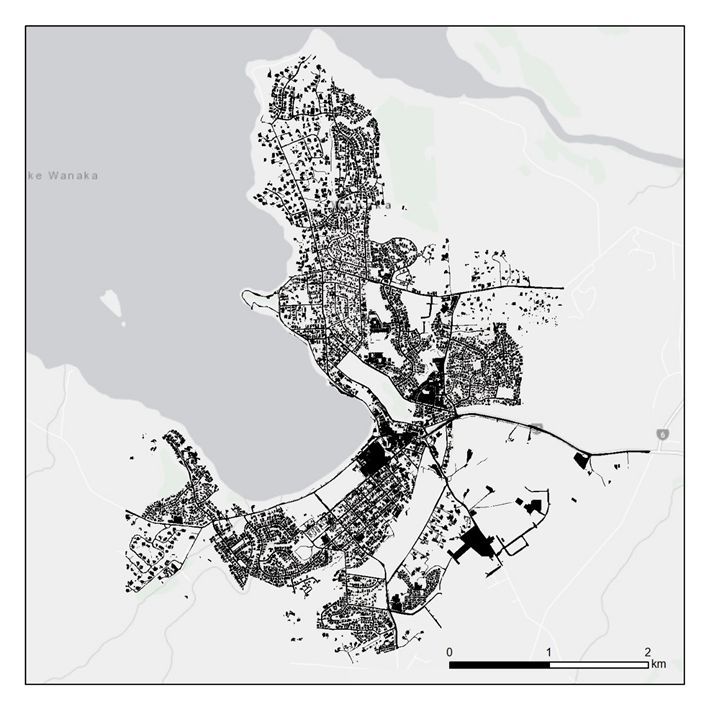
List of Figures
Figure 1: Sixty years of changing impervious surface coverage of the Wānaka township – a) 1956 b)
    1968 c) 1976 d) 1984 e) 1999 and f) 2006 ......................................................................................9
Figure 2: Impervious surface coverage of Wānaka at 03/2018. ............................................................10
Figure 3: Impervious surface coverage (ha) for Wānaka for the sixty-two-year period (1956-2018)
    derived from aerial and satellite imagery. .....................................................................................10
Figure 4: Sampling sites including a combination of Touchstones past sites (Stoney Creek
    Headwaters, Stoney Creek Urban, Lower Water Race, McDougall Street Drain, Bullock Creek
    Headwaters, Bullock Creek Lower) and UCLT new sites (Middle Water Race/Control, Bullock
    Creek Middle, Old Wharf Drain, Beacon Point Drain, Kirimoko Subdivision). ..........................11
Figure 5: Stormwater Drain Sites including 1) McDougall Street Drain 2) Bremner Drain 3) Old
    Wharf Drain 4) Kiromoko Subdivision and 5) Beacon Point Drain..............................................12
Figure 6: Natural Waterway Sites including: 6) Middle Water Race/Control 7) Lower Water
    Race/Urban 8) Bullock Creek Middle 9) Bullock Creek Head/Control 10) Bullock Creek Lower
    11) Stoney Creek Urban and 12) Stoney Creek Head/Control. .....................................................12
Figure 7: Stormwater sediment detention pond located near Bullock Creek Headwaters as a part of the
    Alpha-Series Development. This pond has been known to overflow during high rainfall events
    contaminating all Bullock Creek sites before discharging into Lake Wānaka (Photo: 6th August
    2018). .............................................................................................................................................17
Figure 8: First flush analysis of turbidity, suspended sediment, total nitrogen, and total phosphorus at
    Bremner Drain during the storm event 29/30-09-18. Recommended guidelines comply with Plan
    Change 6a by the Otago Regional Council by applying Schedule 15- Receiving Group 5. .........28
Figure 9: First flush analysis of turbidity, suspended sediment, total nitrogen, nitrate, total
    phosphorus, and dissolved reactive phosphorus at Bremner Drain during the storm event 19-02-
    19. Recommended guidelines comply with ANZECC and Plan Change 6a guidelines by the
    Otago Regional Council (Schedule 15- Receiving Group 5). .......................................................30
Figure 10: Bremner Drain first flush analysis for the storm event 18-10-19. Event was sampled in 15-
    minute intervals, 13 times, for a duration of 3.5 hours starting at 2.51pm and ending at 6.22pm.
    Sample 13 however, was collected 30 minutes after the previous sample. Analysis includes
    suspended sediment, E. coli, total phosphorus, total nitrogen, dissolved reactive phosphorus, and
    nitrate. Recommended guidelines comply with ANZECC and Plan Change 6a guidelines by the
    Otago Regional Council (Schedule 15- Receiving Group 5). .......................................................33
Figure 11: First flush analysis of E. coli at Bremner Drain and Old Wharf Drain during the storm
    event 25-10-18. Recommended guidelines comply with Plan Change 6a guidelines by the Otago
    Regional Council (Schedule 15- Receiving Group 5). ..................................................................35
Figure 12: Distribution of hourly rainfall intensity as measured in Wānaka at the CWS weather station
    for the period November 2017–December 2019. Data source: Cliflo (NIWA, 2020). .................37
Figure 13: Kendall’s Tau Correlation between Turbidity (NTU), Suspended Sediment – SSC (mg/L),
    and E. coli (CFU/100mL) and Impervious Surface Cover at the 12 study sites............................46
Figure 14: Kendall’s Tau Correlation between Total Phosphorus – TP (µg/L) and Dissolved Reactive
    Phosphorus – DRP (µg/L) and Impervious Surface Cover at the 12 study sites. ..........................47
Figure 15: Kendall’s Tau Correlation between Total Nitrogen -TN (µg/L) and Nitrate – NO3 (µg/L)
    and Impervious Surface Cover at the 12 study sites. .....................................................................48
Figure 16: Kendall’s Tau Correlation between total recoverable Aluminium – Al (µg/L), Copper – Cu
    (µg/L), and Zinc (µg/L) – Zn and Impervious Surface Cover at the 12 study sites. .....................49
Figure 17: Inter-event variation of stormwater contaminants between stormwater drains and natural
    waterways and/or rivers on the 19-09-2018; 29/30-09-2018; 19-01-2019; 19-02-2019; 24-03-
    2019; and 18-10-2019. ...................................................................................................................54

                                                                            4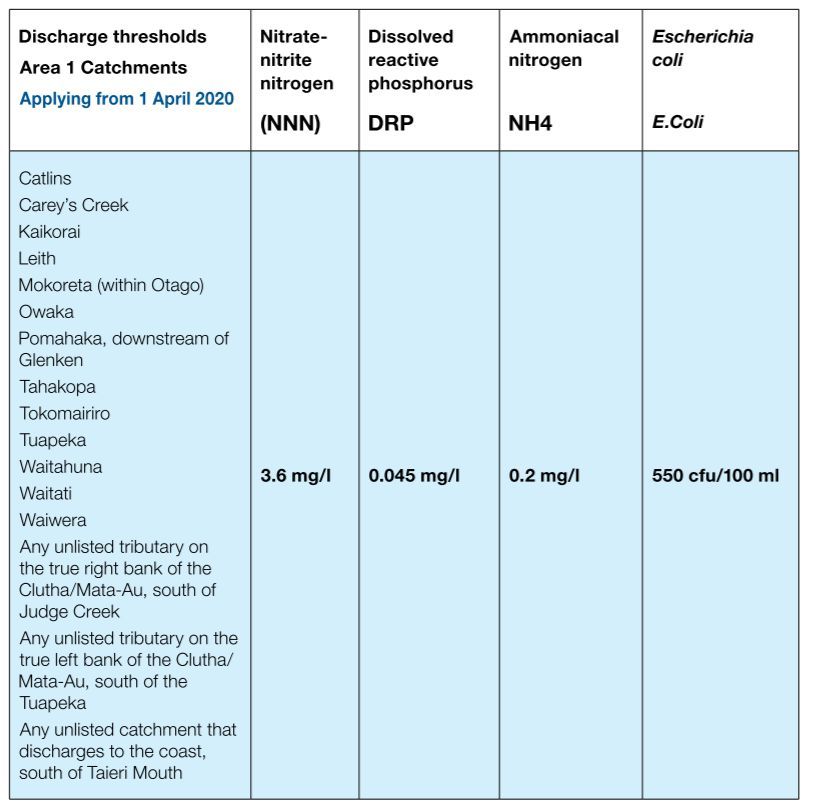
1 Executive Summary

Stormwater flows in Wānaka show that increased imperviousness of the urban/suburban environment
is resulting in increased concentrations of contaminants into Lake Wānaka. Areas of higher
imperviousness result in greater flushing of sediment, heavy metals, and total nitrogen and
phosphorus; although the concentrations of these will depend on the intensity of the storm, and
specific sub-catchment characteristics. Nitrate concentrations are high, even under baseflow, in
natural creeks in Wānaka, and may reflect elevated nitrate concentrations from discharging
groundwater from the Wānaka aquifer, although local land use may exacerbate these concentrations.
Bacterial counts are generally low through most of the stormwater outfalls, although there are local
hotspots that should be investigated to determine whether there remains any further crossed-
connections; or whether hotspots of E. coli are coincident with avian or domestic pet excreta.

Future work should investigate how drains, natural and artificial watercourses can be improved to
mitigate high nitrate and sediment concentrations during storm events. Areas of high sediment
discharge are likely associated with bank erosion and/or reduced areas of sediment storage.
Investment in bank armouring, including riparian plantings and designating setbacks from open
waterways would slow the delivery of sediment to the channelized network for small and moderate
storms. Riparian plantings will also aid in the uptake of nitrate and phosphorus in open channels, and
where feasible, development of artificial wetlands and holding ponds may also be useful retrofit tools
to attenuating nuisance nutrients. Such developments of sensitive urban design would reduce the flux
of contaminants into Lake Wānaka as well as improve aesthetic values and use of the waterways.

                                                   5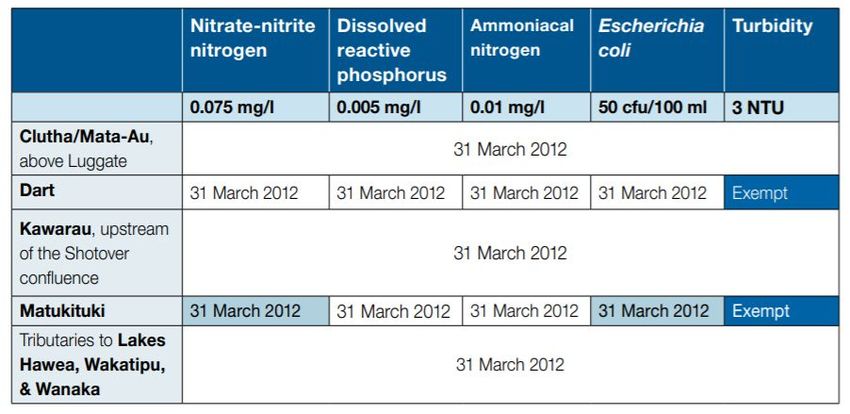
2 Introduction
Impervious surfaces such as roads, roofs, drainage systems, and general modifications to the natural
environment are major contributors to the physical degradation of waterways in urban areas. Increases
in impervious surfaces combined with the expanded use of automobiles, loss of vegetated surfaces,
and advances in infrastructural facilities to fulfil human needs, all contribute to urban sprawl and
degradation of water resources. Processes such as infiltration, evapotranspiration, and interception are
reduced due to the clearing of natural land cover and the compaction of soil, attributing to increases in
stormwater runoff and alterations to stream ecosystems. As a result, urbanisation influences
catchment hydraulics, in which increased flood flows and erosional processes, and reductions in base
flow conditions are likely occurrences. The Auckland City Council (2015) for instance, note that there
is a positive relationship between impervious surfaces and increases in stormwater runoff, where 35–
50% of total impervious land cover within a catchment will experience a three-fold increase in urban
runoff.

For many urban areas in New Zealand urbanisation is not a new phenomena, having developed over a
century of urbanisation and regeneration. But for some areas, boosted by surging tourist-based
economies, there have been dramatic changes in the town form and density and these small centres
with small local taxpayer populations are now grappling with dealing with infrastructure demands far
larger than residential base. The focus of this research is to explore the changes in urban sprawl in
Central Otago, with a case study of Wānaka, to evaluate the effects of exponential growth in
impermeable surfaces and the effect of stormwater discharge into the sensitive receiving environment
of Lake Wānaka.

There is a recognised knowledge gap regarding regional research into stormwater and information on
stormwater quality, for both science supporting the Otago Regional Councils (ORC) ‘Loving Water,
Loving Life!’, Otago’s urban water quality strategy and general State of the Environment (SoE) water
quality data and the findings of the Upper Clutha Lakes Trust (UCLT) Stormwater Workshop.
Therefore, this report examines how storms flush contaminants from the rapidly transforming land
cover via storm water networks into Lake Wānaka. The focus on this work was developed in
collaboration with Wai Wānaka (formerly, the UCLT) to identify what contaminants were being
discharged into Lake Wānaka. Specifically, this study addresses the dearth in current knowledge of
urban water quality in Wānaka by quantifying:

    1. the quality, quantity, and variability of urban runoff generated by urban areas in Wānaka and
    2. the movement and processing of urban runoff through Lake Wānaka, using analysis of
          sediments, trace metals, pathogens, nutrients, and bacterial contaminants.

                                                    6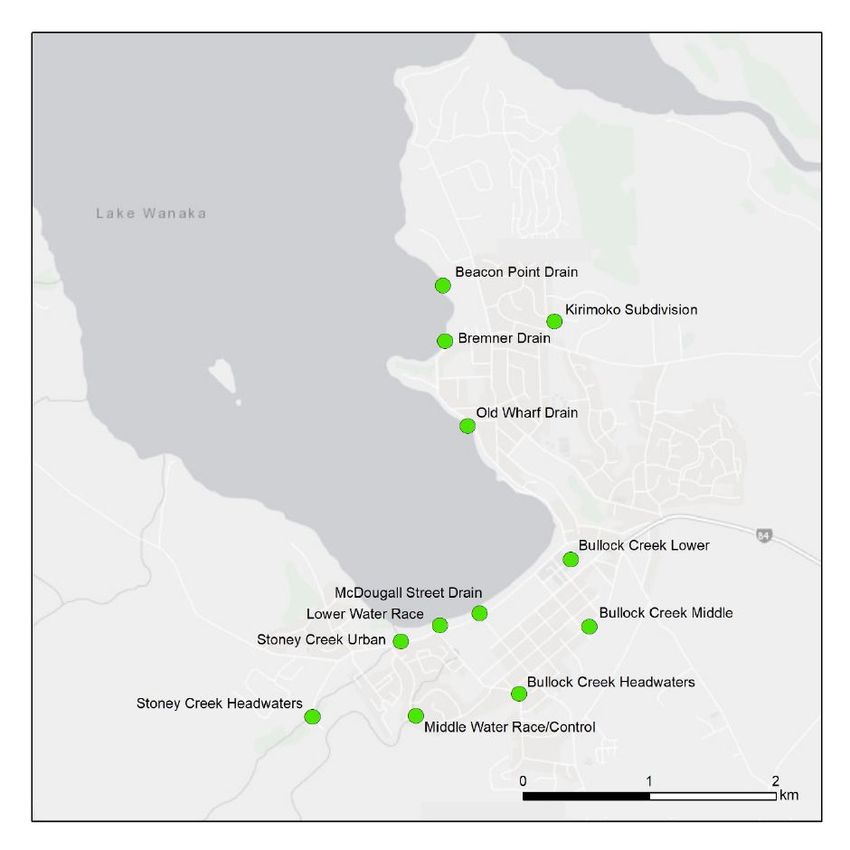
The approach of this research was to expand an existing community-based sampling framework that
was focussed on determining the first flush of storm flows during storm events in Wānaka.
Specifically, the project combines field-based sampling of discharging stormwater over a series of
events to ascertain what compounds are present in stormwater, where they occur, and how they may
be linked to different sub-catchment land development.

Table 1: Concentrations of water quality variables for natural water courses and stormwater drains
discharging into Lake Wanaka.

Variable                ANZECC                      ANZG (2018)          ORC Plan Change 6a -        ORC Plan
                          (2000)                                                  Schedule 15       Change 6a -
                                                                                                    Schedule 16
                        Previous         Stoney         Bullock       Receiving       Receiving         Area 2
                       Guidelines    Creek Sites      Creek and        Group 3         Group 5      Catchments
                                                         Water
                                                      Race Sites
Turbidity                      5.0            0.6            0.6             3.0              3.0            Not
(in NTU)                                                                                                specified

Suspended                      4.0            1.8             1.3                                   Not specified
Sediment
Concentration
(SCC) (in mg L-1)

Nitrate (NO3-N)             167.0            25.0           12.0                                    Not specified
(µg L-1)
Total Nitrogen (TN)         295.0           139.0           37.0           100.0           100.0
(µg L-1)
Dissolved Reactive             6.0                  Not specified            5.0              5.0           35.0
Phosphorus (DRP)
(µg L-1)
Total Phosphorus              24.0           11.0             6.0           33.0              5.0            Not
(TP) (µg L-1)                                                                                           specified

Aluminium (Al3+)       LOP (80%)                                                                    Not specified
(µg L-1)                  – 150.0
Copper (Cu2+)          LOP (80%)                                                                    Not specified
(µg L-1)                     – 9.4
Zinc (Zn2+)            LOP (80%)                                                                    Not specified
 (µg L-1)                  – 31.0
E. coli                     260.0           134.0          108.0            50.0            10.0           550.0
(in CFU/100 mL)

Note: ANZECC (2000), ANZG (2018) and ORC Schedule 15 – Receiving Group 3 (2014) guidelines are used
for tributaries such as Stoney Creek Urban and Stoney Creek Headwaters; Lower and Middle Water
Race/Control; and Bullock Creek Lower, Middle, and Headwaters. ORC Schedule 15 – Receiving Group 5
(2014) used for Lake Wānaka where the drain connect directly to the Lake and ORC Schedule 16 – Area 2
Catchments (2014) are used for the expected quality of a discharge of stormwater from drains, including
McDougall Street Drain, Old Wharf Drain, Bremner Drain, Beacon Point Drain, and Kirimoko Subdivision.
LOP represents trigger values for toxicants at alternate levels of protection as total particulate heavy metals
(Table A1.1-A1.3; Table A2.1)

                                                       7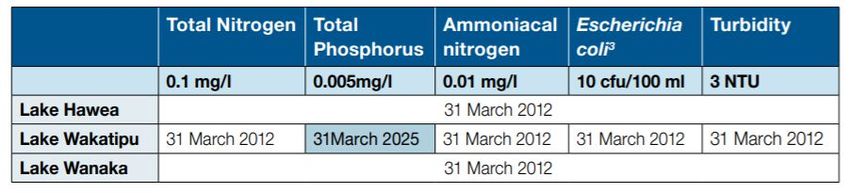
3 Main Findings

3.1 Urban Sprawl in Wānaka since 1956
Urban development in Wānaka was mapped using aerial photographs to assess the change in
impervious area from 1956 - 2018 (Figure 1). Over the past 60 years there has been considerable
growth in imperviousness land cover, with most expansion occurring since 1984 (Figure 2). From the
earliest aerial imagery in 1956, only 44.2 ha of Wānaka was covered in impervious surfaces, but this
continued to grow over the following six decades. In 1968 impervious surface area was estimated to
be 65.3 ha, 89.3 ha in 1976, 115.8 ha in 1984, 206.7 ha in 1999, 288.8 ha in 2006, and 384.4 ha in
March of 2018, and shows an exponential increase in imperviousness (Figure 3). As such, there has
been a rapid expansion in housing developments and suburban sprawl, especially to the south-eastern
flank of Lake Wānaka, including areas of Bremner Bay. Subsequently, increases in developments
such as the latter are adding pressure to the stormwater networks of Wānaka and are actively
deteriorating associated water quality.

                                                 8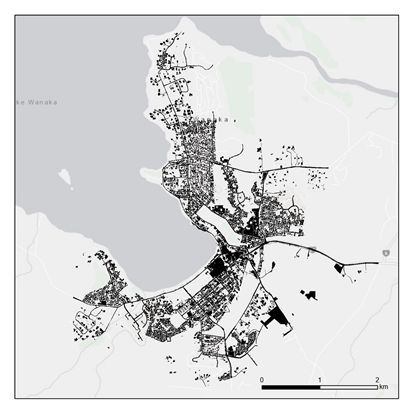
a)                                                 b)

c)                                                 d)

e)                                                 f)

Figure 1: Sixty years of changing impervious surface coverage of the Wānaka township – a) 1956 b)
1968 c) 1976 d) 1984 e) 1999 and f) 2006

                                               9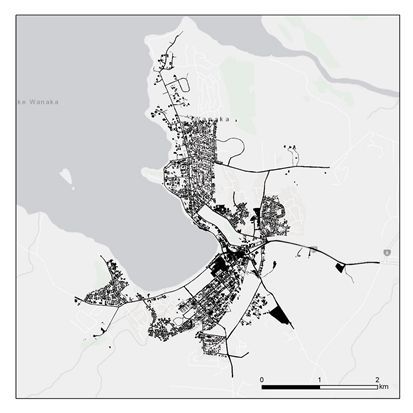
Figure 2: Impervious surface coverage of Wānaka at 03/2018.

                                                     500
                  Impervious Surface Coverage (ha)

                                                                                                     R² = 0.9965
                                                     400

                                                     300

                                                     200

                                                     100

                                                       0
                                                        1950   1960   1970   1980   1990   2000   2010   2020   2030
                                                                                    Year

Figure 3: Impervious surface coverage (ha) for Wānaka for the sixty-two-year period (1956-2018)
derived from aerial and satellite imagery.

                                                                                10
3.2 Data Collection and Sampling Sites
Twelve sampling locations were selected and included seven locations previously used to determine
baseflow conditions by Touchstone/Aspiring Environmental, who have kindly provided their data for
this study to supplement the available data (Figure 4). Most sites are downstream of culverts, or areas
that can be easily accessed, and many have nuisance plant growth within the channel, and little to no
tree cover or riparian shading (Tables 2 & 3; Figures 5 & 6).
Figure 4: Sampling sites including a combination of Touchstones past sites (Stoney Creek
Headwaters, Stoney Creek Urban, Lower Water Race, McDougall Street Drain, Bullock Creek
Headwaters, Bullock Creek Lower) and UCLT new sites (Middle Water Race/Control, Bullock Creek
Middle, Old Wharf Drain, Beacon Point Drain, Kirimoko Subdivision).
11Figure 5: Stormwater Drain Sites including 1) McDougall Street Drain 2) Bremner Drain 3) Old
Wharf Drain 4) Kiromoko Subdivision and 5) Beacon Point Drain.
Figure 6: Natural Waterway Sites including: 6) Middle Water Race/Control 7) Lower Water
Race/Urban 8) Bullock Creek Middle 9) Bullock Creek Head/Control 10) Bullock Creek Lower 11)
Stoney Creek Urban and 12) Stoney Creek Head/Control.
12Table 2: Physical description, human use, and distinguishing factors of the natural waterways and/or
rivers that receive stormwater inflows.
Site Physical Description of Human Use Distinguishing Factors
Catchment
Stoney Creek Tussock grassland – Private road on true left of Dry under fair conditions
Headwaters livestock and rabbits present site as well as over the creek
Outer creek erosion and
loose sediment
Stormwater discharge feeds
into true left of site,
possibly from Holiday Park
or road
Stoney Creek Large stormwater drain Busy car park in close Flows directly into Lake
Urban feeding into site (concrete proximity to the true right of Wānaka
stabilised) site Popular swimming site
Main road, busy vehicular Lots of loose sediment from
traffic over site where lots Meadowstone Development
of stormwater collects during sampling timeframe
Bridge directly over site in 2017-2020.
Middle Water Historical sediment fluxes Residential subdivision – Upstream land uses include
Race/Control drains feed directly into sheep, beef, and deer
Heavy vegetation in stream stream farming in the lower
which can cause stagnant Cardrona Catchment
water
Bullock Creek Natural spring Walking track through site Impacts of Alpha Series
Headwaters Lots of newly planted Development during
riparian vegetation around sampling timeframe 2018-
walking track 2020. Issues including loose
sediment, stormwater and
sediment overflows during
heavy rainfall events
Metal stabilisers in ground
(shows potential erosion
risk of site)
Bullock Creek Natural spring Drains feeding into true left Potential nutrient influence
Middle of site from residential area from the golf course
above site
Bullock Creek Natural spring Nested in residential and Flows directly into Lake
Lower Lots of small stormwater commercial land uses Wānaka
inflows merging directly Bridge upstream of site and
into site busy car park on true right
13Table 3: Physical description, human use, and distinguishing factors of the stormwater outflows that
discharge directly into Lake Wānaka.
Site Physical Description of Human Use Distinguishing Factors
Catchment
McDougall Street Stormwater drain Drains through residential Potential influence of
Drain High impervious surface subdivision Pembroke Park and the
area draining into catchment Main road, busy vehicular rugby grounds
Relatively stagnant flows traffic through site Flows directly into Lake
during baseflow and Wānaka
stormflow New carpark built in close
proximity to site in 2019
Old Wharf Drain ‘Smelly Drain’ Drains residential area Flows directly into Lake
Little to no discharge under above – lots of manholes Wānaka
fair conditions, however site and roadside stormwater
pumps under heavy rainfall drains, including natural
swale
Concrete and gravel
walkway directly over site
Bremner Drain Large concrete enforced Popular recreational site for Flows directly into Bremner
drain walking, biking, and Bay, Lake Wānaka
Lots of ducks, rabbits, and swimming New developments
dogs consistently being built
Beacon Point Large concrete enforced Drains residential area Flows directly into Lake
Drain drain with algal growth and above – lots of manholes Wānaka
slime in it and roadside stormwater
Lots of ducks, rabbits, and drains
dogs Popular recreational site for
walking and biking
Lower Water Historic sediment fluxes Main road, busy vehicular Flows directly into Lake
Race traffic over site – Wānaka
stormwater flows into site Upstream land uses include
as a result of aspect/slope sheep, beef, and deer
farming in the lower
Cardrona Catchment
Kirimoko Natural swale High density building – ‘Water Sensitive Urban
Subdivision still a lot of concrete Design’ (WSUD) and ‘Low
Impact Development’ (LID)
subdivision
14Table 4: Stormwater sampling campaigns in Wānaka township, with details of rainfall amount,
intensity, and holding period (in hours) that describes the time between significant rain events (i.e., >
1 mm hr−1) as recorded at the NIWA CWS Station in Wānaka. Datasource: NIWA Cliflo (2020).
Rainfall
Total
Intensity Holding
Sampling Campaign Rainfall Notes
(mm hr−1) period
(mm d−1)
Mean Max
5/6 November 2017 10.8 1.5 2.4 51 with no rain within a 2-month
period of little rainfall samples
collected 4 hours into storm
17/18 January 2018 2.4 0.4 1.0 837 samples collected 2 hours
1/2 February 2018 96.8 3.5 10.0 348 samples collected 14 hours into
storm event
17/18 September 2018 45.2 2.5 5.8 74 1-day lag between storm event
and sampling
29/30 September 2018 35.8 2.0 5.0 124 collected over two days from
initiation of storm event
25 October 2018 19.6 2.0 4.4 343 first flush sampling plus hourly
sampling at Bremner Drain and
Old Wharf Drain
19 January 2019 9.2 1.3 4.0 146 one-hour sampling from first
flush event
19/20 February 2019 4.2 1.4 2.8 172 first flush sampling
24/25 March 2019 10.6 0.8 2.8 214 first flush sampling. 10.5 mm in
45.8* 1.5* 4.6* first pulse of rain, with several
hours until second pulse of rain.
18 October 2019 8.8 1.1 2.2 192 first flush sampling of all sites
plus temporal sampling of
Bremner Drain over 3.5 hours
in 15-minute intervals
04 February 2020 59.4 3.1 6.8 255 first flush sampling collected
within 60 minutes of first pulse
of rain
153.3 Base Flow Conditions of Perennially-Flowing Watercourses
Key Points:
• Nitrate is naturally high in the regional groundwater and in spring-fed creeks
• Nitrate is low in headwater creeks fed from hillslope runoff
• Nitrate is high in stormwater outfall under baseflow conditions
• Stoney Creek is accumulating nitrate downstream
• Perennial flowing stormwater outfalls has elevated nutrients that may be damaging to the near
shore zone of Lake Wānaka
Baseflow water chemistry was provided by Touchstone1 (2017–2018), and sampled by the University
of Otago (in 2020). Baseflow samples were collected under dry conditions with 5–12 days of no
significant rain (> 1 mm) by Touchstone who provided the data to the University of Otago for this
project. An additional baseflow sample was collected after 22 days of no significant rain in January
2020. The description of the data below summarises both of these datasets, and the University of
Otago data is provided in full in the Appendix.
3.3.1 Natural Watercourses
Stoney and Bullock creeks are two small natural waterways that flow through the residential and
commercial areas of Wānaka and discharge into Lake Wānaka. Both waterways are heavily modified
and channelized and receive numerous stormwater outfalls. Stoney Creek is maintained by hillside
runoff from upland low intensity agriculture. Bullock Creek is a local spring maintained by
groundwater of the Wānaka aquifer that is fed by losses from Cardrona River through the Cardrona
delta. Bullock Creek’s upper reaches have been restored with indigenous plantings to improve its
habitat and amenity values; however, in storm events it may be vulnerable to inundation of sediment-
rich overland flows from a nearby pond designed to trap sediment from nearby housing development,
as well as contaminated runoff from the large urban area (Figure 7).
1
The Touchstone Project is a direct-action initiative to support those concerned about the Lake Wānaka water catchment,
raise awareness of impacts around the lake, and how you can have a positive influence on the water in the lake. Data
provided by Aspiring Environmental.
16Figure 7: Stormwater sediment detention pond located near Bullock Creek Headwaters as a part of
the Alpha-Series Development. This pond has been known to overflow during high rainfall events
contaminating all Bullock Creek sites before discharging into Lake Wānaka (Photo: 6th August 2018).
Analysis of the baseflow water chemistry (Table 5) of the headwaters of Bullock Creek reveals high
nitrogen concentrations (> 0.8 mg L−1). Bullock Creek is hydrologically connected to water
discharging from the Cardrona River into the Wānaka Basin aquifer2. Concentrations of nitrate-
nitrogen are generally low in the Cardrona River (< 0.06 mg L−1), but nitrate-nitrogen concentrations
are significantly higher in the groundwater likely accumulating over time from agricultural land uses3,
ranging from 1.4–2.2 mg L−1. The high concentrations of Bullock Creek (0.8–1.3 mg L−1) observed in
its upper reaches appear consistent with re-emergence of groundwater from the local aquifer. By
comparison, Stoney Creek (above Wānaka township), which is entirely fed from hillslope runoff had
nitrate-nitrogen concentrations < 0.006 mg L−1, and does not show any influence from agriculture, or
exchange with groundwater.
The other key nutrient indicators, including ammonium (NH4+) and dissolved reactive phosphorus
(PO43-) were usually at, or below detection limit for Stoney and Bullock creeks. Phosphorus
concentrations in the Cardrona River (0.007 mg L−1) and the Wānaka Basin aquifer (0.003 mg L−1) are
usually very low; the latter is likely attenuated via phosphorus sorption in the aquifer (Golders, 2015).
For Bullock Creek most of the nitrogen is nitrate, contributing at least 90% of the total nitrogen,
2
Heller (2001)
3
Rosen and Jones (1998) and Jackson (2017)
17suggesting that there are no significant sources of organic nitrogen, and generally low concentrations
of ammonium. The headwater river sites for both Stoney and Bullock usually had low suspended
sediment (< 3 mg L−1) and turbidity (< 1), and generally low concentrations of E. coli (< 60 CFU per
100 mL). These data suggest that the high nitrate observed in Bullock Creek are not associated with
any agricultural waste products, rather reflect the underlying chemistry of the Wānaka Basin aquifer.
One notable outlier was Stoney Creek in January 2020, which had unusually high E. coli compared to
previous data collection (> 2400 CFU per 100 mL). The baseflow data collected in January 2020 was
preceded by 21 days of no rain (during summer), and it is possible that the high E. coli observed in the
waterways is due to irregular flushing of the creek, combined with warm water temperatures,
sufficient nutrients for sustaining E. coli colonies and avian droppings (e.g., local populations of
ducks). Such a high E. coli reading is of concern and further investigation is warranted to assess
whether recent development has lead to a missed cross-connection of municipal wastewater in this
location, or whether upper Stoney Creek is vulnerable to aggregation of bird flocks or other animal
wastes. Monitoring of Stoney Creek should be seen as a priority given that it discharges into the
popular swimming are of Roys Bay.
Table 5: Baseflow water quality of natural waterways in Wānaka above stormwater outfall effects. All
measurements in mg L−1, except for E. coli which is in units of CFU per 100 mL.
NO3 NH4 Total N PO4 Total P SSC E. coli Data Source
Bullock 1.05riparian or in-channel vegetation), or through dilution from other water discharges into the river
network. Given that the nitrate concentration drops equally in summer and winter, it is less likely that
the reduction of nitrate in channel is caused by uptake, as this should exhibit a strong seasonal
variation. Rather, it is considered more likely that throughflow from Wānaka, and stormwater outfall
dilutes the nitrate concentrations through flow accumulation. The water sources could be slow-
released throughflow from rain, or municipal supply (e.g., lawn watering, irrigation of gold course)
that is slowly routed into the river network. Both of these sources would have significantly lower
nitrate concentrations than the Wānaka aquifer.
The opposite occurs in Stoney Creek, where the headwaters have naturally low nitrate, but it quickly
accumulated through the channelized river system increasing to 0.5–1.8 mg L−1. These data suggest
that there is a direct source of nitrate that is discharging into Stoney Creek as a result of the expansion
of the suburban fringe. Urban sources of nitrate usually include fertilizers associated with lawn
maintenance, or mismanagement of effluent (e.g., sewage or detergents external washing of buildings,
boats, cars etc.). The rapid increase in nitrate could indicate household wastewater is making its way
through the stormwater network into Stoney Creek, either as grey water that may be contaminated
with detergents (e.g., car wash, showers, etc.), or black water (e.g., crossed sewage connections).
Alternatively, Stoney Creek could also accumulate nitrate from groundwater gains as it flows towards
Lake Wānaka; although this is deemed less likely since nitrate drops through Bullock Creek. From the
baseline data available, it cannot be determined what the source of high nitrate is, as phosphorus
concentrations are slightly elevated downstream, but are not of concern (0.004–0.007 mg L−1), and
there higher concentrations of E. coli (400–1000 CFU per 100 mL), which are high and of concern,
but could also be a function of birds and/or domestic pet waste.
Of the natural watercourses analysed in this study, downstream changes in water quality are specific
to each waterway, and there is no consistent trend between the waterways. Future work should
investigate the downstream increases in nitrate in Stoney Creek as this has an 100 times increase in
nitrate concentration, and may be damaging to the sensitive receiving environment of Roys Bay in
Lake Wānaka. It cannot be determined from this study what are the sources of increasing nitrate in
Stoney Creek; one possibility is nitrate being discharged from households, or that Stoney Creek is
accumulating nitrate as nitrate-rich groundwater flows into the stream. The latter could be resolved
from an in-channel survey of Stoney Creek looking for evidence of influent groundwater, and could
be easily surveyed to check for increases in electrical conductance, changes in water temperature, and
changes in water volume. Despite a decline in nitrate downstream in Bullock Creek, the
concentrations of nitrate in Stoney and Bullock creeks are of concern (0.7 mg L−1) and are
approaching concentrations that may be deleterious for ecosystem habitats for nitrogen-sensitive
species, or cause nuisance growth.
193.3.2 Perennially-Flowing Drains
Of the stormwater network in Wānaka, a few of the drains flow year-round (Table 6). Such flows
usually indicate that groundwater that is making its way into the drain network (for example, through
poorly fitting pipe junctions, cracked piping etc.), or from crossed connection and/or municipal supply
being routed through the stormwater network. Of the numerous stormwater outfalls around Wānaka
perennial outfalls include: Bremner Bay, Water Race, McDougall Drain, and Old Wharf.
Table 6: Average (mean) concentrations of water quality indicators from perennially-flowing drains
that discharge into Lake Wānaka, as measured under baseflow conditions between 5–21 days after
any significant rain. All measurements in mg L−1, except for E. coli which is in units of CFU per 100
mL.
NO3 NH4 Total N PO4 Total P SSC E. coli
Beacon 0.07 0.20 0.010100 mL respectively) than previous measurements of E. coli and may suggest that during long dry
spells that E. coli counts may increase with long holding periods. Environmentally, this suggests that
during long hot summers, the bacterial load of the drain outfalls may increase to concentrations that
present a risk to casual recreational use of waterways in the immediate proximity to these outfalls.
Of the perennial flowing drains all (except for Beacon Point) discharge degraded water: usually with
elevated nitrate concentrations. If the drains are dewatering local groundwater, then these nitrate
concentrations are similar to the nitrate reported in the Wānaka aquifer, where nitrate has accumulated
over time, but does not explain the unusually high nitrate concentrations from Water Race. These
drains also have elevated phosphorus concentrations (0.05–0.33 mg L−1), as well as ammonium and
nitrite, which collectively are indicators of urban wastewater suggesting that these outfalls are
discharging wastewater that should otherwise be diverted to municipal water treatment. The unusually
high concentrations of nitrate from Water Race should be further investigated to see whether these
concentrations are related to leachate from nearby recreational reserves. Of final note is that the
discharge of sediment through McDougall drain is much higher than that observed in other drains and
suggests that land disturbance, either through poorly protected drain banks, or soil erosion associated
with recent building and development is making its way through the drain network. Outfall of
sediment even under baseflow conditions from this drain is much higher than observed in natural
waterways, and is depositing fine material into Lake Wānaka that may also carry other nuisance
contaminants, and produce a visible sediment plume. The amount of sediment moved through this low
competence drain system is small, but is indicative of poor sediment management and bank armouring
within this sub-catchment.
Recommendations for further work:
• Investigate sources of sediment and land disturbance occurring in McDougall Drain sub-
catchment, as it has high sediment discharges under baseflow;
• Investigate sources of E. coli in Stoney Creek to confirm if bacteria is associated with local
bird populations;
• Investigate remediating high nitrate concentrations in Stoney Creek and Water Race; possibly
by considering installing local wetlands, and riparian planting to uptake nitrogen;
• Investigate sources of elevated phosphorus concentrations in Bremner Bay, McDougall Drain,
and Old Wharf that may be associated with household wastewater
• Prioritise assessing the nitrate and E. Coli concentrations in popular swimming locations
during summer, especially in the downstream plume of Stoney Creek (Roys Bay)
213.4 Stormwater Outfalls during Rain Events
Ten storm events were sampled that held the minimum holding period of 72 hours without significant
rain (Table 4). The holding period is important as this provides time for contaminants to accumulate
on land surfaces, and then be washed into the stormwater network. Events where there are continued
and frequent rain events will also wash these contaminants into the environment; however, repeated
high frequency events displace the contaminants so that they may not be at detectable levels over
multiple cycles. The most common frequency of rain events in Wānaka during the study period
ranged between 0.5 to 1.5 mm hr-1, and that rain events became less frequent as storm intensities
increased (i.e., up to 7.5 mm hr-1). All rainfall events captured in this study ranged between low,
medium, and high frequency events – capturing a broad variety of storm intensities. A summary of the
baseflow and stormflow comparison for stormwater for each of the sampled sites, relative to
regulatory thresholds are in Table 7 and Table 8.
22Table 7: Median baseflow and stormflow concentrations for 7 stormwater contaminants including:
turbidity, suspended sediment, E. coli, total phosphorus, dissolved reactive phosphorus, total
nitrogen, and nitrate. Baseflow concentrations were available for 7 sites whilst stormflow
concentrations were available for all 12 sites. Values that exceed both the ANZECC Guidelines and
Schedule 15 thresholds are highlighted in blue below.
Turbidity SSC E. coli TP DRP TN NO3
Median Median (CFU/100 (µg L-1) (µg L-1) (µg L-1) (µg L-1)
(NTU) (mg L-1) ml)
Bremner Drain Baseflow - < 3.0 27.0 - 3.5 - 530.0
Stormflow 37.6 51.6 960.6 282.0 60.0 1880.0 432.0
Bullock Creek Baseflow - < 3.0 210.0 - < 1.0 - 660.0
Lower Stormflow 3.2 3.5 540.0 7.5 4.0 696.5 661.5
Bullock Creek Baseflow - 5.0 19.0 - < 1.0 - 920.0
Headwaters Stormflow 3.2 7.5 60.0 5.0 4.0 1163.5 1115.5
McDougall St Baseflow - 34.0 5.0 - 16.1 - 380.0
Drain Stormflow 23.9 40.9 4210.0 374.0 90.0 2911.5 208.5
Lower Water Baseflow - < 3.0 26.0 - < 1.0 - 2500.0
Race Stormflow 14.1 17.0 3210.0 185.5 43.0 2097.0 1120.0
Stoney Creek Baseflow - < 3.0 310.0 - 8.6 - < 1.0
Urban Stormflow 16.2 26.7 4210.0 220.0 68.0 2038.0 415.0
Stoney Creek Baseflow - 3.0 2.0 - 30.4 - 1700.0
Headwaters Stormflow 7.1 12.0 1643.0 70.0 29.0 542.0 18.0
Beacon Point Stormflow 14.3 13.1 2419.6 234.0 101.5 2346.0 338.0
Drain
Old Wharf Drain Stormflow 37.3 43.4 2419.6 319.5 136.0 2258.0 410.0
Kirimoko Stormflow 43.2 30.2 2893.0 331.0 144.0 693.5 255.0
Subdivision
Bullock Creek Stormflow 1.9 3.4 180.0 7.5 5.5 700.5 679.0
Middle
Middle Water Stormflow 18.4 13.7 1296.2 194.0 86.5 1690.5 250.5
Race/Control
23Table 8: Median stormflow concentrations for total recoverable and dissolved metals for the 12
monitored sites and the percentage of sample which is in dissolved form. Values that exceed both the
ANZECC Guidelines and Schedule 15 thresholds are highlighted in blue. (ND –below the method
detection).
Al Ag B Ba
80% ANZECC
Total Diss % Total Diss % Total Diss % Total Diss %
Guideline -1 -1
150 µg L 1300 µg L
Stoney Creek
208.9 11.2 5.4 1.4 ND 0 3 4.2 71.4 8.7 ND 0
Headwaters
Stoney Creek
207.7 5 2.4 5 ND 0 6.5 8.2 79.3 7.5 ND 0
Urban
Middle Water
267.2 ND 0 2.2 ND 0 8.9 9.9 89.9 7.8 ND 0
Race/Control
Lower Water
148 3.3 2.2 3.2 0.8 25 10.3 8.7 84.5 8.8 ND 0
Race
McDougall Street
457.3 30 6.6 2.3 ND 0 8.5 8.9 95.6 22.2 ND 0
Drain
Bullock Creek
33.3 ND 0 1.4 ND 0 2.5 3.5 71.4 4 ND 0
Headwaters
Bullock Creek
27.8 ND 0 1.5 ND 0 1.9 2.6 73.1 4.3 ND 0
Middle
Bullock Creek
33.6 ND 0 1.3 ND 0 1.9 3.6 52.8 4.1 ND 0
Lower
Old Wharf Drain 1253.2 32.9 2.6 1.6 0.6 37.5 14.4 17.8 80.9 15.9 ND 0
Bremner Drain 1246.3 16.9 1.4 1.2 ND 0 17.9 19.8 90.4 14.3 ND 0
Beacon Point
378.4 20.5 5.4 1.5 ND 0 18.4 19.9 92.5 6.1 ND 0
Drain
Kirimoko
787.4 61.8 7.8 5.5 7 78.6 21 15.2 71.4 12.3 ND 0
Subdivision
Cu Fe Mn Pb
80% ANZECC
Tot Dis % Tot Dis % Tot Dis % Tot Dis %
Guideline
2.5 µg L-1 3600 µg L-1 9.4 µg L-1
Stoney Creek
1.5 ND 0 411 37.4 9.1 17.5 6.8 38.9 1.6 ND 0
Headwaters
Stoney Creek
9.6 ND 0 345 26.4 7.6 28.3 1.1 3.9 1.3 ND 0
Urban
Middle Water
1.5 ND 0 424 18.9 4.5 18.6 3.7 19.9 0.4 ND 0
Race/Control
Lower Water Race 4.8 1.2 25 455 33.7 7.4 25.8 12.1 46.9 0.7 ND 0
McDougall Street
4.4 ND 0 1223 97.3 7.9 163.1 9.3 5.7 2.0 ND 0
Drain
Bullock Creek
0.4 ND 0 52 ND 0 2.3 0.7 30.4 ND ND 0
Headwaters
Bullock Creek
0.4 ND 0 42 7.1 16.6 2.5 1.3 52 ND ND 0
Middle
Bullock Creek
0.5 ND 0 45 9.8 21.4 3.1 1.7 54.8 ND ND 0
Lower
Old Wharf Drain 10.6 4.6 43.4 2226 49.3 2.2 74.9 8.6 11.5 4.9 ND 0
Bremner Drain 8.7 2.8 32.2 1947 35.8 1.8 69.3 8.8 12.7 1.9 ND 0
Beacon Point
2.4 1.1 45.8 654 39.5 6 37.8 5.1 13.5 1.5 ND 0
Drain
Kirimoko
3.9 0.3 7.7 1301 55.8 4.3 32.2 4.8 14.9 1.2 ND 0
Subdivision
24S Sr Zn
80% ANZECC
Total Diss % Total Diss % Total Diss %
Guideline -1
31 µg L
Stoney Creek
2158.9 ND 0 132.9 0.13.5 Evidence for a First Flush Response in Stormwater
Key Points:
• Heavy metals and total nitrogen are quickly flushed through stormwater and peak within the
first hour of a rain event;
• Suspended sediment and turbidity usually peak within the first hour, but also respond to
increased rainfall intensity throughout an event;
• Most contaminants in stormwater exceed freshwater regulatory thresholds during an event
(but such guidelines usually exclude storm flows).
The hydrochemistry of stormwater discharge is often characterised depending on its behaviour at the
onset of significant rainfall, as a ‘first flush’. Such behaviour assumes that the initiation of a rainfall
event has sufficient momentum to initiate contaminant mobilisation and that sufficient ground
saturation occurs within the first 30–60 minutes of a rainfall event to generate a ‘first flush’.
Experimental work explored the occurrence of flushing behaviour examining Bremner Bay as a case
study.
The flushing behaviour over an event was observed on three occasions at Bremner Bay. The first of
these events collected samples on the 29/30-Sep-18 during the first flush ( < 1 hour), and then 14 and
17 hours afterwards to assess whether the first flush was coincident with mobilisation of different
contaminants from within the sub-catchments. Maximum contaminant concentrations varied during
the progression of the storm event, where maximum concentrations occurred 14 hours after the first
flush for suspended sediment (54.9 mg L-1) and total phosphorus (332.0 µg L-1), and 17 hours for
turbidity (61.4 NTU), total nitrogen (613.0 µg L-1) and total recoverable heavy metals. For the total
recoverable heavy metals aluminium had a maximum concentration of 1286.9 µg L-1 and copper had a
maximum concentration of 5.5 µg L-1 (Figure 8). The highest concentration of zinc occurred during
the initial first flush and reached 53.6 µg L-1. As expected, many contaminant concentrations during
the storm event exceeded recommended guidelines. Copper and zinc, however, generally did not
exceed the regulatory thresholds (Figure 9). Total recoverable copper was below recommended
guidelines (i.e., 2.5 µg L-1) during the first flush with 0.6 µg L-1, and zinc was below recommended
guidelines (i.e., 31.0 µg L-1) at the first flush + 14 hours with 18.7 µg L-1 and the first flush + 17 hours
with 21.7 µg L-1.
Maximum contaminant concentrations were usually observed during the initial first flush, specifically
for turbidity (53.2 NTU), total phosphorus (352.0 µg L-1), total nitrogen (180.1 µg L-1) and total
recoverable heavy metals (aluminium – 1999.5 µg L-1; copper – 20.9 µg L-1; and zinc – 189.5 µg L-1)
(Figure 9). Comparatively, sampling of a second storm on 19-Feb-19 at Bremner Bay showed that 1-
hour post first flush was where maximum contaminant concentrations occurred for suspended
sediment (51.0 mg L-1), dissolved reactive phosphorus (60.0 µg L-1), and nitrate (324.0 µg L-1). All
26contaminant concentrations during the storm event exceeded recommended guidelines except for
aluminium during the first flush, which did not exceed recommended guidelines (i.e., 150 µg L-1) and
measured at 70.3 µg L-1 (Figure 9).
2780
Turbidity (NTU)
60
40
20
3
0
First Flush First Flush + 14 hours First Flush + 17 hours
60
Suspended Sediment
Concentration (µg/L)
40
20
1.3
0
Bremner Drain Baseline First Flush First Flush + 14 hours First Flush + 17 hours
Median
400
Total Phosphorus (µg/L)
300
200
100
5
0
First Flush First Flush + 14 hours First Flush + 17 hours
800
Total Nitrogen (µg/L)
600
400
200
100
0
First Flush First Flush + 14 hours First Flush + 17 hours
Contaminant Concentration Recommended Guideline
Figure 8: First flush analysis of turbidity, suspended sediment, total nitrogen, and total phosphorus at
Bremner Drain during the storm event 29/30-09-18. Recommended guidelines comply with Plan
Change 6a by the Otago Regional Council by applying Schedule 15- Receiving Group 5.
281500
Aluminium (µg/L)
1000
500
150
0
First Flush First Flush + 14 hours First Flush + 17 hours
6
4
Copper (µg/L)
2.5
2
0
First Flush First Flush + 14 hours First Flush + 17 hours
60
40
Zinc (µg/L)
31
20
0
First Flush First Flush + 14 hours First Flush + 17 hours
Contaminant Concentration Recommended Guideline
Figure 8 (cont): First flush analysis of total recoverable heavy metals (aluminium, copper, and zinc)
for storm event 29/30-09-18. Recommended guidelines comply with ANZECC (2000) as no guidelines
exist for toxicants under Plan Change 6a – Schedule 15 (Receiving Group 5).
2960 60
Concentration (mg/L)
Suspended Sediment
Turbidity (NTU)
40 40
20
20
1.3
3 0
0 Baseline First First First
First Flush First Flush + First Flush + Median Flush Flush + 1 Flush + 2
1 Hour 2 hours Hour hours
400 2000
Total Phosphorus (µg/L)
Total Nitrogen (µg/L)
300 1500
200 1000
100 500
5 100
0 0
First Flush First Flush + First Flush + First Flush First Flush + First Flush +
1 Hour 2 hours 1 Hour 2 hours
80 600
Dissolved Reactive
Phosphorus (µg/L)
400
Nitrate (µg/L)
60
200
12
40
0
Baseline First First First
20 Median Flush Flush + 1 Flush + 2
5 Hour hours
0
Contaminant Concentration
Baseline First First First
Median Flush Flush + 1 Flush + 2 Recommended Guideline
Hour hours
Figure 9: First flush analysis of turbidity, suspended sediment, total nitrogen, nitrate, total
phosphorus, and dissolved reactive phosphorus at Bremner Drain during the storm event 19-02-19.
Recommended guidelines comply with ANZECC and Plan Change 6a guidelines by the Otago
Regional Council (Schedule 15- Receiving Group 5).
303000
Aluminium (µg/L)
2000
1000
150
0
First Flush First Flush + 1 hour First Flush + 2 hours
30
20
Copper (µg/L)
10
2.5
0
First Flush First Flush + 1 hour First Flush + 2 hours
225
150
Zinc (µg/L)
75
31
0
First Flush First Flush + 1 hour First Flush + 2 hours
Contaminant Concentration Recommended Guideline
Figure 9 (continued): First flush analysis of dissolved heavy metals (aluminium, copper, and zinc) for
storm event 19-02-19. Recommended guidelines comply with ANZECC (2000) as no guidelines exist
for toxicants under Plan Change 6a – Schedule 15 (Receiving Group 5).
31The third storm event that was sampled on the 18-Oct-19, was sampled every 15-minutes over the
first part of the storm, to investigate the first flush effect in greater detail (although it should be noted
that the storm exceeded the 3 hour sampling, so that contaminants may continue to be discharged after
the peak flow and during storm flow recession, so that total loads cannot be quantified for the storm).
The third storm sampling at Bremner Bay indicated that maximum contaminant concentrations varied
during the progression of the storm event. The initial first flush for suspended sediment, total
phosphorus, total nitrogen, nitrate, and copper occurred within the first 30 minutes of the storm event
(Figure 10). Maximum contaminant concentrations included 230.0 mg L-1 for suspended sediment
(followed by a second flush 1 hour and 15 minutes into the event at 154.0 mg L-1), 450.0 µg L-1 for
total phosphorus, 2000.0 µg L-1 for total nitrogen (first flush was relatively steady 15 minutes to 1
hour into the storm event), 800.0 µg L-1 for nitrate (which slowly began to increase towards to end of
the storm event), and 10.5 µg L-1 for total recoverable copper. The first flush effect generally occurred
around 0 to 30 minutes into the storm event on the 18-Oct-2019, but this was not the case for E. coli,
dissolved reactive phosphorus, aluminium, and zinc. The maximum contaminant concentration for E.
coli occurred 1 hour from the initiation of the storm event and peaked at 21,000.0 CFU/100ml,
compared to dissolved reactive phosphorus which occurred 15 minutes into the storm event and again
3.5 hours after the initiation of the storm event at 40.0 µg L-1, and exhibited two distinct flushes of
phosphorus (Figure 10). The maximum contaminant concentration for aluminium and zinc also
occurred 1 hour and 1 hour and 15 minutes into the storm event with respective concentrations of 55.0
µg L-1 and 51.9 µg L-1 (Figure 10). All contaminants concentrations exceeded recommended
guidelines during all intervals during the storm event, with the exception of total recoverable copper
and zinc where 7 sampling intervals were within recommended guidelines.
32Dissolved Reactive E.coli (CFU/100ml) Suspended Sediment
Phosphorus (µg/L) Concentrations (mg/L)
5
15
30
45
0
1.3
10000
20000
30000
0
10
100
200
300
0
0 min 0 min 0 min
15 min 15 min 15 min
30 min 30 min 30 min
45 min 45 min 45 min
1 hour 1 hour 1 hour
1 hour 15 min 1 hour 15 min 1 hour 15 min
1 hour 30 min 1 hour 30 min 1 hour 30 min
1 hour 45 min 1 hour 45 min 1 hour 45 min
2 hours 2 hours 2 hours
2 hours 15 min 2 hours 15 min 2 hours 15 min
2 hours 30 min 2 hours 30 min 2 hours 30 min
2 hours 45 min 2 hours 45 min 2 hours 45 min
3 hours 15 min 3 hours 15 min 3 hours 15 min
33
Regional Council (Schedule 15- Receiving Group 5).
Total Phosphorus (µg/L) Total Nitrogen (µg/L)
Nitrate (µg/L)
5
200
400
600
0
300
600
900
0
1000
2000
3000
0
12
100
0 min 0 min 0 min
15 min 15 min 15 min
30 min 30 min 30 min
45 min 45 min 45 min
1 hour 1 hour 1 hour
1 hour 15 1 hour 15 min 1 hour 15 min
1 hour 30 1 hour 30 min 1 hour 30 min
1 hour 45 1 hour 45 min 1 hour 45 min
2 hours 2 hours 2 hours
Recommended Guideline
2 hours 15 2 hours 15 min 2 hours 15 min
Contaminant Concentration
2 hours 30 2 hours 30 min 2 hours 30 min
2 hours 45 2 hours 45 min 2 hours 45 min
3 hours 15 3 hours 15 min 3 hours 15 min
Recommended guidelines comply with ANZECC and Plan Change 6a guidelines by the Otago
Sample 13 however, was collected 30 minutes after the previous sample. Analysis includes suspended
Figure 10: Bremner Drain first flush analysis for the storm event 18-10-19. Event was sampled in 15-
minute intervals, 13 times, for a duration of 3.5 hours starting at 2.51pm and ending at 6.22pm.
sediment, E. coli, total phosphorus, total nitrogen, dissolved reactive phosphorus, and nitrate.200
Aluminium (µg/L)
150
100
50
0
0 min 15 min 30 min 45 min 1 hour 1 hour 1 hour 1 hour 2 2 2 2 3
15 min 30 min 45 min hours hours hours hours hours
15 min 30 min 45 min 15 min
15
Copper (µg/L)
10
5
2.5
0
0 min 15 min 30 min 45 min 1 hour 1 hour 1 hour 1 hour 2 hours2 hours2 hours2 hours3 hours
15 min 30 min 45 min 15 min 30 min 45 min 15 min
60
40
Zinc (µg/L)
31
20
0
0 min 15 min 30 min 45 min 1 hour 1 hour 1 hour 1 hour 2 hours2 hours2 hours2 hours3 hours
15 min 30 min 45 min 15 min 30 min 45 min 15 min
Contaminant Concentration Recommended Guideline
Figure 10 (continued): Bremner Drain first flush analysis for the storm event 18-10-19. Event was
sampled in 15-minute intervals, 13 times, for a duration of 3.5 hours starting at 2.51pm and ending at
6.22pm. Sample 13 was however, collected 30 minutes after the previous sample. Analysis included
total recoverable aluminium, copper, and zinc. Recommended guidelines comply with ANZECC
(2000) as no guidelines exist for toxicants under Plan Change 6a – Schedule 15 (Receiving Group 5).
34You can also read