Ensemble Projection of Future Climate and Surface Water Supplies in the North Saskatchewan River Basin above Edmonton, Alberta, Canada
←
→
Page content transcription
If your browser does not render page correctly, please read the page content below
water
Article
Ensemble Projection of Future Climate and Surface Water
Supplies in the North Saskatchewan River Basin above
Edmonton, Alberta, Canada
Muhammad Rehan Anis *                     and David J. Sauchyn

                                          The Prairie Adaptation Research Collaborative, University of Regina, Suite 219-2 Research Drive,
                                          3737 Wascana Parkway, Regina, SK S4S 0A2, Canada; sauchyn@uregina.ca
                                          * Correspondence: rehan.anis@uregina.ca; Tel.: +1-(306)-250-5773

                                          Abstract: Changes in temperature and precipitation are expected to alter the seasonal distribution of
                                          surface water supplies in snowmelt-dominated watersheds. A realistic assessment of future climate
                                          change and inter-annual variability is required to meet a growing demand for water supplies in all
                                          major use sectors. This study focuses on changes in climate and runoff in the North Saskatchewan
                                          River Basin (NSRB) above Edmonton, AB, Canada, using the MESH (Modélisation Environnementale
                                          communautaire—Surface Hydrology) model. The bias-corrected ensemble of Canadian Regional
                                          Climate Model (CanRCM4) data is used to drive MESH for two 60-year time periods, a historical
                                          baseline (1951–2010) and future projection (2041–2100), under Representative Concentration Pathway
                                          (RCP) 8.5. The precipitation is projected to increase in every season, there is significant trend in spring
                                          (0.62) and fall (0.41) and insignificant in summer (0.008). Winter extreme minimum temperature and
                                          summer extreme maximum temperature are increasing by 2–3 ◦ C in the near future and 5–6 ◦ C in

                                   the far future. Annual runoff increases by 19% compared to base period. The results reveal long-term
                                          hydrological variability enabling water resource managers to better prepare for climate change and
Citation: Anis, M.R.; Sauchyn, D.J.
Ensemble Projection of Future
                                          extreme events to build more resilient systems for future water demand in the NSRB.
Climate and Surface Water Supplies
in the North Saskatchewan River           Keywords: ensemble modeling; land surface hydrological model; climate change; extreme runoff change
Basin above Edmonton, Alberta,
Canada. Water 2021, 13, 2425.
https://doi.org/10.3390/w13172425
                                          1. Introduction
Academic Editor: Aizhong Ye                     A shift in the seasonal distribution of surface water supplies, and in the frequency
                                          and severity of flooding and drought, are among the most problematic regional impacts
Received: 9 July 2021
                                          of global climate change [1–3]. These impacts are especially challenging in water-limited
Accepted: 31 August 2021
                                          landscapes and where watershed hydrology is dominated by the melt of a cold season
Published: 3 September 2021
                                          snowpack. Both of these geographic characteristics apply to the mid- and high-latitude
                                          snow-dominated river basins of western Canada. This region has also been subject to
Publisher’s Note: MDPI stays neutral
                                          considerable climate change. Since 1948, Canada has warmed at twice the global rate;
with regard to jurisdictional claims in
                                          while in western Canada, the increase in temperature has been about three times more
published maps and institutional affil-
                                          rapid than global warming [4,5]. As a result, the flow of rivers draining the eastern slopes
iations.
                                          of the Canadian Rocky Mountains has declined in recent decades [6–12].
                                                Over the same period, there has been a growing demand for water supplied from the
                                          Rocky Mountains of western Alberta. This province has a population of about 4.3 million.
                                          It also has most of Canada’s oil and gas industry and irrigated agricultural land. While
Copyright: © 2021 by the authors.
                                          the Rocky Mountains are the water towers of the western interior, most of Alberta is sub-
Licensee MDPI, Basel, Switzerland.
                                          humid, with large seasonal and inter-annual variability and extreme weather typical of a
This article is an open access article
                                          mid-latitude continental climate. Out of the 20 most damaging weather events in Canadian
distributed under the terms and
                                          history, 16 occurred in Alberta [13].
conditions of the Creative Commons
Attribution (CC BY) license (https://
                                                Alberta’s capital city, Edmonton, is the fifth most populous urban area in Canada
creativecommons.org/licenses/by/
                                          with about 1.4 million residents. The water supply for this metropolitan region is the
4.0/).
                                          North Saskatchewan River (NSR). The headwater tributaries (Cline, Brazeau, Ram, and

Water 2021, 13, 2425. https://doi.org/10.3390/w13172425                                                        https://www.mdpi.com/journal/water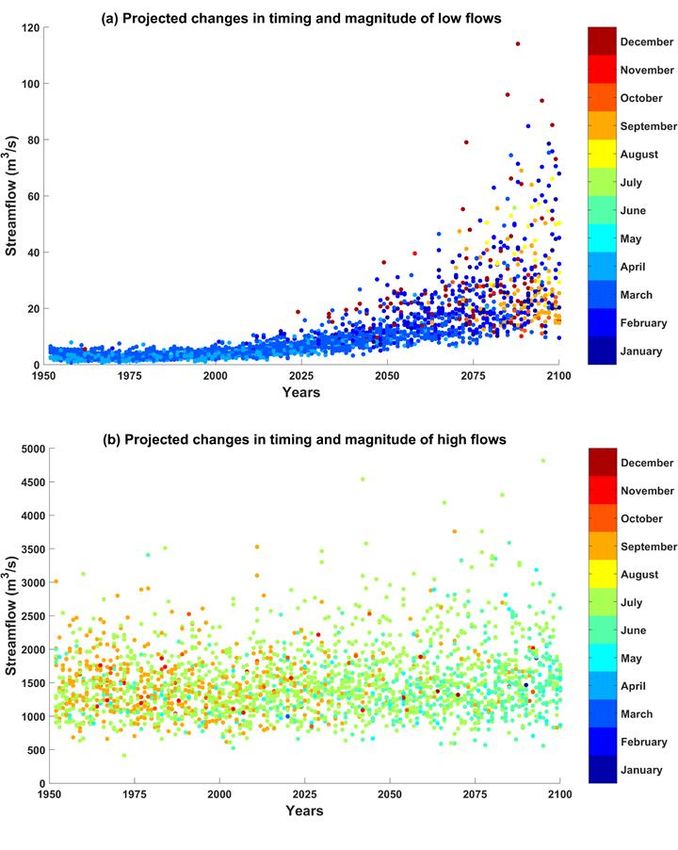
Water 2021, 13, 2425 2 of 18
Clearwater rivers) generate 88% of the total annual runoff [14]. Melt of the high elevation
snowpack maintains river flow through the summer months. At Edmonton, the average
annual temperature has risen by more than 2 ◦ C over the past 120 years. Most of this
climate change has been an increase in the lowest temperatures; minimum daily winter
temperatures have increased by 6 ◦ C [15]. A decrease in the average annual flow of the
NSR at Edmonton since 1911 is consistent with a warmer climate and the resulting loss of
snowpack at high elevations in the headwaters of the river basin. However, the decline is
small compared to large natural inter-annual and decadal variability in flow. Most of the
decreased flow is in summer; winter flows have been trending upward [15].
Previous studies of the impacts of climate change on runoff in the NSRB have applied
coarse output from Global Climate Models (GCMs) to a hydrological model [16] or taken
runoff data directly from simple simulations of hydrology embedded in Regional Climate
Models (RCMs) [9]. The objective of the research described here was to inform water supply
and adaptation planning for climate change in the Edmonton region with an innovative
and higher-resolution approach to modeling of the climate and hydrology of the NSRB.
We processed outputs from a 15-member ensemble of runs of the Canadian Regional
Climate Model (version CanRCM4). Then, we ran a fully calibrated, high-resolution
(10 km) hydrological model, using the future climatology from CanRCM4 and the RCP8.5
greenhouse gas concentration pathway. This ensemble approach enables us to capture
uncertainty resulting from the natural variability of the regional hydroclimate, and control
for uncertainty related to the use of different climate models and emission scenarios.
The quantification of climate uncertainty in the ensemble-based predictions of hy-
drological impact is necessary for the devising of a robust future water demand strategy.
An ensemble of hydrographs under future climate conditions, and information about the
future timing and magnitude of extreme water levels, informs a climate risk assessment of
the resilience of water resource policy and infrastructure, which was designed to operate
under the historical climatic variability. Human-induced climate trends are superimposed
on natural climatic variability, which is more evident and impactful at regional scales. Inter-
annual and decadal-scale variability of the regional hydroclimate is the dominant source of
uncertainty in the projection of the future climate of Canada’s western interior [17]. Our
interpretation of the future contribution of natural variability is very much guided by our
prior reconstruction of the flow of the NSR from tree rings [18–20]. This 900-year record of
hydroclimatic variability includes evidence of prolonged periods of low flows exceeding in
severity and duration the minimum flows in the gauge record.
Anis et al. [15] provided an overview of the impacts of climate change on water security
in Canada’s western interior with a focus on the NSRB. That book chapter took a broad
view, including reviews of historical changes in climate and hydrology, the paleohydrology
of the past millennium, and data on water use and demand of past and future decades. This
paper, on the other hand, is focused exclusively on the projected changes in climate and
river flow in the NSRB above Edmonton, AB, Canada, with technical details and results
not included in [15].
2. MESH Model and Input Data
2.1. Study Area
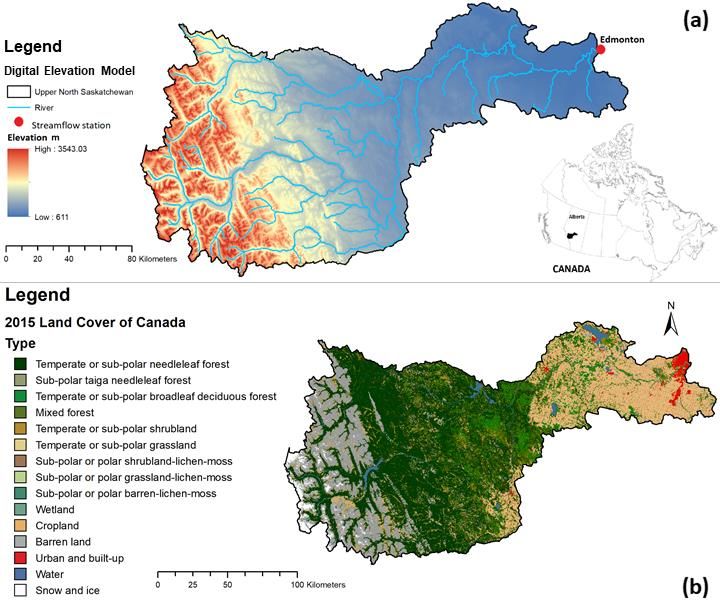
Above Edmonton, the NSRB has a drainage area of 28,100 km2 and elevations ranging
between 611 and 3543 m above sea level. Three major physiographic regions—the Rocky
Mountains, foothills, and plains—are evident from the elevations in Figure 1a and land
cover image of the basin in Figure 1b. The lower mountain slopes have a cover of montane
and sub-alpine forests. The foothill’s vegetation is temperate needleleaf and mixed forest.
The plains land cover is primarily crops and temperate grassland, with some broadleaf de-
ciduous forest (aspen parkland). While the sub-humid plains comprise about 60 percent of
the drainage area, they contribute a small amount of discharge to the North Saskatchewan
River (NSR).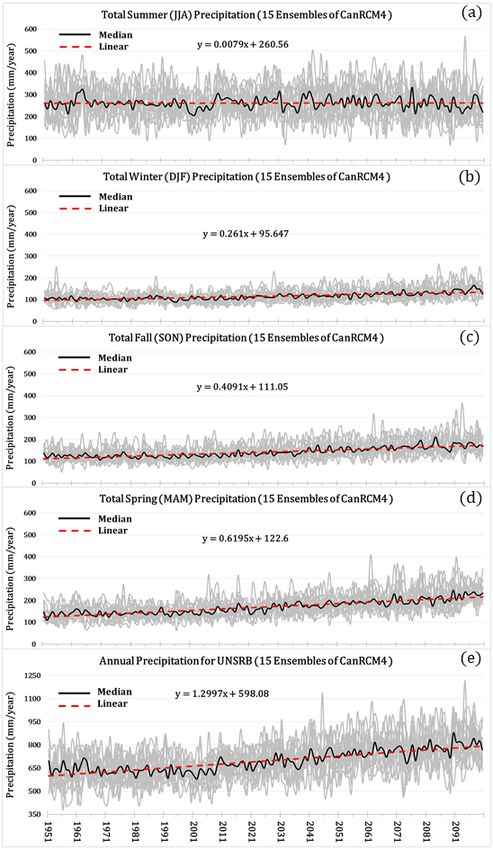
and sub-alpine forests. The foothill’s vegetation is temperate needleleaf and mixed for
The plains land cover is primarily crops and temperate grassland, with some broadl
deciduous forest (aspen parkland). While the sub-humid plains comprise about 60 perc
Water 2021, 13, 2425 3 of 18
of the drainage area, they contribute a small amount of discharge to the No
Saskatchewan River (NSR).
Figure1.1.(a)(a)
Figure The
The physiography
physiography and river
and river network
network of the(b)
of the NSRB. NSRB.
Land (b) Land
cover cover classification
classification of NSRB of NS
aboveEdmonton,
above Edmonton, AB,AB, Canada.
Canada.
The average
The annual
average precipitation
annual across the
precipitation entire the
across drainage
entirearea is 619.5 mm
drainage (1979–2016);
area is 619.5 mm (19
however, it varies from about 475 mm at Edmonton to more than 1000 mm in the Rocky
2016); however, it varies from about 475 mm at Edmonton to more than 1000 mm in
Mountain ranges. The average annual (1979–2016) minimum and maximum temperatures
Rocky
over this Mountain
region are −ranges. The◦ C,
12.3 and 13.6 average annual
respectively. (1979–2016)
Temperatures also minimum and maxim
vary significantly
temperatures
between over thisand
the mountains region are −12.3
the plains. Theandmean13.6 °C, respectively.
annual discharge of the Temperatures
NSR above also v
significantly
Edmonton between
is around 215 m 3 /s.
the mountains and
The origin of thethe
NSRplains. The mean annual
is the Saskatchewan Glacierdischarge
in the of
Columbia Icefields. The glaciers of the Columbia Icefield lost about
NSR above Edmonton is around 215 m /s. The origin of the NSR is the Saskatchew
3 22.5% of their total
area fromin
Glacier 1919
thetoColumbia
2009 [21]. Icefields. The glaciers of the Columbia Icefield lost about 22
of their
2.2. MESHtotal
Landarea from
Surface 1919 to 2009
Hydrological Model[21].
The hydrology of the NSRB above Edmonton was simulated using the MESH model-
2.2.system.
ing MESHMESH
Land Surface Hydrologicalhydrological
is a semi-distributed Model land-surface scheme developed by
The hydrology
Environment and ClimateofChange
the NSRB
Canadaabove
[22]. ItEdmonton was simulated using the ME
has three components:
1.modeling system.
The Canadian Land MESH
Surface is a semi-distributed
Scheme hydrological
(CLASS) [23,24] calculates the energy land-surface
and water sche
balances using physically-based equations for snow, soil, and vegetation
developed by Environment and Climate Change Canada [22]. It has three components at a 30 min
time step;
1. The Canadian Land Surface Scheme (CLASS) [23,24] calculates the energy and wa
2. The routing scheme for the inter-grid transfer of channel flow (lateral movement)
balancessurface
between usingwater
physically-based
and soil to theequations for snow,
drainage system withsoil,
the and
optionvegetation
of using aat a 30 m
time step;
algorithm PDMROF [25] or WATROF [26];
2. The
3. Thehydrological
routing scheme for the
routing, using inter-grid transfer
the semi-distributed of channel
hydrological flow (lateral
model WATFLOOD moveme
[27],
accumulates overland flow and interflow from each grid cell at a given
between surface water and soil to the drainage system with the option of usin time step and
routes them through
algorithm PDMROF the[25]
drainage system to [26];
or WATROF the basin
andoutlet.
3. The hydrological routing, using the semi-distributed hydrological mo
WATFLOOD [27], accumulates overland flow and interflow from each grid cell a
given time step and routes them through the drainage system to the basin outlet.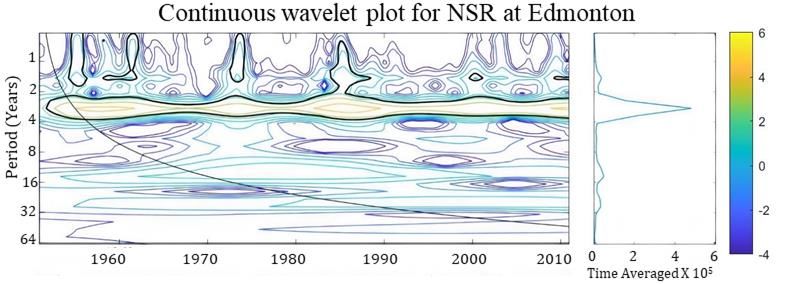
Water 2021, 13, x FOR PEER REVIEW 4 of
Water 2021, 13, 2425 4 of 18
Drainage Database
A 0.125° (−10 KM) drainage database for the NSRB above Edmonton, was constructe
Drainage
using Database
the Green Kenue tool [28] for MESH model input. It consists of 278 grid cells o
◦ (−10 km)
Grouped Response
A 0.125 Unit (GRU)
drainage and twelve
database land above
for the NSRB use CLASS
Edmonton,types
was(Figure 2). A GRU
constructed
using the Green Kenue tool [28] for MESH model input. It consists
based approach combines regions of similar hydrological behavior in the whole of 278 grid cells or drainag
Grouped Response Unit (GRU) and twelve land use CLASS types (Figure 2). A
basin to simulate them together. Each GRU grid is represented by distinct tiles (landusGRU-based
approach combines regions of similar hydrological behavior in the whole drainage basin
type) based on input from a Digital Elevation Model (DEM) from the Canadian Digit
to simulate them together. Each GRU grid is represented by distinct tiles (landuse type)
Elevation Data from
based on input (CDED) at aElevation
a Digital scale of Model
30 m (1:50,000)
(DEM) from(Figure 1a). The
the Canadian 30-metre
Digital land cov
Elevation
data
Data (CDED) at a scale of 30 m (1:50,000) (Figure 1a). The 30-metre land cover data and th
(Figure 1b) from the Canada Center for Remote Sensing (CCRS, 2015)
shapefiles
(Figure 1b)offrom
the the
catchment and rivers
Canada Center are available
for Remote from the
Sensing (CCRS, National
2015) and theHydro Network—
shapefiles
of the catchmentSeries.
NHN—GeoBase and rivers are available from the National Hydro Network—NHN—
GeoBase Series.
Figure 2. Twelve land use CLASS types and their fraction in each grid, used in the MESH Model of
Figure
NSRB2. Twelve
above land use
Edmonton, AB,CLASS
Canada.types and their fraction in each grid, used in the MESH Model
NSRB above Edmonton, AB, Canada.
2.3. Hydrological Data
The Edmonton
2.3. Hydrological Datahydrometric station (05DF001) recorded natural flows of the NSR
before 1962. Construction of the Brazeau and Bighorn Dams was completed in 1963 and
The
1972, Edmonton
respectively. hydrometric
These station
hydroelectric (05DF001)
facilities shift therecorded natural flows
seasonal distribution of the NSR b
of stream
fore 1962. Construction
discharge, of the
but have a negligible Brazeau
influence and Bighorn
on annual and peakDamsflows atwas completed
Edmonton. in 1963 an
The River
1972,
Forecast Centre of Alberta Environment and Parks computed natural flows at the reservoirof stream
respectively. These hydroelectric facilities shift the seasonal distribution
sites and, by
discharge, butrouting
have this runoff to Edmonton,
a negligible influenceproduced
on annual a record
and of naturalized
peak flows at river flow.
Edmonton. Th
The daily naturalized streamflow record for the NSR at Edmonton
River Forecast Centre of Alberta Environment and Parks computed natural flows at th from 1912–2010 was
used in the calibration of the hydrological model and validation of model output.
reservoir sites and, by routing this runoff to Edmonton, produced a record of naturalize
In Figure 3, water year hydrographs are plotted for three time periods. This compar-
river
isonflow. The daily
of historical naturalized
natural streamflow
flows of the record for
NSR at Edmonton showsthe aNSR at Edmonton
decrease in the warm from 1912
2010 was(May–September)
season used in the calibration of the
in the past hydrological
30 years model
and increased andinvalidation
flows of model ou
the cold season
put.
(October–April). The total annual flow increased by 3.46% for the period 1950–1979 and de-
creased by 5.29%
In Figure for the period
3, water 1980–2009 compared
year hydrographs to a baseline
are plotted period
for three of 1912–1941.
time The compa
periods. This
recent changes in total annual flows reflect increased temperature and decreased
ison of historical natural flows of the NSR at Edmonton shows a decrease in the warm snowpack.
season (May–September) in the past 30 years and increased flows in the cold season (O
tober–April). The total annual flow increased by 3.46% for the period 1950–1979 and d
creased by 5.29% for the period 1980–2009 compared to a baseline period of 1912–194
The recent changes in total annual flows reflect increased temperature and decrease
snowpack.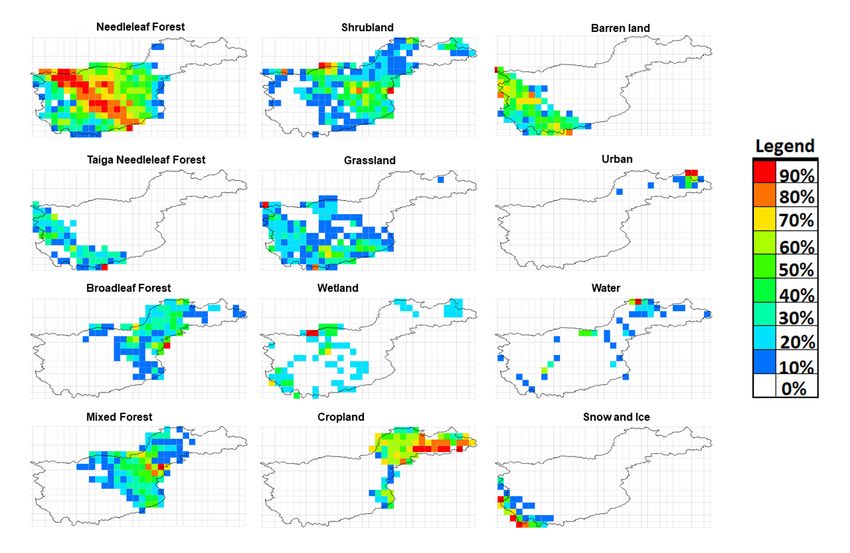
Water 2021, 13, x FOR PEER REVIEW 5 of 19
Water2021,
Water 13,x 2425
2021,13, FOR PEER REVIEW 5 of
5 of 1918
Figure 3. Comparison of median of 30-year daily natural streamflow for the NSR at Edmonton, AB,
Canada for three time of
Comparison periods.
median
Figure 3.3.
Figure Comparison of median ofof 30-year
30-year daily
daily natural
natural streamflow
streamflow forfor the
the NSR
NSR atat Edmonton,
Edmonton, AB,
AB,
Canada for three time periods.
Canada for three time periods.
Detection and attribution of climate cycles are necessary to distinguish natural cli-
mate Detection
variability
Detection and
and attribution
from trends of
attribution of climate by
imposed
climate cycles are
global
cycles arenecessary
climate
necessary totodistinguish
change. natural
The wavelet
distinguish climate
transfor-
natural cli-
variability
mation from
[29] of trends
time imposed
series assignsby global
power climate
to the change. The
spectrum of wavelet transformation
frequencies across the [29]
time
mate variability from trends imposed by global climate change. The wavelet transfor-
of time
domain. series assigns power to the spectrum of frequencies across the time domain. Figure 4
mation [29]Figure 4 isseries
of time a continuous wavelet
assigns power to plot for NSR natural
the spectrum streamflow
of frequencies at Edmonton
across the time
is a continuous
from 1911–2010. wavelet
The plot for
power at high NSR natural
frequencies streamflow at Edmonton from 1911–2010.
domain. Figure 4 is a continuous wavelet plot for(2–4
NSR years) demonstrates
natural streamflowthe at strong
Edmonton effect
The power at high frequencies (2–4 years) demonstrates theThere
strong effectanofindication
the El Niño
from 1911–2010. The power at high frequencies (2–4 years) demonstrates the strong effectof
of the El Niño Southern Oscillation (ENSO) in this region. is also
Southernvariability
Oscillation(8–32
(ENSO) in this region. There is also anfrequency
indication of of decadal variability
ofdecadal
the El Niño Southern years),
Oscillationwhich corresponds
(ENSO) to the
in this region. There is alsothe anPacific Decadal
indication of
(8–32 years),(PDO).
Oscillation which corresponds to the frequency of the Pacific Decadal Oscillation (PDO).
decadal variability (8–32 years), which corresponds to the frequency of the Pacific Decadal
Oscillation (PDO).
4. Continuous
Figure 4. Continuous wavelet
wavelet plot for NSR natural streamflow at Edmonton,
Edmonton, AB,
AB, Canada
Canada from
from
1950–2010.
1950–2010.
Figure 4. Continuous wavelet plot for NSR natural streamflow at Edmonton, AB, Canada from
1950–2010.
2.4. Forcing Data
2.4. Forcing Data
2.4.1.
2.4.1. Historical
Historical Climate Data
2.4. Forcing Data Climate Data
The
The MESH
MESH hydrological
hydrological model was forced with the historical (1979–2016) gridded
2.4.1. Historical Climate Data model was forced with the historical (1979–2016) gridded
meteorological
meteorological data of bias-corrected
data of ◦bias-corrected WFDEI-GEM-CaPA
WFDEI-GEM-CaPA with
with spatiotemporal
spatiotemporal resolution
resolution
The MESH hydrological
of three-hourly × 0.125 (−10model was
km) [30,31]. forced with thearea
The drainage historical (1979–2016)
of the NSR gridded
at Edmonton was
of three-hourly
meteorological ×
data0.125°
of (−10 km)
bias-corrected [30,31]. The
WFDEI-GEM-CaPAdrainage area
withof the NSR at
spatiotemporal Edmonton was
resolution
masked out for seven forcing variables (incoming shortwave radiation, incoming longwave
masked
ofradiation, out
three-hourly for seven
× 0.125° (−10 forcing variables (incoming shortwave radiation, incoming
precipitation rate,km) [30,31]. The drainage
air temperature, areabarometric
wind speed, of the NSR at Edmonton
pressure, was
and specific
longwave
masked radiation,
outrequired
for seven precipitation
forcing rate,
variablesair temperature,
(incoming wind speed,
shortwave barometric pressure,
radiation, incoming
humidity) to run the MESH Land Surface hydrological model.
and specific
longwave humidity) required rate,
to run the MESH Land Surface hydrological model.
The radiation, precipitation
WFDEI-GEM-CaPA data setair is temperature,
a combination wind speed,
of the barometric
forcing variablespressure,
from the
and The
specificWFDEI-GEM-CaPA
humidity) required data
to set
run is
the a combination
MESH Land of the
Surface forcing variables
hydrological model.from the
Global Environmental Multiscale (GEM) atmospheric model, the Canadian Precipitation
Global Environmental
The WFDEI-GEM-CaPA Multiscale (GEM) atmospheric model, the Canadian Precipitation
Analysis (CaPA) and the EUdata WATCHset is ERA-Interim
a combination of the forcing
reanalysis variables
(WFDEI). from the
A multivariate
Analysis
Global (CaPA) andMultiscale
Environmental the EU WATCH (GEM) ERA-Interim
atmospheric reanalysis
model, the (WFDEI).
Canadian A multivariate
Precipitation
generalization of the quantile mapping methodology (MBCn, [32]) was performed to bias-
Analysis (CaPA) and the EU WATCH ERA-Interim reanalysis (WFDEI). A multivariate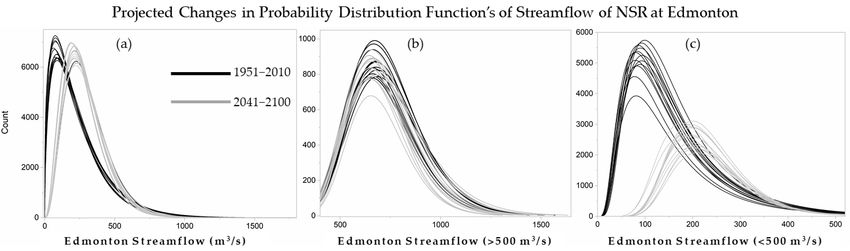
Water 2021, 13, 2425                                                                                              6 of 18

                       correct the WFDEI against GEM-CaPA at 3 h × 0.125◦ resolution during the overlapping
                       period (2005–2016), and hindcasting was performed back to 1979 for the final WFDEI-GEM-
                       CaPA product.

                       2.4.2. Future Climate Data
                            This study used an ensemble of 15 initial condition simulations from the CanRCM4
                       under the RCP 8.5 high emission scenario [33]. The three-hourly 15-member ensemble of
                       medium resolution (0.44◦ ) extends from 1950 to 2100. It was bias-corrected using historical
                       gridded meteorological data WFDEI-GEM-CaPA as described in [30] (2020). The resulting
                       bias-corrected dataset at resolutions of 3-h and 0.125◦ is a consistent set of intra-model
                       climate projections suitable for large-scale uncertainty modeling and constructing future
                       climate scenarios.

                       3. Methods of Statistical Analysis and MESH Model Optimization
                       3.1. Statistical Analysis
                             The non-parametric Mann-Kendall (MK) test and Sen’s slope estimator were used to
                       detect trends in the climate forcing data (Tmax, Tmin, and Pr) as well as in runoff. The MK
                       statistic (S), normalized test statistics (Z), and measure of the probability (p-value), were
                       calculated for each climate forcing data. A small absolute value of S indicates no trend.
                       A large positive/negative S value indicates an upward/downward trend; however, the
                       associated probability (p-value) is necessary to statistically quantify the significance of the
                       trend. For each variable, the Sen’s slope estimator finds all possible linear slopes, ranks
                       the slope estimates, and gives the median and its 95% confidence interval. Furthermore,
                       for the evaluation of “Goodness-of-Fit” measures in the observed and simulated flows,
                       the Nash–Sutcliff Efficiency (NSE), natural log of NSE (lnNSE), percentage error (PERR),
                       percentage of model bias (PBIAS), coefficient of determination (R2 ) and root mean square
                       error to standard deviation ratio (RSR) were calculated for model assessment.

                       3.2. MESH Model Optimization
                            Most of the MESH model parameters are taken from CLASS technical documenta-
                       tion [23] and literature review [25,34,35]. The sensitive parameters used in this study are
                       adopted from the analysis conducted by [35]. The MESH model was coupled with the
                       OSTRICH optimization and parameter estimation toolkit [36] for Multi-Objective optimiza-
                       tion using the PADDS (Pareto Archived Dynamically Dimensioned Search) algorithm. The
                       objective function consists of weighted values of Nash–Sutcliffe efficiency (NSE) for peak
                       flows, natural log of Nash–Sutcliffe efficiency (lnNSE) for low flows and percentage of bias
                       (PBIAS) for volume correction. Four types of parameters were calibrated: vegetation, soil,
                       hydraulics, and hydrology properties (Table 1). The simulation with the lowest objective
                       function value of 0.014 was used for validation and the projection of future flows.

                       Table 1. Parameters used in the calibration process for each CLASS type and hydrology using
                       OSTRICH optimization toolkit.

                         Parameters Type       Variable            Description          Lower Limit    Upper Limit
                                                             Natural logarithm of the
                                                LNZ0                                        −3.0           0.90
                                                                roughness length
                                                              Annual maximum leaf
                                                LAMX                                         3.0            6.0
                                                                   area index
                            Vegetation                       Average visible albedo
                                                ALVC                                        0.04            0.2
                            Parameters                          when fully leafed
                                                               Minimum stomatal
                                                RSMN                                         60             110
                                                                   resistance
                                                               Annual maximum
                                                CMAS                                         2.0           10.0
                                                                  canopy mass
Water 2021, 13, 2425 7 of 18
Table 1. Cont.
Parameters Type Variable Description Lower Limit Upper Limit
Annual maximum
ROOT 0.2 4.0
root depth
Reference value of
QA50 10.0 50.0
shortwave radiation
Vapor pressure deficit
VPDA 0.2 0.8
coefficient “A”
Vapor pressure deficit
VPDB 0.7 1.3
coefficient “B”
MANN Manning’s ‘n’ 0.02 2.0
SDEP Depth of the soil column 0.1 4.1
Soil Hydraulic DDEN Drainage density 2.0 100.0
Parameters Saturated surface
KSAT 0.001 0.01
soil conductivity
Percent content of clay in
CLAY 10.0 50.0
Soil Texture the mineral soil
Parameters Percent content of sand in
SAND 10.0 50.0
the mineral soil
R2N Channel Manning 0.02 0.5
R1N Overbank Manning 0.02 0.5
Hydrology Baseflow exponent of
Parameters PWR 0.6 3.0
lower zone function
Baseflow lower
FLZ 6.0 × 10⁻⁶ 6.0 × 10⁻³
zone function
4. Results
4.1. Climate Projections
A detailed explanation of changes in temperature and precipitation and their extremes
is necessary to understand the ongoing future impact of climate change on NSRB and its
consequences for changes of dynamics of hydrology and shifts in the snowmelt period.
4.1.1. Projected Changes in Near/Far Future Climates
From the ensemble of 15 initial-condition CanRCM4 (RCP 8.5) simulations of the
climate of the NSRB above Edmonton, we computed the mean annual and seasonal
differences in temperature and precipitation between the baseline period (1980–2010)
and near (2021–2050) and far future (2051–2080). Figure 5 shows the mean annual and
seasonal climate changes. There is an increase in mean annual temperature of around 2 ◦ C
in the near future and 4 ◦ C in the far future. The intra-model variability in precipitation is
higher in the far future (20.5%) compared to the near future (11.8%). The largest increases
in minimum temperatures, exceeding 6 ◦ C in the far future, occur in winter. The rise in
maximum temperatures is largest in summer. Precipitation is increasing in all seasons
except summer; when there are both drier and wetter ensemble projections. There is much
less intra-model variability in precipitation in summer than in the other three seasons.
Table 2 is a summary of the annual and seasonal changes in minimum temperature,
maximum temperature, and precipitation for the mean of the 15-ensemble initial condition
simulations from CanRCM4 (RCP 8.5) for the near and far future for the NSRB above
Edmonton. The ensemble means show that the winter minimum temperature and summer
maximum temperature are increasing at a much higher rate compared to the other seasons.
Similarly, an increase in the ensemble mean precipitation is higher in spring and fall
compared to the summer and winter.Water 2021, 13, 2425 8 of 18
Water 2021, 13, x FOR PEER REVIEW 8 of 19
Figure
Figure5. 5.
Mean and
Mean andseasonal changes
seasonal in temperature
changes andand
in temperature precipitation change
precipitation fromfrom
change the ensemble
the ensemble
of 15 initial condition simulations from CanRCM4 and the RCP8.5 scenario for the NSRB above
of 15 initial condition simulations from CanRCM4 and the RCP8.5 scenario for the NSRB above
Edmonton, AB, Canada.
Edmonton, AB, Canada.
Table 2 is a summary of the annual and seasonal changes in minimum temperature,
Table 2. Summary of annual and seasonal changes in minimum temperature (Tmin), maximum
maximum temperature, and precipitation for the mean of the 15-ensemble initial
temperature (Tmax), and precipitation (Precp) for the mean of the 15-member ensemble of initial-
condition simulations from CanRCM4 (RCP 8.5) for the near and far future for the NSRB
condition simulations from CanRCM4 (RCP8.5) scenario for near and far future for the NSRB above
above Edmonton. The ensemble means show that the winter minimum temperature and
Edmonton. The largest climate changes are highlighted in bold.
summer maximum temperature are increasing at a much higher rate compared to the
other seasons. Similarly, an increase in the ensemble mean precipitation
Near Future FarisFuture
higher in spring
and fall compared to the summer and winter.
(1981–2010)-(2021–2050) (1981–2010)-(2051–2080)
Tmin Tmax Precp (%) Tmin Tmax Precp (%)
Table 2. Summary of annual and seasonal changes in minimum temperature (Tmin), maximum
Annual (Tmax), and
temperature 2.28 precipitation
1.99(Precp) for11.85 4.45
the mean of the 3.95
15-member ensemble 20.50
of initial-
Winter
condition simulations2.72
from CanRCM4 2.08 14.38 for near and
(RCP8.5) scenario 3.92the NSRB above
5.17 far future for 26.92
SpringThe largest
Edmonton. 1.66 1.26are highlighted
climate changes 21.90 in bold. 3.41 2.74 43.32
Summer 2.63 2.78 2.59 5.09 5.44 0.62
Fall 2.12 Near Future1.83 18.89 4.15 Far Future 3.72 33.13
(1981–2010)-(2021–2050) (1981–2010)-(2051–2080)
4.1.2. Projected Changes in Annual and Seasonal Precipitation Tmax
Tmin Tmax Precp (%) Tmin Precp (%)
Annual 2.28 of seasonal
A time series 1.99 and annual
11.85 precipitation
4.45 (1951–2100)
3.95 20.50 by the
produced
Winter CanRCM4
15-member 2.72 ensemble
2.08 (RCP14.388.5) in Figure 65.17
shows that 3.92 26.92variability
the intra-model
Spring over time
increases 1.66toward1.26 21.90
the end of the 3.41 a rising2.74
century around linear trend43.32
and ensemble
median.
SummerSeasonal 2.63time series
2.78 indicate2.59
that spring has the highest
5.09 5.44increasing0.62
trend as the
wettest
Fall months shift
2.12 to earlier
1.83 in the year.
18.89 Summer has
4.15 a decreasing
3.72 trend
33.13 highest
and
intra-model variability with a large range between wet and dry years.
4.1.2. Projected Changes in Annual and Seasonal Precipitation
A time series of seasonal and annual precipitation (1951–2100) produced by the 15-
member CanRCM4 ensemble (RCP 8.5) in Figure 6 shows that the intra-model variability
increases over time toward the end of the century around a rising linear trend andWater 2021, 13, x FOR PEER REVIEW 9 of 1
Water 2021, 13, 2425
ensemble median. Seasonal time series indicate that spring has the highest increasin
9 of 18
trend as the wettest months shift to earlier in the year. Summer has a decreasing trend an
highest intra-model variability with a large range between wet and dry years.
Figure6.6. Times
Figure Timesseries
series(1951–2100)
(1951–2100)
of of seasonal
seasonal (a–d)
(a–d) andand
totaltotal annual
annual (e) precipitation
(e) precipitation for thefor the 15
member CanRCM4
15-member CanRCM4 ensemble (RCP8.5).
ensemble (RCP 8.5).The
Theensemble
ensemble median
median (black)
(black) and and linear
linear trendtrend
(red) (red) ar
shown.
are shown.
Table 3 gives the results of the non-parametric Mann-Kendall (MK) test and Sen’
slope estimator for annual and seasonal precipitation and maximum and minimumWater 2021, 13, 2425 10 of 18
Table 3 gives the results of the non-parametric Mann-Kendall (MK) test and Sen’s slope
estimator for annual and seasonal precipitation and maximum and minimum temperature
averaged for the 15-member ensemble of bias-corrected data from CanRCM4 (RCP8.5) for
the period 1951–2100. The MK test reveals the trend and Sen’s slope estimates the trend
magnitude with a significance level of 0.05. Summer precipitation shows no trend and fall
minimum temperature has a decreasing trend. Otherwise, there is an increasing trend in
all temperature and precipitation variables.
Table 3. The results of a non-parametric Mann-Kendall (MK) test and Sen’s slope estimator for average annual and seasonal
precipitation, and maximum and minimum temperature for a 15-member ensemble of bias-corrected data from CanRCM4
(RCP8.5) from 1951–2100.
Normalized
MK Trend MK
Test p-Value Sen’s Slope 95% Confidence Interval
Test Statistic
Statistic
(S) (Z) Min Max
Annual Increasing 7163 11.64 2.20 × 10⁻¹⁶ 1.3421 1.2061 1.4730
Winter Increasing 6595 10.72 2.20 × 10⁻¹⁶ 0.2510 0.2161 0.2870
Precp Spring Increasing 7837 12.73 2.20 × 10⁻¹⁶ 0.6177 0.5586 0.6708
Summer No trend −25 −0.04 0.9689 −0.0026 −0.0997 0.1016
Fall Increasing 7317 11.89 2.20 × 10⁻¹⁶ 0.4030 0.3600 0.4491
Annual Increasing 269,116 10.57 2.20 × 10⁻¹⁶ 0.0042 0.0036 0.0049
Winter Increasing 917 3.19 0.0014 0.0164 0.0066 0.0282
Tmax Spring Increasing 425 1.48 0.1395 0.0118 −0.0030 0.0321
Summer Increasing 1065 3.71 0.0002 0.0221 0.0121 0.0315
Fall Increasing 351 1.22 0.2225 0.0117 −0.0105 0.0294
Annual Increasing 304,433 11.95 2.00 × 10⁻¹⁷ 0.0049 0.0042 0.0055
Winter Increasing 101 0.35 0.7274 0.0021 −0.0094 0.0127
Tmin Spring Increasing 593 2.06 0.0391 0.0146 0.0005 0.0339
Summer Increasing 1175 4.09 4.28 × 10⁻⁵ 0.0197 0.0110 0.0290
Fall Decreasing −152 −0.53 0.5987 −0.0035 −0.0222 0.0105
4.1.3. Projected Changes in Extreme Temperature and Precipitation
Changes in extreme temperature and precipitation are evident in the probability
distribution functions (PDFs) in Figure 7. The PDFs are plotted for daily precipitation and
maximum/minimum and mean temperature and for summer and winter for contrasting
60-year baseline (1951–2010) and future (2041–2100) periods. The bias-corrected CanRCM4
(RCP 8.5) data was fitted with a normal distribution. The PDF of daily precipitation shows
wetter conditions in future with higher intensity rainfalls. There is a clear shift in the PDFs
towards higher future mean temperatures; however, a shift in the tails of the distributions
differs between seasons, with increased minimum temperatures in winter and higher
maximum temperatures in summer.
4.2. MESH Modeling and Future Flows of NSRB at Edmonton
The optimized parameter values from OSTRICH were used to calibrate the MESH
model using 3-hourly × 0.125◦ (−10 km) observed historical gridded meteorological data
for the period February 1995 to December 2002. The same forcing data were used to
validate the model at daily intervals from Januaray 2003 to December 2010. The calibrated
MESH model was then used to simulate future flows of the NSR at Edmonton from 1951
to 2100 using 3-hourly × 0.125◦ (−10 km) bias-corrected forcing data from a 15-member
ensemble of CanRCM4 (RCP8.5).Water 2021, 13, 2425 11 of 18
Water 2021, 13, x FOR PEER REVIEW 11 of 19
Figure
Figure7. The PDFs
7. The PDFsofofthe
thedaily
daily precipitation
precipitation (a) (a)
andand minimum/maximum
minimum/maximum temperature
temperature per dayper
andday
for the summer/winter seasons (b–g) for contrasting 60-year baseline (1951–2010) and
and for the summer/winter seasons (b–g) for contrasting 60-year baseline (1951–2010) and futurefuture (2041–
2100) periods.
(2041–2100) The bias-corrected
periods. CanRCM4
The bias-corrected CanRCM4(RCP(RCP
8.5) data werewere
8.5) data fittedfitted
withwith
a normal distribution.
a normal distribution.for the period February 1995 to December 2002. The same forcing data were used to
validate the model at daily intervals from Januaray 2003 to December 2010. The calibrated
MESH model was then used to simulate future flows of the NSR at Edmonton from 1951
to 2100 using 3-hourly × 0.125° (−10 KM) bias-corrected forcing data from a 15-member
Water 2021, 13, 2425 ensemble of CanRCM4 (RCP8.5). 12 of 18
4.2.1. Calibration and Validation of the MESH Model
The MESH hydrological model was calibrated and validated on naturalized
4.2.1. Calibration
streamflow and Validation
at Edmonton using theofbias-corrected
the MESH Model WFDEI-GEM-CaPA historical gridded
forcingThedata.
MESH hydrological
Figure 8 is a plotmodel was calibrated
of observed and validated
and simulated on naturalized
daily flow of the NSRstream-
at
flow at Edmonton
Edmonton using the
for calibration andbias-corrected WFDEI-GEM-CaPA
validation periods. historical
Table 4 gives statistics for gridded
goodnessforcing
of
data.
fit. TheFigure 8 is a plot
calibration of observed and
Nash–Sutcliffe simulated
efficiency (NSE)daily
of flow
0.69 of the NSRgood
indicates at Edmonton
agreementfor cal-
ibration
between and validation
modeled periods.flows.
and observed Table The
4 gives statistics
overall for goodness
performance of fit.
of model The calibration
dynamics and
the seasonal variability
Nash–Sutcliffe efficiencyin(NSE)
river of flow
0.69isindicates
capturedgood
wellagreement
by the MESH model
between with a and
modeled
percentageflows.
observed bias ofThe
7.04, indicating
overall a strong relationship
performance between and
of model dynamics simulated and observed
the seasonal variability
flows. MESH provides a close fit to the observed flows for the calibration period
in river flow is captured well by the MESH model with a percentage bias of 7.04, indicating (February
a1995–December
strong relationship2002),between
while for the independent
simulated validation
and observed flows.period
MESH(Januaray
provides a2003–
close fit
December 2010) the performance of the MESH model
to the observed flows for the calibration period (February 1995–Decemberis reduced. The reduction
2002), is,
while
however,
for limited andvalidation
the independent the modelperiod
is able(Januaray
to maintain a very good 2010)
2003–December representation of the of
the performance
overall
the MESH water balance
model and the inter-annual
is reduced. The reduction andis,
seasonal
however,dynamics.
limited and the model is able to
maintain a very good representation of the overall water balance and the inter-annual and
seasonal dynamics.
Figure 8.
Figure 8. Comparison
Comparisonofofobserved
observedand
andsimulated
simulateddaily runoff
daily of NSR
runoff at Edmonton
of NSR at Edmontonfor calibration
for calibration
(February 1995–December 2002) and validation (Januaray 2003–December 2010) periods.
(February 1995–December 2002) and validation (Januaray 2003–December 2010) periods.
Table 4. Goodness of fit results for the calibration and validation of the MESH modeling of the flow
of the NSR at Edmonton.
Calibration Validation
Goodness-of-Fit
(February 1995–December 2002) (Januaray 2003–December 2010)
Nash–Sutcliffe efficiency (NSE) 0.69 0.67
Log of Nash–Sutcliffe efficiency
0.50 0.32
(lnNSE)
Percent error (PERR) 4.11 −2.25
Percent model bias (PBIAS) 4.11 2.25
Coefficient of determination (R2) 0.72 0.68
RMSE-to-SD Ratio (RSR) 0.56 0.59
4.2.2. Projected Changes in Streamflow
The future flows of the NSR at Edmonton were simulated using bias-corrected data
from 15 runs of the Canadian Regional Climate Model (CanRCM4) under the RCP 8.5
emission scenario ([30,33]). Figure 9a is a plot of MESH simulated mean annual runoff at
Edmonton from 1951–2100. This ensemble of time series exhibits large variability around
an upward trending ensemble mean, with an increasing range between high and low flows
toward the end of the 21st century. These results are based on the future climate from the
CanRCM4 dynamical downscaling of the Canadian Earth System Model (CanESM2). TheWater 2021, 13, 2425 13 of 18
use of a single pairing of ESM/RCM and one RCP enables us to control for uncertainty due
to the use of different models and greenhouse gas emission scenarios. Thus, differences
Water 2021, 13, x FOR PEER REVIEW 14 of 19
among streamflow projections represent uncertainty related to the natural variability of the
regional hydroclimate in a warming climate.
Figure 9. (a) MESH simulated mean annual runoff of the NSR at Edmonton from 1951–2100.
Figure 9. (a) MESH simulated mean annual runoff of the NSR at Edmonton from 1951–2100. (b)
(b) Comparison
Comparison of median
of median 60-year
60-year dailydaily
NSR NSR
flow flow at Edmonton
at Edmonton for baseline
for baseline (1951–2010)
(1951–2010) and future
and future
(2041–2100) periods.These
(2041–2100) periods. These hydrographs
hydrographs were
were generated
generated using
using the MESH
the MESH hydrological
hydrological modelmodel
run run
with the
with the 15-member
15-memberensemble
ensembleofof
bias-corrected CanRCM4
bias-corrected CanRCM4 forcing datadata
forcing (RCP8.5).
(RCP8.5).
TableFigure
5. Summary
9b is of annual
a plot ofand
theseasonal
annualchanges in median
water-year runoff simulated
hydrograph for the by MESH using
baseline a
(1951–2010)
15-member ensemble of bias-corrected forcing data from CanRCM4 (RCP8.5) for
and future (2041–2100) periods derived from the MESH model run. It shows a shift inbase period (1951–
2010) and future period (2041–2100).
annual peak flows occurring approximately one-month earlier in the year, with higher
winter flows and lower summer flows. The minor
Base Period Futurepeak in late April to early May in the
Period
RUNOFF % Change
historical hydrograph is not(1951−2010)
apparent in the future
(2041−2100) This suggests that at lower
flows.
elevations, the landscape no longer
Annual 927.79contributes significant
1104.55 runoff in a warmer
19.05 climate. A
shoulderWinter
of sustained flow in September
11.69 in the historical
57.07 hydrograph 388.21
also disappears, as
future river flow steeply declines
Spring in summer. Table443.49
164.52 5 shows the summary 169.57of annual and
seasonalSummer
changes in median runoff.
619.27 There is an increase
469.05 of 19% annual average runoff
−24.26
for the future
Fall period (2041–2100) compared to the134.94
132.31 baseline period (1951–2010)
1.98 given an
increase in future precipitation. Similarly, runoff is increased in every season except inWater 2021, 13, 2425 14 of 18
summer. There is a dominant increase in winter and spring runoff due to more precipitation
and early snowmelt.
Table 5. Summary of annual and seasonal changes in median runoff simulated by MESH using
a 15-member ensemble of bias-corrected forcing data from CanRCM4 (RCP8.5) for base period
(1951–2010) and future period (2041–2100).
RUNOFF Base Period (1951−2010) Future Period (2041−2100) % Change
Annual 927.79 1104.55 19.05
Winter 11.69 57.07 388.21
Spring 164.52 443.49 169.57
Summer 619.27 469.05 −24.26
Fall 132.31 134.94 1.98
Table 6 gives the results of a non-parametric Mann-Kendall (MK) test and Sen’s slope
estimator for median annual and seasonal runoff simulated by MESH using the 15-member
ensemble of forcing data from CanRCM4 (RCP 8.5) from 1951–2100. There is an increasing
trend in annual runoff; however, the seasonal runoff is increasing in winter and spring, but
decreases in summer and fall.
Table 6. The results of a non-parametric Mann-Kendall (MK) test and Sen’s slope estimator for median annual and seasonal
runoff simulated by MESH using a 15-member ensemble of bias-corrected forcing data from CanRCM4 (RCP 8.5) from
1951−2100.
Normalized
MK Trend MK
RUNOFF Test p-Value Sen’s Slope 95% Confidence Interval
Test Statistic
Statistic
(S) (Z) Min Max
Annual Increasing 4585 7.45 9.41 × 10⁻¹⁴ 0.4277 0.3256 0.5277
Winter Increasing 9339 15.17 2.20 × 10⁻¹⁶ 0.4087 0.3586 0.4639
Spring Increasing 8801 14.30 2.20 × 10⁻¹⁶ 2.9701 2.7070 3.2243
Summer Decreasing −6709 −10.90 2.20 × 10⁻¹⁶ −1.8512 −2.0956 −1.6151
Fall Decreasing −585 −0.95 0.3426 −0.0478 −0.1386 0.0479
4.2.3. Projected Changes in Extreme Streamflow
The ensemble of probability distributions derived from 15 runs of MESH is plotted
for the baseline (1951–2010) and future (2041–2100) periods. In Figure 10, the frequency of
daily mean and high/low flows are shown by fitting a normal distribution to histograms of
the daily mean and extreme flows of the NSR at Edmonton. A shift in probability toward
higher flows (Figure 10a) reflects the projected climate changes, and specifically wetter
conditions in winter and spring. The right tail of the distribution of future daily flows is
extended. This higher probability of extreme flows is depicted in Figure 10b, where the
frequency of flows exceeding 500 m3 /s is plotted. The extreme flow PDFs have longer tails
in the future period, indicating a much higher probability of flood events. The PDF of flows
(toward higher flows (Figure 10a) reflects the projected climate changes, and specifically
wetter conditions in winter and spring. The right tail of the distribution of future daily
flows is extended. This higher probability of extreme flows is depicted in Figure 10b,
where the frequency of flows exceeding 500 m3/s is plotted. The extreme flow PDFs have
Water 2021, 13, 2425 longer tails in the future period, indicating a much higher probability of flood events. The
15 of 18
PDF of flows (Water 2021, 13, 2425 16 of 18
and fall, and an increased frequency in spring. Whereas historically rainfall runoff com-
bined with the summer melting of snow and glacier ice produced high flows, earlier peak
runoff and lower summer river levels will favor springtime maximum annual flows.
5. Discussion
Our modeling and analysis of the future climate and hydrology of the North Saskatchewan
River Basin (NSRB) gave results that have important implications for the availability,
management, and use of surface water in the Edmonton metropolitan area. Most of the
recent climate change in this region has been an increase in the lowest temperatures;
minimum daily winter temperatures have increased by about 6 ◦ C. There is no significant
trend in the instrumental record of precipitation. Fluctuations in precipitation over the
past 120 years are dominated by large differences between years and decades. Future
projections from climate models suggest warmer and wetter weather in winter and spring
and, on average, drier conditions in mid to late summer.
Uncertainty in hydrological ensemble projections showed unique responses to un-
certainty in the precipitation and temperature ensembles. In response to these projected
climate changes, the seasonal pattern of river flow will shift, with future river levels peak-
ing about one month earlier during May. More precipitation falling as rain rather than
snow, combined with advanced spring snow melt, will result in earlier peak streamflow.
Cold season (winter and early spring) flows will be significantly higher, and the timing of
maximum annual flows will shift from summer to spring. As a warming climate intensifies
the hydrological cycle, the range of river levels will expand, with larger departures from a
shifting baseline of higher winter flows and lower summer flows.
Lower river levels in June to August will have implications for surface water supplies
during the season of the highest demand. Data from recent decades indicate that absolute
water use and demand has increased but at a lesser rate than the increasing population
of the Edmonton region [15]. As a result, there has been a decoupling of per capita water
use from growth in the economy and population of the region. Whereas this more efficient
use of water supplies represents an important adaptation to a changing climate, other
adjustments to water policy, planning, and management will be required given the changes
in climate and water supplies projected by our study.
Changes in the severity of extreme hydrological events, and in the seasonal distri-
bution of water resources, will have major impacts on terrestrial and aquatic ecosystems,
and on the availability of municipal and industrial water supplies [37,38]. Because water
quality in the NSR is directly related to both runoff from the landscape and instream flows,
it will be affected by climate change impacts on river flows and on runoff generated by
precipitation and snowmelt. Higher concentrations of turbidity, colour, nutrients, and
algae are anticipated because of increased precipitation, a larger range of flows in the NSR,
floods, droughts, forest fires, and higher water temperatures.
6. Conclusions
Uncertainty in hydrological projections was much more intimately linked with uncer-
tainty in the ensemble projections of precipitation compared to temperature, indicating,
we must reduce uncertainty in precipitation data for improved modeling creditability.
Both incremental long-term changes in water levels, and extreme fluctuations around the
changing baseline, will have impacts requiring adaptation of water resource planning and
policy. Our use of climate forcing data from an ensemble of runs of a CanRCM4 (RCP8.5)
revealed the uncertainty in the future river hydrology that arises from the internal natural
variability in the regional hydroclimate. Water allocation and the design of storage and
conveyance structures are based mainly on average seasonal water levels, but otherwise
water resources are managed to prevent the adverse impacts of flooding and drought. The
operation, and possible structural integrity, of infrastructure for drainage, water supply,
and treatment is vulnerable to climate change. Much of the risk is due to the expectationWater 2021, 13, 2425 17 of 18
of more intense precipitation, earlier snow melts, prolonged low water levels, and more
extreme weather events.
Author Contributions: M.R.A. and D.J.S. planned this study and experiments; D.J.S. contributed
to writing the manuscript and overall supervision of the project; M.R.A. conducted the modeling
experiments, performed the analysis, and prepared the text and graphics for the manuscript; Both
authors have read and agreed to the published version of the manuscript.
Funding: The research described in this paper was funded by EPCOR Utilities Ltd. and by the Natural
Sciences and Engineering Research Council (NSERC) of Canada, grant number CRDPJ520747-17.
Institutional Review Board Statement: Not applicable.
Informed Consent Statement: Not applicable.
Data Availability Statement: The observed forcing data used in this study (WFDEI-GEM-CaPA,
1979–2016) for North America is freely available at the Federated Research Data Repository (https:
//doi.org/10.20383/101.0111). Bias-corrected CanRCM4 forcing data is freely available from the
Federated Research Data Repository (https://doi.org/10.20383/101.0230/). The MESH model
and OSTRICH are freely available from University of Saskatchewan Wiki webpage (https://wiki.
usask.ca/display/MESH/About+MESH). All the script used in this study to analyze forcing data
is also freely available at (https://wiki.usask.ca/display/MESH/Forcing+Datasets+for+MESH).
All the statistics are computed in R using trend package. All the websites are last accessed on
2 September 2021.
Acknowledgments: The authors gratefully acknowledge the support of this research funded by
EPCOR Utilities Ltd. and by the Natural Sciences and Engineering Research Council (NSERC)
of Canada.
Conflicts of Interest: The authors declare no conflict of interest.
References
1. Abbott, B.; Bishop, K.; Zarnetske, J.; Minaudo, C.; Chapin, F.; Krause, S.; Hannah, D.; Conner, L.; Ellison, D.; Godsey, S.; et al.
Human domination of the global water cycle absent from depictions and perceptions. Nat. Geosci. 2019, 12, 533–540. [CrossRef]
2. Jiménez Cisneros, B.E.; Oki, T.; Arnell, N.W.; Benito, G.; Cogley, J.G.; Döll, P.; Jiang, T.; Mwakalila, S.S. Freshwater Resources. In
Climate Change 2014: Impacts, Adaptation, and Vulnerability. Part A: Global and Sectoral Aspects. Contribution of Working Group II
to the Fifth Assessment Report of the Intergovernmental Panel on Climate Change; Field, C.B., Barros, V.R., Dokken, D.J., Mach, K.J.,
Mastrandrea, M.D., Bilir, T.E., Chatterjee, M., Ebi, K.L., Estrada, Y.O., Genova, R.C., et al., Eds.; Cambridge University Press:
Cambridge, UK, 2014; pp. 229–269.
3. Marvel, K.; Cook, B.; Bonfils, C.; Durack, P.; Smerdon, J.; Williams, A. Twentieth-century hydroclimate changes consistent with
human influence. Nature 2019, 569, 59–65. [CrossRef]
4. Bonsal, B.R.; Peters, D.L.; Seglenieks, F.; Rivera, A.; Berg, A. Changes in Freshwater Availability across Canada. Chapter 6 in Canada’s
Changing Climate Report; Bush, E., Lemmen, D.S., Eds.; Government of Canada: Ottawa, ON, Canada, 2019; pp. 261–342.
5. Mudryk, L.; Derksen, C.; Howell, S.; Laliberté, F.; Thackeray, C.; Sospedra-Alfonso, R.; Vionnet, V.; Kushner, P.; Brown, R.
Canadian snow and sea ice: Historical trends and projections. Cryosphere 2018, 12, 1157–1176. [CrossRef]
6. Burn, D.; Abdul Aziz, O.; Pietroniro, A. A Comparison of Trends in Hydrological Variables for Two Watersheds in the Mackenzie
River Basin. Can. Water Resour. J./Rev. Can. Ressour. Hydr. 2004, 29, 283–298. [CrossRef]
7. Rood, S.; Samuelson, G.; Weber, J.; Wywrot, K. Twentieth-century decline in streamflows from the hydrographic apex of North
America. J. Hydrol. 2005, 306, 215–233. [CrossRef]
8. Donahue, W.; Allen, E.; Schindler, D. Impacts of Coal-Fired Power Plants on Trace Metals and Polycyclic Aromatic Hydrocarbons
(PAHs) in Lake Sediments in Central Alberta, Canada. J. Paleolimnol. 2006, 35, 111–128. [CrossRef]
9. St-Jacques, J.; Andreichuk, Y.; Sauchyn, D.; Barrow, E. Projecting Canadian Prairie Runoff for 2041–2070 with North American
Regional Climate Change Assessment Program (NARCCAP) Data. JAWRA J. Am. Water Resour. Assoc. 2018, 54, 660–675.
[CrossRef]
10. Yip, Q.; Burn, D.; Seglenieks, F.; Pietroniro, A.; Soulis, E. Climate Impacts on Hydrological Variables in the Mackenzie River Basin.
Can. Water Resour. J./Rev. Can. Ressour. Hydr. 2012, 37, 209–230. [CrossRef]
11. Peters, D.; Atkinson, D.; Monk, W.; Tenenbaum, D.; Baird, D. A multi-scale hydroclimatic analysis of runoff generation in the
Athabasca River, western Canada. Hydrol. Process. 2013, 27, 1915–1934. [CrossRef]
12. Bawden, A.; Linton, H.; Burn, D.; Prowse, T. A spatiotemporal analysis of hydrological trends and variability in the Athabasca
River region, Canada. J. Hydrol. 2014, 509, 333–342. [CrossRef]Water 2021, 13, 2425 18 of 18
13. Sauchyn, D.; Davidson, D.; Johnston, M.; Flannigan, M.; Fletcher, A.; Isaac, K.; Kulshreshta, S.; Kowalczyk, T.; Mauro, I.; Pittman,
J.; et al. The Prairie Provinces. In Natural Resources Canada 2020, Canada in a Changing Climate: Advancing Our Knowledge for Action;
Natural Resources Canada: Ottawa, ON, Canada, 2020.
14. Golder Associates. Water Supply Assessment for the North Saskatchewan River Basin; North Saskatchewan Watershed Alliance:
Edmonton, AB, Canada, 2008.
15. Anis, M.; Andreichuk, Y.; Kerr, S.; Sauchyn, D. Climate Change Risks to Water Security in Canada’s Western Interior. In
Hydrological Aspects of Climate Change; Pandey, A., Kumar, S., Eds.; Springer Transactions in Civil and Environmental Engineering;
Springer: Singapore, 2021; pp. 25–60. ISBN 978-981-16-0394-5_2.
16. Kienzle, S.; Nemeth, M.; Byrne, J.; MacDonald, R. Simulating the hydrological impacts of climate change in the upper North
Saskatchewan River basin, Alberta, Canada. J. Hydrol. 2012, 412–413, 76–89. [CrossRef]
17. Barrow, E.; Sauchyn, D. Uncertainty in climate projections and time of emergence of climate signals in the western Canadian
Prairies. Int. J. Climatol. 2019, 39, 4358–4371. [CrossRef]
18. Sauchyn, D.; Vanstone, J.; Perez-Valdivia, C. Modes and Forcing of Hydroclimatic Variability in the Upper North Saskatchewan
River Basin Since 1063. Can. Water Resour. J./Rev. Can. Ressour. Hydr. 2011, 36, 205–217. [CrossRef]
19. Sauchyn, D.; Vanstone, J.; St. Jacques, J.; Sauchyn, R. Dendrohydrology in Canada’s western interior and applications to water
resource management. J. Hydrol. 2015, 529, 548–558. [CrossRef]
20. Sauchyn, D.; Ilich, N. Nine Hundred Years of Weekly Streamflows: Stochastic Downscaling of Ensemble Tree-Ring Reconstructions.
Water Resour. Res. 2017, 53, 9266–9283. [CrossRef]
21. Tennant, C.; Menounos, B. Glacier change of the Columbia Icefield, Canadian Rocky Mountains, 1919–2009. J. Glaciol. 2013, 59,
671–686. [CrossRef]
22. Pietroniro, A.; Fortin, V.; Kouwen, N.; Neal, C.; Turcotte, R.; Davison, B.; Verseghy, D.; Soulis, E.; Caldwell, R.; Evora, N.; et al.
Development of the MESH modelling system for hydrological ensemble forecasting of the Laurentian Great Lakes at the regional
scale. Hydrol. Earth Syst. Sci. 2007, 11, 1279–1294. [CrossRef]
23. Verseghy, D.; McFarlane, N.; Lazare, M. Class—A Canadian land surface scheme for GCMS, II. Vegetation model and coupled
runs. Int. J. Climatol. 1993, 13, 347–370. [CrossRef]
24. Verseghy, D. Class-A Canadian land surface scheme for GCMS. I. Soil model. Int. J. Climatol. 2007, 11, 111–133. [CrossRef]
25. Mekonnen, M.; Wheater, H.; Ireson, A.; Spence, C.; Davison, B.; Pietroniro, A. Towards an improved land surface scheme for
prairie landscapes. J. Hydrol. 2014, 511, 105–116. [CrossRef]
26. Soulis, E.; Snelgrove, K.; Kouwen, N.; Seglenieks, F.; Verseghy, D. Towards closing the vertical water balance in Canadian
atmospheric models: Coupling of the land surface scheme class with the distributed hydrological model watflood. Atmos.-Ocean.
2000, 38, 251–269. [CrossRef]
27. Kouwen, N.; Soulis, E.; Pietroniro, A.; Donald, J.; Harrington, R. Grouped Response Units for Distributed Hydrologic Modeling.
J. Water Resour. Plan. Manag. 1993, 119, 289–305. [CrossRef]
28. Green Kenue Reference Manual; Canadian Hydraulics Centre of the National Research Council: Ottawa, ON, Canada, 2010.
29. Torrence, C.; Compo, G. A Practical Guide to Wavelet Analysis. Bull. Am. Meteorol. Soc. 1998, 79, 61–78. [CrossRef]
30. Asong, Z.; Elshamy, M.; Princz, D.; Wheater, H.; Pomeroy, J.; Pietroniro, A.; Cannon, A. High-resolution meteorological forcing
data for hydrological modelling and climate change impact analysis in the Mackenzie River Basin. Earth Syst. Sci. Data. 2020, 12,
629–645. [CrossRef]
31. Asong, Z.; Wheater, H.; Pomeroy, J.; Pietroniro, A.; Elshamy, M. WFDEI-GEM-CaPA: A Bias-Corrected 3-hourly 0.125 Gridded
Meteorological Forcing Data Set (1979–2016) for Land Surface Modeling in North America; Federated Research Data Repository:
Saskatoon, SK, Canada, 2018.
32. Cannon, A. Multivariate quantile mapping bias correction: An N-dimensional probability density function transform for climate
model simulations of multiple variables. Clim. Dyn. 2017, 50, 31–49. [CrossRef]
33. Scinocca, J.; Kharin, V.; Jiao, Y.; Qian, M.; Lazare, M.; Solheim, L.; Flato, G.; Biner, S.; Desgagne, M.; Dugas, B. Coordinated Global
and Regional Climate Modeling. J. Clim. 2015, 29, 17–35. [CrossRef]
34. Davison, B.; Pietroniro, A.; Fortin, V.; Leconte, R.; Mamo, M.; Yau, M. What is Missing from the Prescription of Hydrology for
Land Surface Schemes? J. Hydrometeorol. 2016, 17, 2013–2039. [CrossRef]
35. Haghnegahdar, A.; Razavi, S.; Yassin, F.; Wheater, H. Multicriteria sensitivity analysis as a diagnostic tool for understanding
model behaviour and characterizing model uncertainty. Hydrol. Process. 2017, 31, 4462–4476. [CrossRef]
36. Matott, L. OSTRICH: An Optimization Software Tool, Documentation and User’s Guide; Version 17.12.19; University at Buffalo Center
for Computational Research: New York, NY, USA, 2017; 79p.
37. Fyfe, J.; Derksen, C.; Mudryk, L.; Flato, G.; Santer, B.; Swart, N.; Molotch, N.; Zhang, X.; Wan, H.; Arora, V.; et al. Large Near-Term
Projected Snowpack Loss over the Western United States. Nat. Commun. 2017, 8, 14996. [CrossRef] [PubMed]
38. Sturm, M.; Goldstein, M.; Parr, C. Water and life from snow: A trillion dollar science question. Water Resour. Res. 2017, 53,
3534–3544. [CrossRef]You can also read