Simulation of Interaction between a Spherical Shock Wave and a Layer of Granular Material in a Conical Shock Tube
←
→
Page content transcription
If your browser does not render page correctly, please read the page content below
ISSN 1990-7931, Russian Journal of Physical Chemistry B, 2021, Vol. 15, No. 4, pp. 685–690. © Pleiades Publishing, Ltd., 2021.
Russian Text © The Author(s), 2021, published in Khimicheskaya Fizika, 2021, Vol. 40, No. 8, pp. 63–69.

                                                         COMBUSTION, EXPLOSION,
                                                            AND SHOCK WAVES

             Simulation of Interaction between a Spherical Shock Wave
             and a Layer of Granular Material in a Conical Shock Tube
                S. V. Khomika, *, I. V. Gukb, A. N. Ivantsova, S. P. Medvedeva, E. K. Anderzhanova,
                             A. I. Mikhaylina, b, M. V. Silnikova, b, and A. M. Terezaa
              a Semenov      Federal Research Center for Chemical Physics, Russian Academy of Sciences, Moscow, Russia
                                             b
                                               Special Materials Corp., St. Petersburg, Russia
                                                    *e-mail: sergei.khomik@gmail.com
                                    Received February 2, 2021; revised March 15, 2021; accepted March 22, 2021

         Abstract—The overpressure and impulse of the compression phase transmitted to a rigid wall through the
         layer of dispersed material during the propagation of a spherical shock wave along it are determined in exper-
         iments using a conical shock tube. The layers of sand of different fineness and thickness are investigated by
         varying the intensity of the shock wave. The conditions under which the shock wave’s amplitude increases are
         revealed. The impulse of the compression phase of the shock wave transmitted through the bulk medium
         weakly depends on the layer thickness and the intensity of the shock wave.

         Keywords: conical shock tube, spherical shock wave, dispersed material, explosion-proof coating
         DOI: 10.1134/S1990793121040175

                   INTRODUCTION                                                         induced by the SW. A detailed review of the experi-
    The problem of the interaction of an air shock wave                                 mental and theoretical works in this area is presented
with a layer of bulk material has various aspects related                               in [4]. For modeling explosive processes, studies of the
to the fundamental laws of two-phase flows as well as                                   ignition of dust suspensions behind shock waves are
to practical issues of ensuring the explosion safety.                                   also of critical importance [5].
Historically, research activity in this area was triggered                                  However, as it turned out, the formation of a dust
by the questions of preventing and suppressing dust                                     cloud does not exhaust the picture of shock-wave
explosions [1–3]. A dust explosion (DE) in practice,                                    action in volumes partially filled with a bulk medium
as a rule, is not limited to the local act of combustion                                or containing it in the form of thin layers on bounding
of an isolated gas-dispersed system. A specific feature                                 surfaces. Similar to a porous compressible material,
of a DE is its ability to spread over long distances,                                   for example, polyurethane foam [6, 7], in the presence
involving new masses of dusty material in the explosive                                 of a bulk layer on a rigid substrate, the effect of a sig-
process. Thus, significant destruction is observed                                      nificant short-term increase of the applied shock-
during explosions in coal mines and in pneumatic                                        wave load is observed [8]. This factor should be taken
transport systems, where bulk material is not local-                                    into account when assessing the dynamic impact of
ized, but, as a rule, is distributed in the form of a layer                             dust explosions and when using bulk materials as
deposited on the walls and bottom of the channel.                                       explosion-proof coatings. The experimental data pre-
Another example of this kind is the process of spreding                                 sented in [8] and then confirmed in [9] were obtained
ignition of flour in the elevator storage area during the                               in case of a plane shock waves formed in shock tubes
propagation of a pressure wave and hot explosion                                        of a constant cross section. Meanwhile, spherical
products through the ventilation system.                                                shock waves (SSWs) with the pressure decaying
    For the considered accident scenarios, the typical                                  behind the front are of increased interest especially if
situation involves compression waves or shock waves                                     applied to the real scenarios of emergency situations.
(SWs) penetrating into a volume partially filled with a                                 Such pressure profiles are typical for explosions in the
bulk medium. Historically, experts studying DE were                                     open space of condensed explosives charges and for
interested in two aspects of the problem of the interac-                                the burst of gas-filled vessels. Some observations in [8]
tion of SWs with layers of granular substances. The                                     indicate that the shape of the pressure profile can
first aspect is related to study the structure of a shock                               affect the parameters of the shock-wave load transmit-
wave sliding along the surface of the layer; and the sec-                               ted through the bulk layer. This effect was established
ond is to study the dynamics of the rise of dust and the                                using the technique of generating a plane SW of a tri-
formation of an explosive cloud in the gas flow                                         angular (explosive) pressure profile in a shock tube

                                                                                   685
686 KHOMIK et al.
particles of 0.1 to 0.2 and 0.5 to 0.8 mm. The backup
pressure sensor was mounted on the upper generatrix
of the cone in the same cross section as a sensor cov-
2 ered by a bulk layer. Thus, in each experiment, the
pressure profiles were recorded simultaneously both
under the layer and on the wall above it. A mixture of
helium with air at different initial pressures, deter-
mined by the membrane’s rupture pressure, was used
1 as the driver gas in the HPC. The distance from the
HPC to the sensors mounting holes, located opposite
each other, is 1.144 m. Mesured there SW front over-
pressure was 0.16 to 0.75 bar depending on which kind
of membrane was used. In all experiments, the low-
pressure conical chamber was filled with air under
normal conditions.
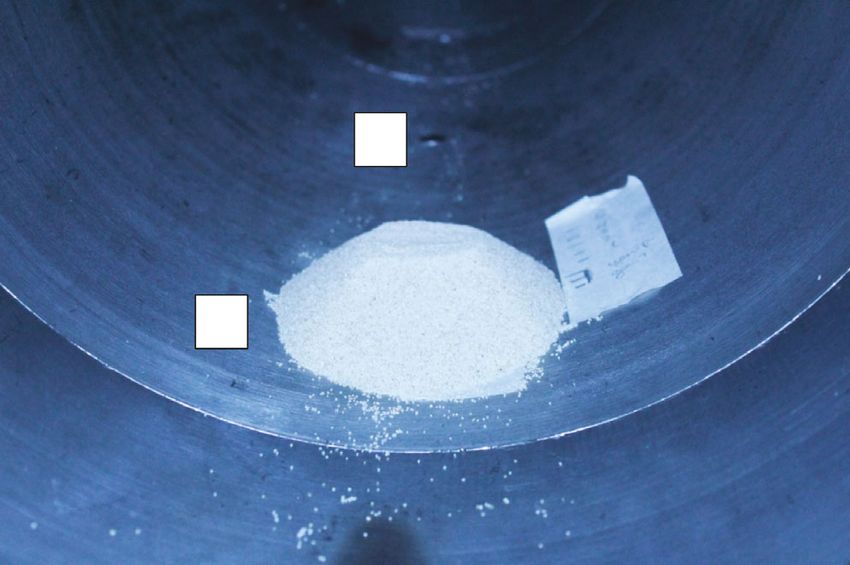
Fig. 1. Internal surface view of the CST: (1) sand layer h =
The developed method for determining the explo-
20 mm thick, dispersion 0.5–0.8 mm; (2) pressure sensor sion-proof properties of various coatings is based on
in front of the layer. the assumption that a layer of bulk or other material
placed on the pressure sensor insignificantly distorts
the flow pattern in the CST. Indeed, at the measure-
[10]. However, as shown in [11, 12], despite the possi- ment site, the cross section of the CST is about 300 mm,
bility of extending the area of application of a shock which is much greater than the maximum thickness of
tube with a constant cross section [13], it is advisable the bulk layer (30 mm). Nevertheless, in order to prove
to use conical shock tubes (CSTs) to reproduce SSWs. the applied technique, along with obtaining experi-
The work [14] demonstrates the efficiency of CSTs for mental data, it is advisable to carry out the numerical
studying the explosion-proof properties of textile simulation how a layer of bulk material influences on
coatings. the flow pattern in the CST.
The aim of this study is to reveal, by the experi-
ments in a CST, the peculiarities of the interaction of EXPERIMENTAL RESULTS AND DISCUSSION
a spherical shock wave with a layer of granular mate-
rial. Sand of various degrees of fineness was chosen as The amplitude and pressure profiles of the SSWs
the object of research. The primary attention was paid recorded on the tube’s wall under the bulk layer and
to determine the influence of the particle size on the without it have been compared based on the experi-
overpressure and the impulse of the compression ments data. An example of such a comparison demon-
phase transmitted to the protected object (rigid sub- strates Fig. 2, where the pressure versus time depen-
strate) at different intensities of the SSWs. The data dences recorded by sensors above and below the layer
obtained can be useful for the phenomenological at a layer thickness of h = 10 and 30 mm for sand of a
description of the behavior of explosion-proof coat- different dispersion are shown. The overpressure at the
ings under the action of a dynamic load and for the SSW front Δp0 = 0.23 bar. As can be seen, the pressure
validation of computational models, both already on the wall under the layer grows rather smoothly, and
proven [15–17] and recently developed [18–20]. as the layer’s thickness increases, the compression
wave profile gets wider with a simultaneous decrease
in the amplitude. At the same time, there is an
EXPERIMENTAL METHOD AND SET-UP increase in the delay between the moments of the
The experiments were carried out in the CST-14, arrival of the shock wave at the sensor in the gas and
consisting of a high-pressure chamber (HPC) and an the sensor located under the layer. This effect is clearly
open conical low-pressure chamber with the opening seen when comparing curves 2 and 3 for particles 0.1–
angle of 14° and a length of up to 3 m. The chambers 0.2 mm in size, which is due to the low velocity of
were separated by bursting membrane made of alumi- propagation of the pressure waves in a finely dispersed
num or copper foil of different rupture pressures. A bulk medium [21]. In this case, the maximum ampli-
high-pressure chamber is a cylinder 100 mm long and tude of the overpressure under the layer, Δpm, signifi-
54 mm in radius. A general view of a horizontally cantly exceeds the value of Δp0. From the records of
located CST-14 equipped with pressure sensors is the pressure profiles presented in Fig. 2, it can be seen
given in [14]. In the present experiments, one of the that an increase in the particle size to 0.5–0.8 mm
sensors mounted along the lower generatrix of the leads to a strong decrease in the maximum overpres-
cone was covered with a sand layer 10 to 30 mm thick. sure on the wall under the layer. Moreover, if a slight
The inner part of the tube with a 20-mm-thick layer of increase in the load is observed with a layer thickness
sand is shown in Fig. 1 (view from the open outlet sec- of 10 mm (Δpm ≈ 1.2Δp0), then for h = 30 mm, the
tion of the KUT-14). We used two sieve fractions: with wave intensity is less than in its absence.
RUSSIAN JOURNAL OF PHYSICAL CHEMISTRY B Vol. 15 No. 4 2021SIMULATION OF INTERACTION BETWEEN A SPHERICAL SHOCK WAVE 687
p, bar
1.6
1.5
2
1.4
1.3 4 3
1.2 5
1
1.1
1.0
0.9
0 0.2 0.4 0.6 0.8 1.0 1.2 1.4
Time, ms
Fig. 2. Pressure profiles on the wall of a CST at various parameters of the granular layer. Layer thickness: (1) 0; (2, 4) 10; (3, 5) 30 mm.
Sand particle size: (2, 3) 0.1–0.2; (4, 5) 0.5–0.8 mm.
When analyzing the obtained experimental depen- not practically possible, which is confirmed by the
dences, it is helpful to use the coefficient of the maxi- decrease in the value of δm. We note the complete
mum relative load introduced in [8]: δm = Δpm/Δp0. By qualitative and close quantitative correspondence of
analogy, we introduce the coefficient of the change in the change in the coefficient δmax for a layer of particles
the impulse of the compression phase: ηm = Im/I0, 0.5–0.8 mm in size at the intensity of a nonstationary
where Im is the impulse of the compression phase shock wave Δp0 = 0.5 bar (curve 3) and a layer of par-
under the bulk layer, and I0 is the impulse of the com- ticles 0.1–0.2 mm in size when the SSW intensity is
pression phase without a layer. Both of these impulses half as much (curve 4). Thus, both a decrease in the
were determined by calculating the area under the particle size and an increase in the intensity of the
pressure profile graph of the corresponding sensor. shock wave lead to the same result. In the same figure
Figure 3 shows the results of the experimentally deter- there are presented the data [8] for the sand of 0.1 to
mined values of δm for fine and coarse sand fractions at 0.2 mm dispersion, impacted by a plane shock wave
different SSW intensities. It can be seen from the with of stepped pressure profile of Δp0 = 1.5 bar. It is
graphs that with a layer thickness of 10 mm δm > 1 for seen that the nature of the dependence is different and
the investigated range of values Δp0, i.e., there is an the maximum is reached at h = 20–30 mm, and not at
h = 10 mm, as in the experiments in CSTs. This effect
increase in the shock-wave effect transmitted to the is a consequence of the pressure rapid drop behind the
substrate. The weakening of the SSW by the dispersed SSW front.
material takes place only in the case of a layer of coarse
sand with a thickness h = 30 mm (curve 2) at a SSW The data on the effect of dispersion, the thickness
intensity of 0.23 bar and layers with a thickness h = 20 of the bulk layer, and the unsteady shock wave inten-
and 30 mm (curve 1) at Δp0 = 0.16 bar. Parameter δm sity wave on the coefficient of the change in the
increases, as the particle size decreases. As noted in impulse of the compression phase (ηm) are presented
[8], this occurs due to the possibility of the compres- in Table 1. The table data show that for sand with a
sion of the bulk layer (getting more dense packing) in fraction of 0.1 to 0.2 mm, despite the scatter of the
the case of a free filling with finely dispersed material. experimental data, coefficient ηm in the entire range of
In case of larger particles this kind of compression is layer thickness h and the SSW intensity is greater than
RUSSIAN JOURNAL OF PHYSICAL CHEMISTRY B Vol. 15 No. 4 2021688 KHOMIK et al.
δm NUMERICAL SIMULATION RESULTS
3.0
In order to prove the applied experimental tech-
7 nique, it is necessary to evaluate how the flow pattern
in the CST changes in the presence of a bulk layer. In
2.5 [11], it was shown that the features of the flow in the
CST can be revealed by numerical simulation using
6 the GAS DYNAMICS TOOL (GDT) software pack-
2.0 age [22]. The GDT package was previously tested on
various problems of determining the flow patterns in a
5 CST [11, 12] and initiating detonation in a complex
geometric configuration [23]. The features and details
1.5 4 of the methodology for the numerical simulation of
the flow in the CST are discribed in [11]. 3D numeri-
3 cal calculations were carried out at the mesh size of
2 mm. Figure 4 shows the results of the numerical sim-
1.0 ulation of the flow pattern and pressure profile in the
2
test section. Taking into account the fact that the vol-
1 ume of sand under the impact of SW decreases insig-
0.5 nificantly [8], the localized bulk layer was set in the
0 10 20 30 h, mm 40 form of a nondeformable solid cylindrical body 60 mm
in diameter, protruding by 30 mm from the lower gen-
eratrix of the CST. The specified object is easily distin-
Fig. 3. Dependence of the maximum value of the relative guishable on the right side of the computational
load factor on the thickness of the sand layer of fractions
0.1–0.2 (curves 4–6) and 0.5–0.8 mm (1–3) at different frames shown in Fig. 4. The time on the first and sub-
intensities of SSWs: Δp0 = 0.16 (1, 4), 0.23 (2, 5), 0.5 bar (3, sequent frames, as well as on the pressure profiles, is
6); curve 7, data [8]. counted from the moment of the rupture of the virtual
membrane separating the HPC and the low-pressure
conical section. A comparison of the frames at t = 2.8
unity: ηm = 1.4–1.6. An increase in the particle size and 3.0 ms shows that, after interacting with the front
leads to a change in the nature of dependence ηm on boundary of the model cylinder, the SSW front is
the intensity of the wave and the thickness of the layer. somewhat distorted due to the formation of the
The coefficient of the change in the impulse of the attached shock-wave configurations. After passing the
compression phase for particles of the 0.5–0.8-mm cylinder, the flow pattern is restored. In the lower part
fraction becomes less than unity ηm = 0.7–0.9. Thus, of Fig. 4, the pressure profiles are shown in the
in the case of small particles, one should expect an absence of a model cylinder and in the center of the
increase in the shock-wave load transmitted through cylinder, when the SSW propagates along its surface. It
the bulk layer both in pressure and in the impulse of can be seen that the pressure profiles differ insignifi-
the compression phase. cantly. Note that the simulation of the bulk layer in the
Table 1. The dependence of the coefficient of change in the impulse of the compression phase (ηm) on dispersion, layer
thickness (h, mm), and SSW intensity
ηm, mm
Dispersion
Δp0, bar
of particles, mm
h = 10 h = 20 h = 30
0.16 1.42 1.55 1.38
0.1–0.2 0.23 1.42 1.52 1.55
0.50 1.4 1.46 1.6
0.16 0.91 0.98 0.82
0.5–0.8 0.23 0.89 0.77 0.89
0.50 0.72 0.92 0.83
RUSSIAN JOURNAL OF PHYSICAL CHEMISTRY B Vol. 15 No. 4 2021SIMULATION OF INTERACTION BETWEEN A SPHERICAL SHOCK WAVE 689
t = 2.8 ms
t = 3.0 ms
t = 3.2 ms
р, bar
1.2
1.1
1.0
0.9
3.0 3.5 4.0 4.5 5.0
Time, ms
Fig. 4. Calculated frames of the flow pattern and pressure profiles in the measuring section. The axis of symmetry for CST is
located horizontally at the top of each frame. Pressure contours through 0.02 bar. Pressure profiles: solid line, in the absence of
a model cylinder; dashed line, on the surface of the cylinder center.
form of a cylinder does not reflect the real experimen- thickness of the layer. It has been found that the max-
tal configuration with shallow boundaries of the layer imum pressure transmitted on the substrate can sig-
(see Fig. 1). Thus, the calculations were performed nificantly exceed proper SSW front pressure in the
assuming the most unfavorable conditions from the absence of a coating. With an increase in the particle
point of view of the distortion of the shock front. Tak- size and a decrease in the SSW’s intensity, this effect
ing these factors into account, it can be concluded that disappears, and the bulk coating weakens the shock-wave
the technique of the simultaneous recording of the effect. The impulse of the compression phase transmitted
pressure profile under the layer and on the wall can be through the bulk layer exceeds the initial one in the case
used to determine the value of the shock-wave load of finely dispersed materials and decreases when using
transfer coefficient both in terms of pressure and large particles.
impulse of the compression phase of the SSW.
FUNDING
CONCLUSIONS The study was supported by a grant from the Russian
Based on the experiments with the use of a CST, a Science Foundation (project no. 19-19-00554).
methodology for studying the regularities of the trans-
mission of a shock-wave load through a layer of bulk
material under SSW impact has been developed and REFERENCES
tested. The experiments have shown that the pressure 1. S. I. Taubkin and I. S. Taubkin, Fire and Explosion Hazard
and impulse transmitted through a layer of bulk mate- of Dusty Materials and Technological Processes of their Pro-
rial (sand) depend on the intensity of the SSW and the cessing (Khimiya, Moscow, 1976) [in Russian].
RUSSIAN JOURNAL OF PHYSICAL CHEMISTRY B Vol. 15 No. 4 2021690 KHOMIK et al.
2. A. Ya. Korol’chenko, Fire and Explosion Hazard of In- 13. B. E. Gelfand, A. M. Bartenev, S. P. Medvedev,
dustrial Dust (Khimiya, Moscow, 1986) [in Russian]. A. N. Polenov, S. V. Khomik, M. Lenartz, and
3. R. K. Eckhoff, Dust Explosions in the Process Industries: H. Grönig, Shock Waves 4, 137 (1994).
Identification, Assessment and Control of Dust Hazards 14. S. P. Medvedev, E. K. Anderzhanov, I. V. Guk,
(Elsevier, Amsterdam, 2003). A. N. Ivantsov, A. I. Mikhaylin, M. V. Silnikov,
4. A. V. Fedorov, Combust. Explos. Shock Waves 40 (1), V. S. Pomazov, A. M. Tereza, and S. V. Khomik, Russ.
21 (2004). J. Phys. Chem. B 14, 946 (2020).
5. A. A. Borisov, B. E. Gel’fand, E. I. Timofeev, C. A. Tsyga- 15. G. A. Kutushev and S. P. Rodionov, Combust. Explos.
nov, and S. V. Khomik, Khim. Fiz. 2, 1127 (1983). Shock Waves 35, 206 (1999).
6. B. E. Gel’fand, S. A. Gubin, S. M. Kogarko, and 16. A.A. Gubaidullin, A. Britan, and D. N. Dudko, Shock
O. E. Popov, J. Appl. Mech. Tech. Phys. 16, 897 Waves 13, 41 (2003).
(1975).
7. B. E. Gel’fand, S. P. Medvedev, A. N. Polenov, and 17. A. V. Fedorov, I. A. Fedorchenko, and I. V. Leont’ev,
S. M. Frolov, Sov. Tech. Phys. 32 (4), 506 (1987). Shock Waves 15, 453 (2006).
8. B. E. Gelfand, S. P. Medvedev, A. A. Borisov, 18. P. S. Utkin, Russ. J. Phys. Chem. B 11, 963 (2017).
A. N. Polenov, S. M. Frolov, and S. A. Tsyganov, Arch. 19. D. A. Sidorenko and P. S. Utkin, Russ. J. Phys. Chem.
Combust. 9 (1/4), 153 (1989). B 12, 869 (2018).
9. G. Ben-Dor, A. Britan, T. Elperin, O. Igra, and J. P. Jiang, 20. Ya. E. Poroshina and P. S. Utkin, Gorenie Vzryv 13 (1),
Exp. Fluids 22 (5), 432 (1997). 45 (2020).
10. B. E. Gel’fand, A. N. Polenov, S. M. Frolov, and
S. A. Tsyganov, Khim. Fiz. 5 (1), 121 (1986). 21. B. E. Gel’fand, S. P. Medvedev, A. N. Polenov,
E. I. Timofeev, S. M. Frolov, and S. A. Tsyganov,
11. S. P. Medvedev, A. N. Ivantsov, A. I. Mikhailin, J. Appl. Mech. Tech. Phys. 27 (1) 127 (1986).
M. V. Sil’nikov, A. M. Tereza, and S. V. Khomik, Russ.
J. Phys. Chem. B 14 (4), 601 (2020). 22. A. V. Zibarov, Doctoral (Phys. Math.) Dissertation
12. S. P. Medvedev, S. V. Khomik, A. N. Ivantsov, (Tul. State Univ., Tula, 2000).
E. K. Anderzhanov, A. M. Tereza, A. I. Mikhailin, and 23. V. N. Mikhalkin, S. P. Medvedev, A. E. Mailkov, and
M. V. Silnikov, J. Phys.: Conf. Ser. 1686, 012084 (2020). S. V. Khomik, Russ. J. Phys. Chem. B 13, 621 (2019).
RUSSIAN JOURNAL OF PHYSICAL CHEMISTRY B Vol. 15 No. 4 2021You can also read