Roundtable: Transparency and Public Data for Evidencebased Housing Policy Design
←
→
Page content transcription
If your browser does not render page correctly, please read the page content below

Roundtable: Transparency
and Public Data for Evidence-
based Housing Policy Design
         Tuesday 23rd November 2021
                     Online via zoom

                   Dr Dáithí Downey FRGS
   Chief Officer, Dublin City Local and Community Development
   Committee (LCDC) & Head of Housing Research and Strategy,
                    Dublin City Council, Ireland.
                    daithi.downey@dublincity.ie

                                                                1
Overview

1. Dublin’s strategic context for
   sustainable urban development
   and housing

2. The UN SDG as ‘strategy unifiers’
   for Dublin

3. Ireland’s ‘new plan’: Housing for
   All 2021

4. The evidence gap for housing
   policy design (and how Dublin
   City Council is working to bridge
   it…)
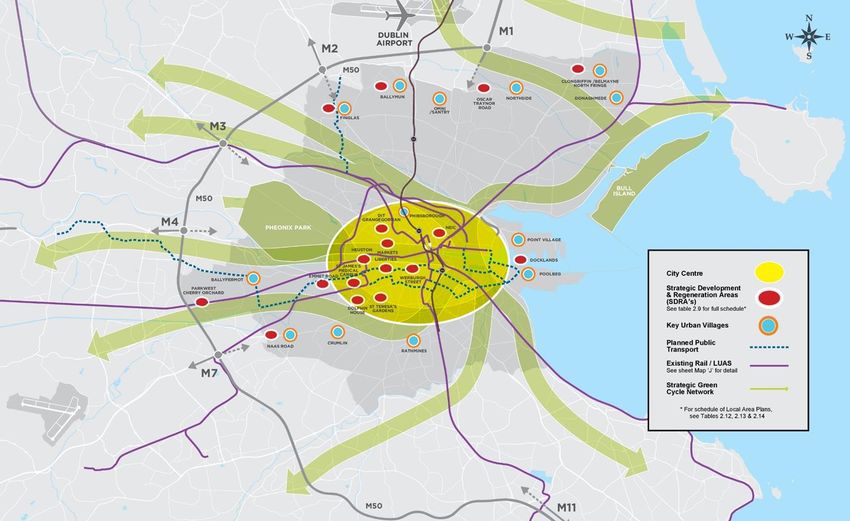
Dublin’s strategic context
for sustainable urban
development…
• Multiple strategies and
  action plans
     • The international (EU)
     • The national
     • The regional
     • The local
• Strategies operating across
  difference scales with
  different timelines.
• Hierarchy is assumed but
  often not constant or stable
• Operational & programme
  delivery determines
  effectiveness
• Outputs & outcomes with
  positive and negative
  externalities
• This can advance certain
  strategies over others.
• Need to identify ‘strategy
  unifiers’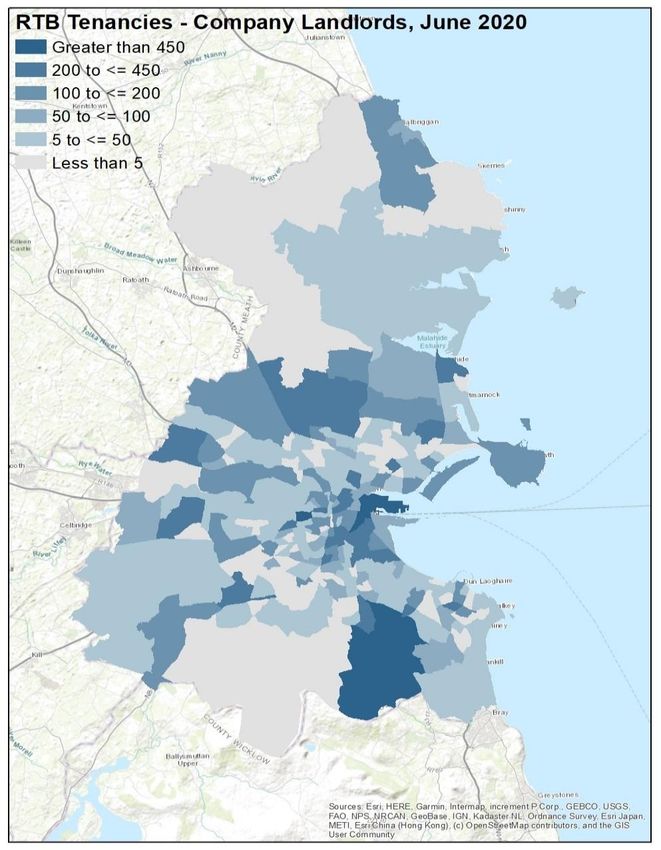
Dublin is aligning with the UN SDGs:
‘strategy unifiers’ for all our statutory plans
Examples:
Dublin City Local Economic and Community Plan 2016 – 2021 (successor will be
developed throughout 2022)
Dublin City Development Plan 2022 – 2028 (being finalised @ November 2021)
DCC Climate Action Plan 2019 – 2024 (under review post COP26)
4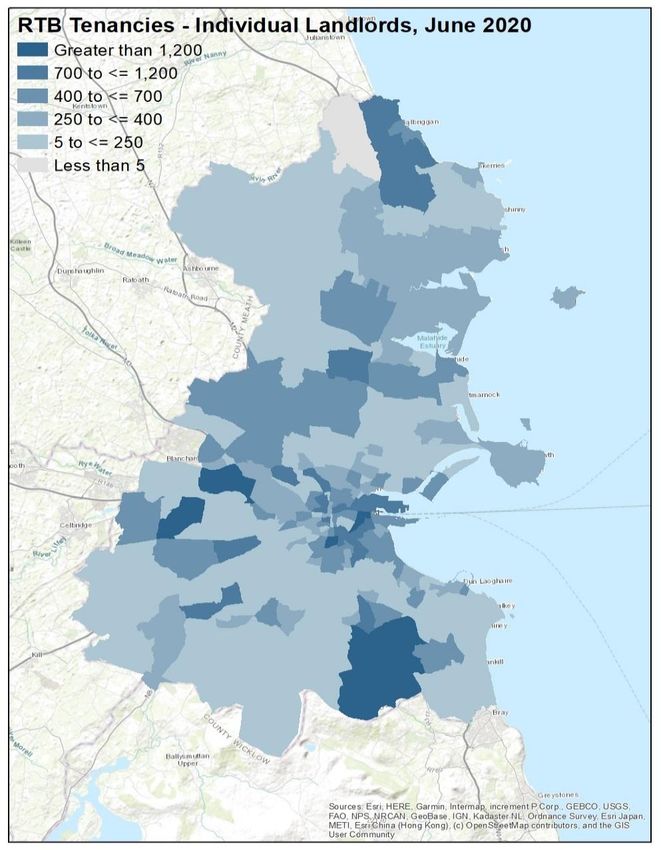
Housing for All – the new national housing plan for Ireland.
Multi-annual investment to 2030 to finance the Affordable Housing Act, 2021

Bridging the evidence gap for housing policy design to operationalise Housing for All
National data strategy vision: “To establish a data ecosystem that will improve how we govern, manage and re-use
data in an secure, efficient and transparent way, for the benefit of citizens, businesses and policy makers”

Dublin City Council’s Housing Observatory Data Navigator https://airomaps.geohive.ie/dho/
                      Providing the evidence base for local housing policy design and decision-making

• Public Viewer based on Data Themes                   •   Example: Rental Market, Sales and Market Valuations
    •   Contextual Layers                                   • RTB Rental Index
    •   Zoning & Planning                                        •   Standardised Average Rent
    •   Rental Market, Sales and Property Valuations             •   Qtr Time-series at LEA level
    •   Census 2016 Key Variables
    •   Dwelling Completions & Developments                 • RTB Rental Market Profile
    •   Pobal Deprivation Index                                  •   Status of current tenancies in Dublin (June 2018)
• Contextual Layers                                              •   Landlord Type (Individual, Company, AHB)
    •   Boundaries (CSO, OSI etc)                                •   Type of Property (Detached, Semi-D…….Bed-Sit)
          • Administrative and Political                         •   Bedroom Number (1, 2, 3 and 4 plus)
    •   Local Services (Data.Gov.ie, NTA, DES, etc)         • CSO Property Price Index
          • Health, Education, Transport & Emergency             •   Eircode Routing Key
              Services                                           •   Mean, Median and Volume of Sales
• Zoning & Planning (DPHLG & MyPlan )                       • Property Price Register
    •   Development Plans, Local Area Plans                      •   Address level data (No Eircode!)
    •   Areas of Residential Phasing                             •   All Sales, New and Second-hand sales
    •   Areas Zoned for Residential Use                     • LPT Valuations (valid Nov 2019)
    •   Unfinished Housing Survey                                •   Detached, Semi-D…….Apartments

                                                                                                                         7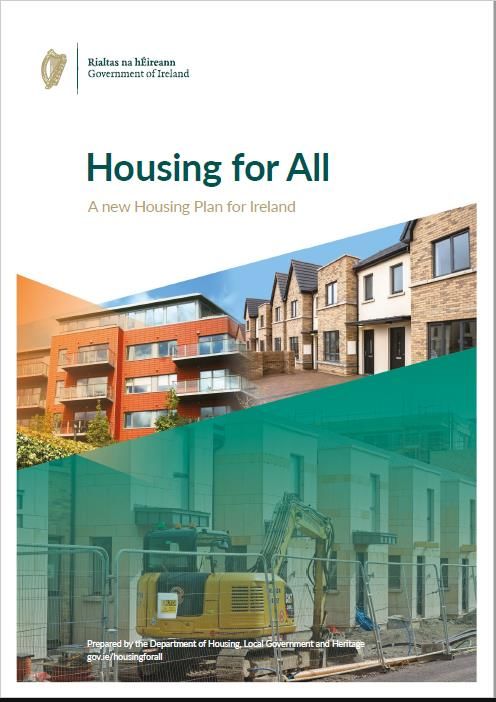
New housing supply in Dublin (2012 – 2020)

• Periphery for housing typologies (Semi-D;
  Duplex; low rise apartments 3-4 floors)
   • This sprawl is a challenge to NPF
      ‘compact growth’ objectives

• City centre (or core) new phase of rapid
  residential urbanism
   • Comprising high rise Build to Rent (BTR)
       apartment typologies (up to 22 floors)
       for ‘multi-family housing’,
   • Purpose Build Student Accommodation
       (PBSA) and Short Term Rental (STR).

    Source: Dublin Housing Observatory Data Navigator
    https://airomaps.geohive.ie/dho/
Dublin’s ‘traditional’ rentier economy

 Total ‘Individual Landlord’
 Tenancies in Dublin Region:
 2018 = 86,833,
 2020 = 89,795
 Increase of +2,962 or +3.4%

 Individual Landlord Tenancies in
 Dublin City:
 50,577 tenancies in June 2020
 (56.3% of all Dublin)
 Increase of +2,149 or +4.4%

 Source: Dublin Housing Observatory Data Navigator
 https://airomaps.geohive.ie/dho/

Dublin’s new rentier economy

Total ‘Company Landlord’ Tenancies
in Dublin Region:
    2018 = 16,789
    2020 = 24,692
    increase of +7,903 or + 44.6%

‘Company Landlord’ Tenancies in
Dublin City:
   14,296 tenancies in June 2020
   (57.9% of all Dublin)
   increase of +4,077 or +39.9%

 Source: Dublin Housing Observatory Data Navigator
 https://airomaps.geohive.ie/dho/
Housing Observatory ‘Evidence into Action’ informing decision-making…
(a) Affordable Housing Finance to 2040 and Beyond (partnered with Eurocities)
(b) Lived experience of DCC Rapid Build Housing (partnered with Royal Holloway University of
London)
(c) Airbnb & STR in Dublin: informing integrated, localised action for different places and spaces.
Research is partnered with UK Collaborative Centre for Housing Evidence (CaCHE)Housing Observatory podcast series: ‘This is where we live’ Using evidence to build intelligence and produce knowledge. Informing the dialogue and shifting the narrative https://www.thisiswherewelive.ie/
https://airomaps.geohive.ie/dho/
Thank you for listening !
You can also read


