21cm Intensity Mapping with MeerKAT and SKA (autocorrelations) - Prina Patel with Mario Santos
←
→
Page content transcription
If your browser does not render page correctly, please read the page content below
21cm Intensity Mapping
with MeerKAT and SKA
   (autocorrelations)
            Prina Patel with Mario Santos

Cosmology with Next Generation Radio Surveys, 21st June 2016
HI Intensity Mapping?
              Galaxies              Intensity Map

•   Look at the total intensity of a given emission line
    (21cm in our case) in a large 3d pixel (angle and
    frequency).
•   Each pixel combines the emission of multiple
    galaxies.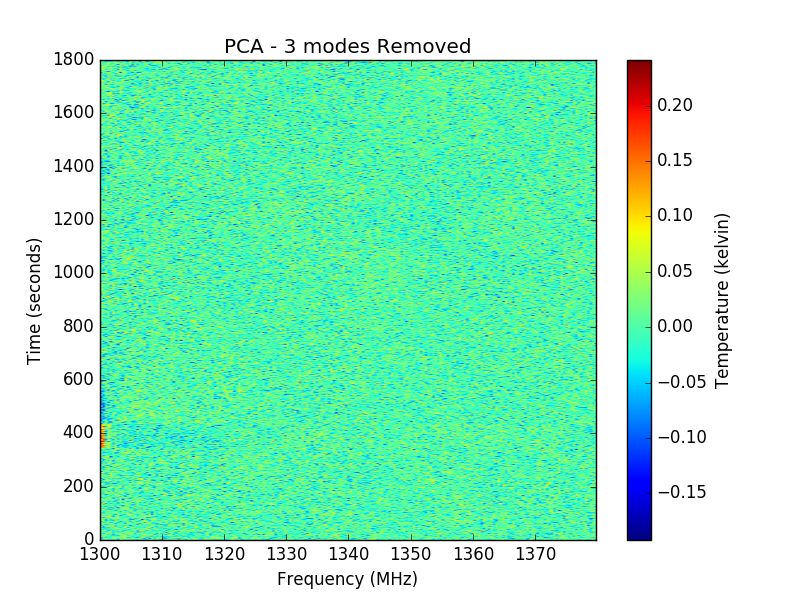
Why HI IM?
HI galaxy surveys are expensive:
                       SKA1 ~ 107 galaxies over 5,000 deg2
                       SKA2 ~ 109 galaxies over 30,000 deg2

                                                      Santos et al., 2015
     Cheap way to
     observe large
  volumes since you
     don’t need to
   resolve individual
  galaxies - ideal for
      cosmology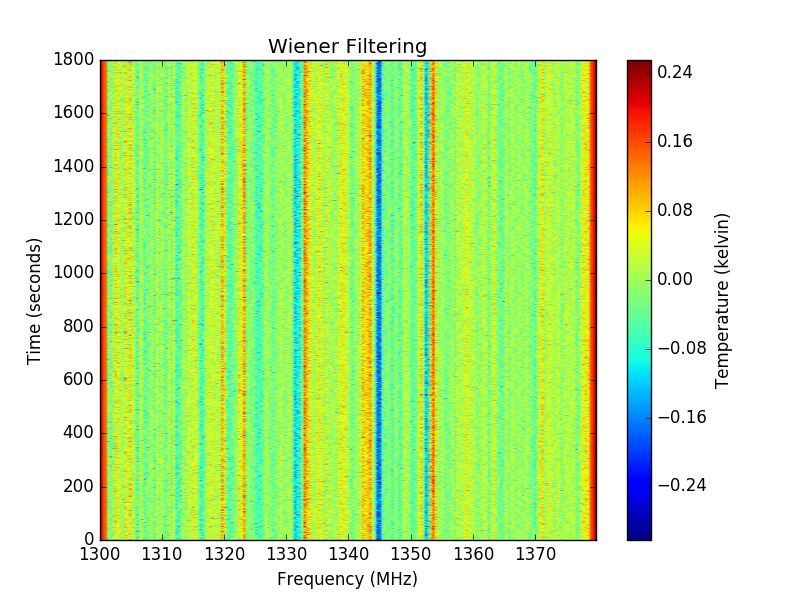
Current/Planned
                       BINGO, Uruguay

HIRAX, South Africa

            GBT, USA   CHIME, Canada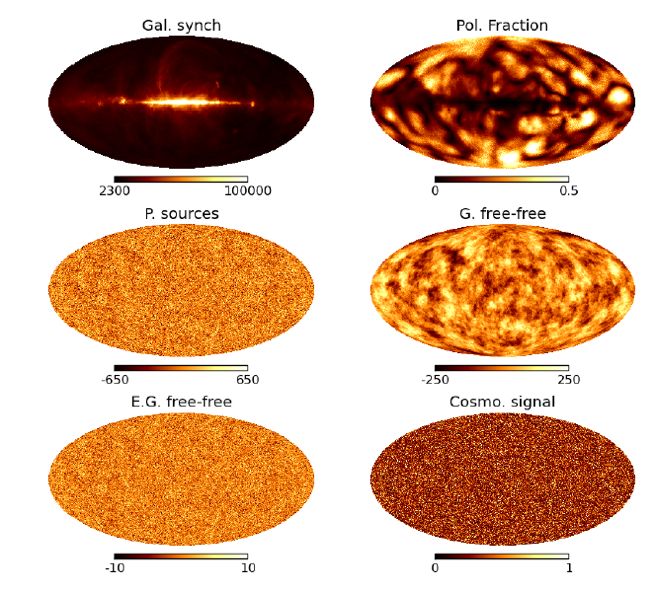
MeerKAT
64 dishes in the Karoo, 20 dishes in place, 16 with receivers
 fitted and operational as an interferometer in the next few
                           months

     Precursor that will be incorporated into SKA1-Mid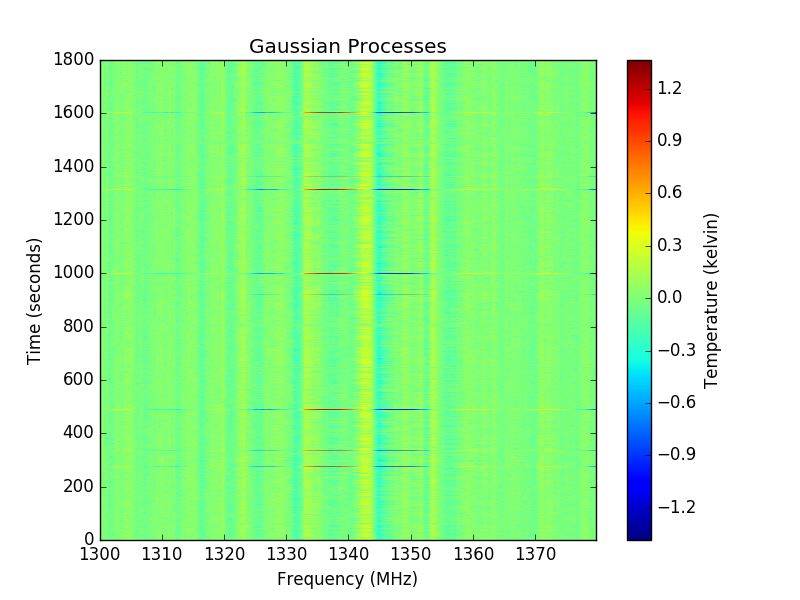
MeerKLASS
MeerKAT final specs deliver great survey speed (large primary
                   beam and low noise)

   HI Intensity mapping, cosmology and lots of other stuff

    ~4000 square degrees, 6 microJy rms noise (~4000h)

   Crucial stepping stone for run up to SKA (especially for
                     intensity mapping)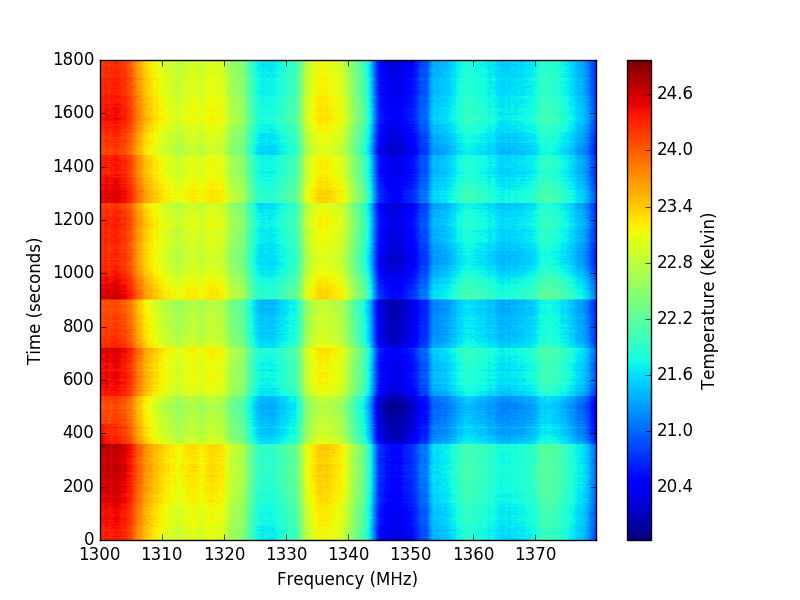
•
                            SKA
    Interferometer baselines not small enough to probe BAO
    scales, so have to use in single dish mode…also only way
    to get very largest scales
•   Phase 1: ~190 dishes + 64 MeerKAT, ~2023
•   Proposal to provide calibrated autocorrelations approved by
    the SKA office

            15m SKA Dishes
BAO with MeerKAT?

                                Possible
                            detection of BAO
                              with intensity
                                mapping

                           Using only autocorrelations
Credit: Amadeus Witzmann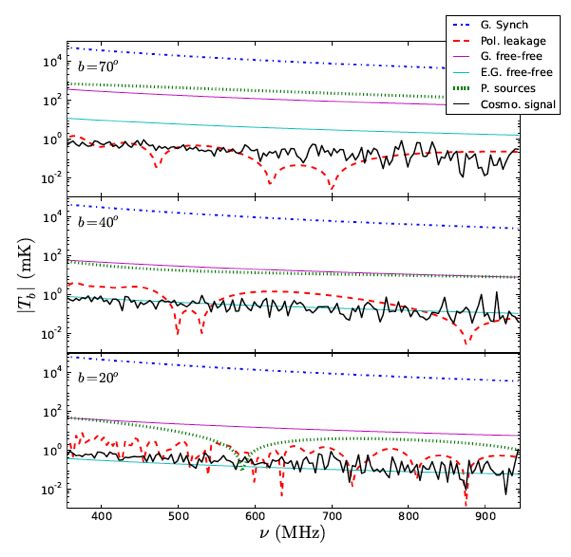
BAO with SKA?
                     SKA1 Intensity mapping
                     comparable to EUCLID
                        galaxy survey for
                       measuring the BAO
                            wiggles.
z~0.5

z~1.8

        Bull et al., 2014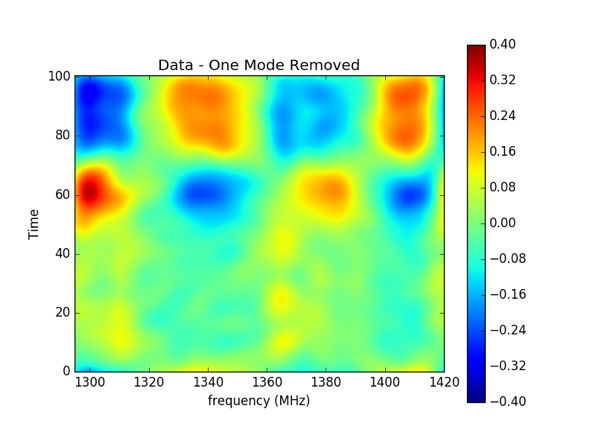
Why is IM hard?
  Foregrounds

   Orders of
magnitude larger
  than signal

    Several
  contributors
                     T [mK]
 BUT spectrally
   smooth
Foregrounds are
smooth in frequency
Fluctuations in the
instruments and their
coupling to the foregrounds
make cleaning much
harder
Cross-correlation with other
surveys (e.g. MeerKAT/
DES, SKA/LSST/EUCLID)
can also help with this, as
demonstrated by the GBT
team
Alonso et al., 2014Noise !
✓ ◆2 0.5
1 G
T = Tsys +
t ⌫ G
White/thermal Pink - 1/f
noise noise
✓ ◆2
Can model the gain G
fluctuations in time as: = 0 + 1t
G
Integration time 1 Integrating longer than this
t= p
sweet spot: 1 ⌫ means the 1/f dominatesPower Spectrum in Time…
White noise
Power
Spectrum
/ 1/f
At knee frequency pink and white
Pink noise contribution are equal
White
f
fkneeTesting the calibration of autocorrelations with Noise Injection using KAT7 and MeerKAT
KAT7 Data
                  Drift scan observation

   ~30 mins of useable data with 1 second integration

             Noise diode fired every 3 minutes

Can we calibrate the autocorrelation to reach TRMS=48mK?

               Tsys         30K
      Trms   =p      'p                = 48mK
                  ⌫⌧   1s ⇥ 390.625kHz
In time… In frequency…
Deriving Gains
IN = G(S + N ) When the noise diode is firing
 I = GS          When it’s not
     IN I
 G=        Solution
       N

 10s

                                 Noise diode model
             180s
       10s
30 Minutes Corrected Data
80 MHz
Starting point for foreground cleaningForeground Cleaning
(Along the frequency direction)
Spectral smoothness - fit smooth things to each timestamp.
We looked at 3 different approaches: Wiener filtering,
Gaussian Processes and SVD.
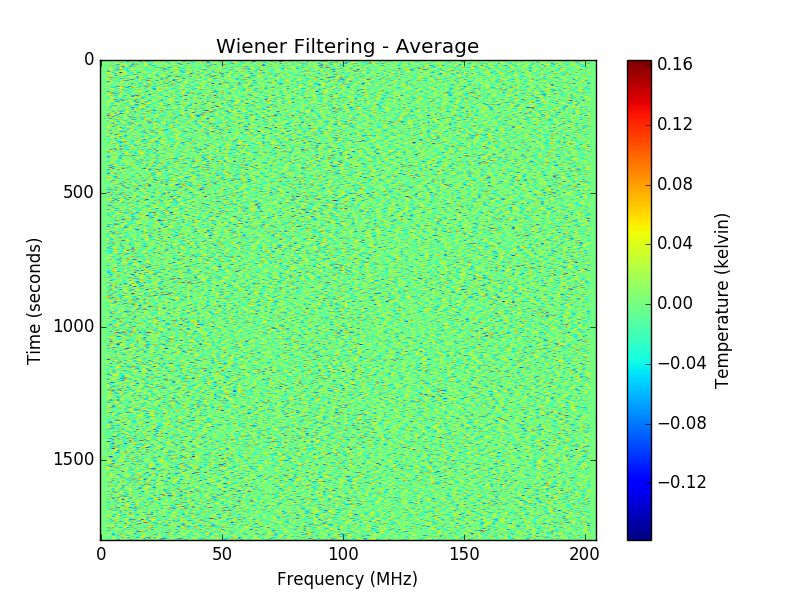
Are residuals noise like?Wiener Filtering:
Leaves a very distinct signature in frequency that appears
very constant in time30K
TRM S 'p = 0.048k
t ⌫
Subtract off this very constant pattern and you’re left with noise
like residuals (but rms level is below the expected noise)Gaussian Processes Much more contamination is removed, but still not perfect!
Maybe we can
                              improve this?

Large scale structure still remains
Factor data matrix A: A=USV SVD U,V - unitary S - Singular values of A Find that with the removal of 3 components we get noise like residuals
MeerKAT Data - 1/f

 SCP Data with
 different dump
rates, all below 1
     second

  100 second
  observations

                      knee ~ 0.2 Hz, 5 sec
Move the knee
fknee Move the knee
with filtering in
frequency
20sec10Hz data SVD - remove two top
modes - looks pretty white!
1/f seems to be mostly in the top 2
modes
Drifts in time = 1/f (Thanks to Jon Sievers)More MeerKAT Data Noise injection data to be analysed: noise diodes are available on every dish (very stable:
Conclusions
A large survey with MeerKAT will detect the BAO signal in HI
                 (as well as other science)

Exploring foreground cleaning methods with autocorrelation
                data from KAT7 & MeerKAT

         Looking at how to achieve the optimal 1/f

            More MeerKAT data in the pipeline

         Everything is a crucial step towards SKA1
You can also read


