Pullout Behavior of Nail Reinforcement in Nailed Soil Slope

Page created by Chris Jackson
 
CONTINUE READING
Pullout Behavior of Nail Reinforcement in Nailed Soil Slope
applied
              sciences
Article
Pullout Behavior of Nail Reinforcement in Nailed Soil Slope
Mahmoud H. Mohamed, Mohd Ahmed * and Javed Mallick

                                          Civil Engineering Department, College of Engineering, King Khalid University, Abha 61421, Saudi Arabia;
                                          Mhosyan@kku.edu.sa (M.H.M.); jmallick@kku.edu.sa (J.M.)
                                          * Correspondence: mall@kku.edu.sa; Tel.: +966-172-418-439

                                          Abstract: The pullout resistance and displacement performance of reinforcement have significant
                                          effects on the safe and economic design of a reinforced-soil system. In this study, the nail pullout
                                          tests are conducted to assess the pullout behavior of soil nail reinforcement at different levels in
                                          the soil slope of granular materials. The similitude laboratory models of a reinforced soil system
                                          with a scale of 1:10 are prepared. The construction sequence used in a full scale slope was precisely
                                          followed in the laboratory model. The models consist of a Perspex wall box filled with sand and
                                          steel bars as a reinforcement. The models of sand beds are formed using an automatic sand raining
                                          system. Devices and instruments are installed to record the nails pullout resistance and displacement.
                                          The tests are carried out at variable footing pressures to get the pullout force of the nails based on a
                                          strain control technique. The finite element models of nailed soil slope are also analyzed to validate
                                          the laboratory model results. It infers from the numerical model results that the laboratory models
                                          underestimate the pullout behavior of nail reinforcement in nailed soil slope. The pull-out force in
                                          nail reinforcement increases as the displacement increases and then decreases slightly and becomes
                                          constant with an increase in displacement in the case of deeper placed nails, but it becomes constant
                                          immediately for upper nails.
         
                                   Keywords: soil nailing system; nails characteristics; soil slope; footing pressure; nails orientation;
Citation: Mohamed, M.H.; Ahmed,           pullout force
M.; Mallick, J. Pullout Behavior of
Nail Reinforcement in Nailed Soil
Slope. Appl. Sci. 2021, 11, 6419.
https://doi.org/10.3390/app11146419       1. Introduction
                                                Soil nailing techniques are widely applied for the stabilization of slopes and exca-
Academic Editor: Daniel Dias
                                          vations. The basic concept of reinforced-soil systems relies upon the transfer of resisting
                                          tensile force-generated nails into the soil through friction or adhesion mobilized at the
Received: 23 June 2021
Accepted: 6 July 2021
                                          inter-faces. The soil mass exerts the driving forces, i.e., lateral earth pressure on the weight
Published: 12 July 2021
                                          of a potentially sliding soil mass while providing the nail bond resistance. The frictional
                                          interaction between the soil and nails restrains the soil movement during and after exca-
Publisher’s Note: MDPI stays neutral
                                          vation. The pullout resistance and displacement performance of the reinforcement has
with regard to jurisdictional claims in
                                          significant effects on the safe and economic design of a reinforced-soil system [1]. The
published maps and institutional affil-   pullout resistance in a reinforced-soil system is influenced by many parameters, such
iations.                                  as methods and construction processes, soil and nail properties, the interface roughness
                                          between soil and nails, and the geometry of the slope or excavation. Friction and adhesion
                                          at the interface between reinforcement and soil increases the stability by reducing the
                                          tensile strain in soil mass [2]. Panigrahi and Dhiman [3] have presented the design of the
                                          soil nailing system for landslide prevention and mitigation. They have also reviewed the
Copyright: © 2021 by the authors.
Licensee MDPI, Basel, Switzerland.
                                          various aspects and constraints related to soil nailing. The resistance factors for LRFD of
This article is an open access article
                                          soil nail pullout limits state under different design scenarios of nailed soil structures, that
distributed under the terms and           differ in wall face batter, soil friction angle, nail ultimate bond strength, and surcharge
conditions of the Creative Commons        live load, are analyzed and calibrated by Hu and Lin [4] using artificial neural network
Attribution (CC BY) license (https://     (ANN) models. The progressive pullout response of a soil nail in reinforced soil systems is
creativecommons.org/licenses/by/          examined analytically by Hong et al. [5] They have considered the pullout process as three
4.0/).                                    typical phase processes. The first is a pure elastic phase during which the nail–soil interface

Appl. Sci. 2021, 11, 6419. https://doi.org/10.3390/app11146419                                               https://www.mdpi.com/journal/applsci
Pullout Behavior of Nail Reinforcement in Nailed Soil Slope
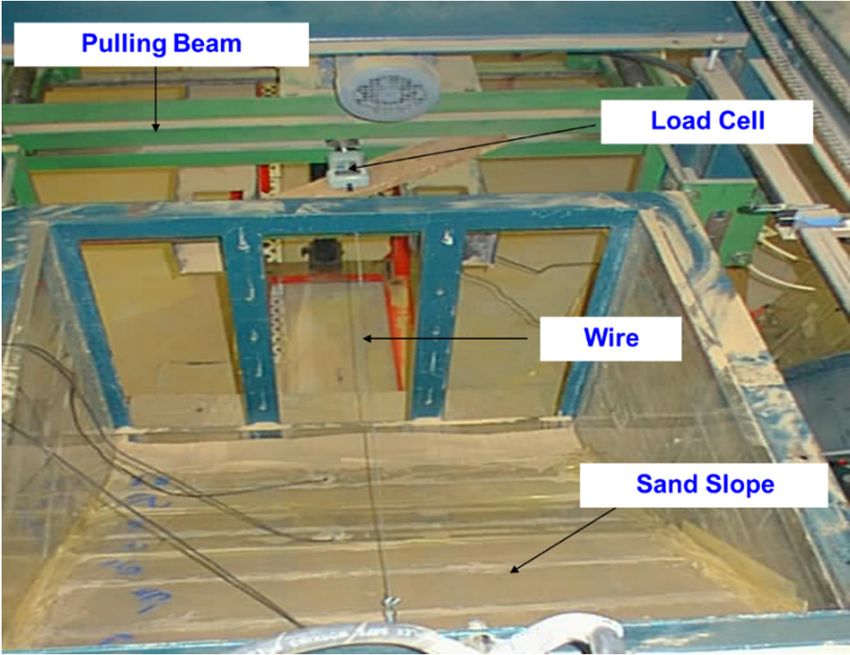
Appl. Sci. 2021, 11, 6419                                                                                            2 of 16

                            follows a linear elastic stress-displacement relationship, and then the elastic–plastic phase
                            during which a transition point presents dividing the elastic and plastic zones and the
                            final pure plastic phase. They have also performed a comprehensive parametric study
                            to assess the effects of key factors, including length and diameter, length of plastic zone,
                            and the elastic modulus of a soil nail, on the pullout resistance of a soil nail. The studies
                            on the pullout behavior in soil nailing systems are due to Luo et al. [6], Su et al. [7] and
                            Hong et al. [8] for various overburden pressure and conditions of soil dilation. The effect
                            of rainfall infiltration on the behavior of soil nails in loose fill slopes is studied by Cheuk
                            et al. [9] Pradhan et al. [10] have investigated through the experiments the soil–nail pullout
                            interaction in loose fill materials. They have also simulated the pullout load-displacement
                            relationship using a one-dimensional spring model. Chen et al. [11] have developed the
                            novel nail pullout test to predict the soil–nail interface shearing mechanisms using short
                            nails embedded in expansive cohesive soils under varying degrees of saturation. The effect
                            of nails and soil parameters, namely size, length and angle of nails and friction coefficient
                            at interface, on the pullout force for grouted soil nails in sandy soil are investigated experi-
                            mentally and numerically by Ye et al. [12]. The accuracy of effective stress method (ESM)
                            equations for the prediction of the ultimate bond strength of soil nails is assessed statis-
                            tically by Lin and Liu [13] using the maximum likelihood method. Pullout behavior and
                            the failure mechanisms of waste tire strip-reinforced sands are studied using the physical
                            models by Li et al. [14] and they observed that the pullout resistance is initially provided
                            by the front portion of the embedded tire strips and in the latter stages, more and more
                            of the areas of the end portion of the tire strips are mobilized, giving a progressive failure
                            mechanism. The pullout and bond resistance of soil nails of alluvium soil by considering
                            the overburden pressure effect are evaluated by Moayed and Namae [15] using nail pullout
                            physical models. The have observed that the bond resistance of soil nails increases as the
                            overburden pressure increases in coarse grained soil, but the overburden pressure does not
                            have a significant effect on the bond resistance in clay soil.
                                  An analytical model was developed by Luo et al. [16] to predict the pullout resistance
                            mechanism and they have shown that an apparent friction coefficient decreases with the
                            increase of the applied normal confining pressure around the soil nail. Zhao et al. [17] have
                            simulated the pullout behavior of a soil nails in a soil mass under different overburden
                            pressures using the finite element technique. The constitutive relationship in soil is based
                            on a modified Drucker–Prager/Cap model, while that of the soil–nail interface is described
                            by a Coulomb friction model. The laboratory pullout tests are conducted by Tokhi et al. [18]
                            on a new screw nail in sandy soil. The testing results indicate that the slip mechanism of
                            screw soil nails is different, and that the resultant pullout capacity of screw soil nails is
                            higher when compared with the conventional soil nails. The progressive shear strength
                            mobilization along the embedment of the thread-bar grouted anchor is examined by
                            Ruggeri et al. [19] using properly installed strain gauge monitoring. The grouted anchor
                            is founded in the nonhomogeneous ground, a sand deposit followed by marly clay. They
                            found from the results that a very low shear strength is offered by the sand and fast
                            mobilization of the shear strength is in the marly clay at the deep end of the anchor.
                            The behavior (pullout resistance) of a hollow and solid shaft helical soil nail installed in
                            cohesionless soil were examined by Sharma et al. [20] under varying parameters such as
                            helical soil nail properties, nail shaft types, installation torque, and overburden pressure.
                            They have shown that additional helices will only contribute to pullout capacity if located
                            outside the region of soil mobilized in the failure mechanism of a lower helix and solid shaft
                            helical nails can be replaced by hollow nails without compromising on pullout capacity,
                            adding to a reduction in construction cost. Ehrlich et al. [21] investigated the effect of
                            excavation execution procedures on the behavior of nailed-soil structures using the finite
                            element Code Plaxis 2D, 2015. The load transfer behavior of grouted anchors in laterite
                            under long-term (creep) loads were investigated by Chen et al. [22] using laboratory and
                            analytical models. The creep behavior on the grout–soil interface was represented using
                            a Merchant rheological model. They observed that that the tensile force distribution in
Pullout Behavior of Nail Reinforcement in Nailed Soil Slope
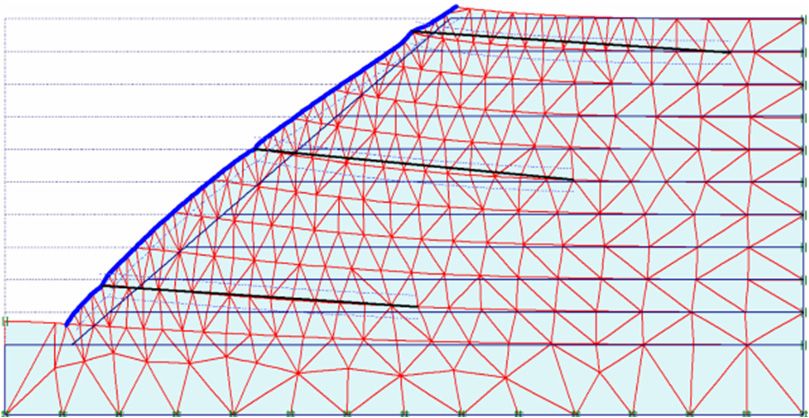
Appl. Sci. 2021, 11, 6419                                                                                              3 of 16

                            anchors tends to be linear, and that the shear stress distribution tends towards uniformity
                            under long term conditions.
                                 It is evident from the literature review that there is no simple way to accurately
                            predict the pullout behavior for all types of nails in different soil types. There are numerous
                            parameters affecting the pullout response of soil nails, including variation in soil conditions,
                            variation in stress situation and variation in nail shape. Moreover, many parameters will
                            change due to nail installation with time. Therefore, further studies are clearly needed
                            to investigate the pullout behavior for soil nail reinforcement in nailed soil systems. In
                            the present study, the nail pullout tests were conducted to assess the pullout behavior of
                            soil nail reinforcement in granular materials. The development of soil shear resistance
                            at the reinforcement–soil interface, i.e., soil–reinforcement interaction, is investigated in
                            this study. Similar laboratory models of reinforced soil systems on a scale of 1:10 were
                            prepared. The construction sequence used in a full scale slope was precisely followed
                            in the laboratory model. The construction of a nailed soil slope system model, loading
                            stages and pullout testing procedures were clearly defined. The models consisted of a
                            Perspex wall box filled with sand and steel bars as a reinforcement. The models of sand
                            beds were formed using automatic sand raining system. Devices and instruments were
                            installed to record the nail pullout resistance and displacement. The tests were carried out
                            at variable footing pressures to get the pullout force of the nails with a strain controller,
                            taking a horizontal speed as 0.3 mm/min.

                            2. Materials and Methods for Soil Nail Reinforcement Pullout Test
                                  The physical model of nail reinforced soil, including the materials used in the present
                            study, is specially prepared to achieve a full similarity for the state of stresses and strains as
                            the prototype and to avoid the effect of side friction in the model’s walls. The dimensions
                            of the model were selected with an appropriate scale factor (ratio between model and
                            prototype) using the simulation and dimensional analysis to simulate the prototype as
                            closely as possible and to make the material handling easy. The similitude, materials,
                            experimental set-up, and construction procedure for the soil–nail reinforcement pullout
                            test are described below.

                            2.1. Simulation and Dimensional Analysis
                                 The stiffness parameters for the component of the soil nailing system are maintained
                            for both model and prototype to achieve the correct similarity, i.e., flexibility number “ρ”
                            as per the following relationships:

                                                                     ρmodel = ρ prototype                                 (1)

                                                                   H4         H4
                                                               (      )     =( )                                          (2)
                                                                   EI model   EI prototype
                            where H = Excavation height (m); E = Young’s modulus of elasticity of components (kPa);
                            I = Moment of inertia per unit length of the components (m4 /m).
                                 If we consider a scale factor, N equal to (Hprototype /Hmodel ) and the same material for
                            the model and prototype, the moment of the inertia relationship between the model and
                            the prototype becomes:
                                                                                                            4
                                                                                     E prototype
                                                                                                  
                                                                                                        1
                                                          Imodel = I prototype                                            (3)
                                                                                      Emodel            N

                                 For the present study, the scale factor is taken as 10, so if the diameter of the model
                            of the nail is 5 mm, it simulates the actual nail of the diameter at 50 mm. Considering
                            the same density and shearing resistance of materials in the model and prototype soil,
                            the length and spacing between the nails and applied footing pressure of the model are
                            proportional to the prototype with the same ratio as the total excavation height ratio.
Pullout Behavior of Nail Reinforcement in Nailed Soil Slope
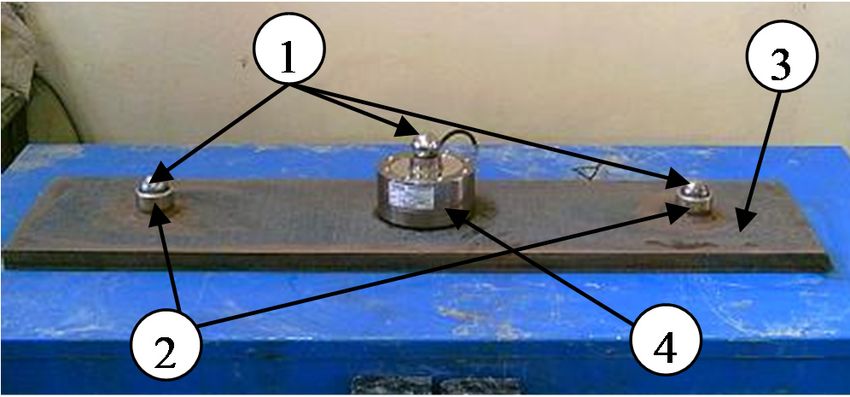
Appl. Sci. 2021, 11, x FOR PEER REVIEW                                                                                                    4 of 17

Appl. Sci. 2021, 11, 6419                                                                                                                 4 of 16

                                   2.2. Soil Nailing System
                                         The soil nailing system consists mainly of backfill material, reinforcement, facing unit
                                  2.2. Soil Nailing System
                                   and strip footings. The air-dried clean siliceous yellow sand was used in the preparation
                                   of theThemodels.
                                              soil nailing
                                                      The system
                                                           physicalconsists mainly of backfill
                                                                     and mechanical             material,
                                                                                         properties  of thereinforcement,   facingdeter-
                                                                                                              tested sand were     unit
                                  and   strip footings.  The air-dried clean siliceous  yellow  sand  was  used   in the
                                   mined. The sand samples were tested for grain size distribution as per ASTM D421, spe-preparation  of
                                  the  models.    The  physical and  mechanical    properties  of the tested   sand  were
                                   cific gravity as per ASTM D854, minimum and maximum densities, moisture content and     determined.
                                  The
                                   shearsand   samples
                                           strength       were tested
                                                     parameters   as perfor grainD3080.
                                                                          ASTM     size distribution   as per
                                                                                          Figure 1 shows    theASTM      D421,
                                                                                                                 grain size     specific
                                                                                                                            distribution
                                  gravity   as per  ASTM   D854,  minimum    and  maximum     densities, moisture    content
                                   of several samples (two samples each for dry and wet sand) used. The physical properties  and  shear
                                  strength parameters as per ASTM D3080. Figure 1 shows the grain size distribution of
                                   of the soil materials are given in Table 1. Table 1 indicates that the tested sand was classi-
                                  several samples (two samples each for dry and wet sand) used. The physical properties of
                                   fied as poorly graded sand (SP) according to the unified soil classification system. It is
                                  the soil materials are given in Table 1. Table 1 indicates that the tested sand was classified
                                   known that the angle of internal friction (φ) of sand depends on the relative density of the
                                  as poorly graded sand (SP) according to the unified soil classification system. It is known
                                   sample. Six samples were tested at different densities and varied from the relative density
                                  that the angle of internal friction (ϕ) of sand depends on the relative density of the sample.
                                   of 0.0% to the relative density of 100%. Figure 2 shows the relationship between the angle
                                  Six samples were tested at different densities and varied from the relative density of 0.0% to
                                   of shearing resistance and the relative density. For pullout test, sand with a relative den-
                                  the relative density of 100%. Figure 2 shows the 3relationship between the angle of shearing
                                   sity of 48% and medium sand (γ = 16.41 kN/m ), which has an angle internal friction φme-
                                  resistance and the relative density. For pullout test, sand with a relative density of 48% and
                                   dium as 34°.
                                  medium sand (γ = 16.41 kN/m3 ), which has an angle internal friction ϕmedium as 34◦ .
                                   Table 1. Physical and Mechanical Properties of Soil.
                                  Table 1. Physical and Mechanical Properties of Soil.
                                               Property                   Value                    Property                          Value
                                               Property                    Value                   Property                         Value
                                              % of Clay                    0.00             Specific gravity (Gs)                      2.62
                                              %%ofofClay
                                                      Silt                  0.00
                                                                           1.33       MinimumSpecific gravity
                                                                                                 density       (G)s(kN/m
                                                                                                           (γmin    )       3)        2.62
                                                                                                                                      15.30
                                                % of Silt                   1.33       Minimum density (γmin ) (kN/m3 )3             15.30
                                           %   of fine Sand
                                            % of fine Sand
                                                                          39.17
                                                                           39.17
                                                                                      Maximum density (γmax) (kN/m3 )                 17.80
                                                                                                                                     17.80
                                                                                      Maximum density (γmax ) (kN/m )
                                        %% of
                                            of medium
                                               medium Sand Sand           58.63
                                                                           58.63         Minimum     voidratio
                                                                                          Minimum void      ratio(e(e min)
                                                                                                                    min )
                                                                                                                                      0.472
                                                                                                                                     0.472
                                          %
                                          % of coarse
                                                coarseSandSand             0.87
                                                                            0.87        Maximum      voidratio
                                                                                          Maximum void      ratio(e(e max
                                                                                                                    max  ))           0.712
                                                                                                                                     0.712
                                           % of
                                             of fine                                                                     ◦)
                                          %      fineGravel
                                                      Gravel                0.00
                                                                           0.00         Angelof
                                                                                       Angel   ofinternal
                                                                                                  internal friction
                                                                                                            friction(φ(ϕ°)             3434
                                    Effective diameter (D10 ) mm           0.126          Bulk Density (γb ) (kN/m 3)  3             16.41
                                   Effective diameter (D10) mm            0.126          Bulk Density (γb) (kN/m )                    16.41
                                    Coefficient of uniformity (Cu )         1.99                 Void ratio (e)                      0.597
                                   Coefficient
                                    Coefficient of  uniformity
                                                 of gradation  (Cu(C
                                                                   ) u)    1.99
                                                                            1.00                Void ratio
                                                                                             Relative        (e)(%)
                                                                                                       density                        0.597
                                                                                                                                       48
                                   Coefficient of gradation (Cu)           1.00             Relative density (%)                         48

                                                                                            Sand
                                                            Silt                                                                 Gravel

                                                                             Fine           Medium          Coarse

                                                   100

                                                   90

                                                   80

                                                   70

                                                   60
                                   Passing
                                             (%)

                                                   50

                                                   40
                                                                                                                        Dry sample (1)
                                                   30
                                                                                                                        Dry sample (2)
                                                   20                                                                   Wet sample (3)
                                                   10                                                                   Wet sample (4)

                                                    0
                                                     0.01                    0.1                             1                                 10
                                                                                    Grain Size (mm)

                                   Figure1.1.Grain
                                  Figure     Grainsize
                                                   sizedistribution
                                                       distributionof
                                                                    ofthe
                                                                       thetested
                                                                           testedsand.
                                                                                  sand.
Pullout Behavior of Nail Reinforcement in Nailed Soil Slope
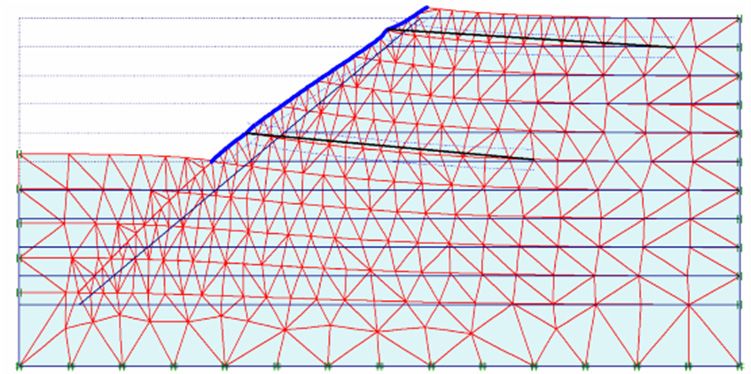
Appl. Sci. 2021, 11, x FOR PEER REVIEW                                                                                                     5 of 17

Appl. Sci. 2021, 11, 6419
Appl.                x FOR PEER REVIEW                                                                                                          17
                                                                                                                                           5 of 16

                                  Figure 2. Relationship between relative density and angle of internal friction.

                                        The nails used were steel bars of circular cross section with a constant diameter of 5
                                  mm    and    lengths of 700
                                  Figure 2. Relationship          mm.relative
                                                             between    The nails   were
                                                                                density andchosen   to internal
                                                                                              angle of  accommodate
                                                                                                                friction. the electrical strain
                                  gauge. A direct tension test was performed to determine the strength characteristics of the
                                  nail. The
                                        Figure
                                        The       3 shows
                                               nails
                                              nails   used   the stress–strain
                                                      used were
                                                             were   steelbars
                                                                   steel  barsof relationship
                                                                                of              forsection
                                                                                    circularcross
                                                                                   circular   cross nail  materials.
                                                                                                     section           The
                                                                                                              withaaconstant
                                                                                                             with             mechanical
                                                                                                                        constant           prop-
                                                                                                                                    diameter
                                                                                                                                  diameter   ofof5
                                  erties
                                  5 mm    of
                                          and nails  are
                                                 lengths  given
                                                           of 700in Table
                                                                   mm.   The2. nails were   chosen   to accommodate
                                  mm and lengths of 700 mm. The nails were chosen to accommodate the electrical strain    the   electrical strain
                                  gauge. AAdirect
                                  gauge.        directtension
                                                        tensiontest
                                                                  testwas
                                                                        wasperformed
                                                                              performed to to  determine
                                                                                            determine    thethe  strength
                                                                                                             strength         characteristics
                                                                                                                         characteristics       of
                                                                                                                                           of the
                                  Table
                                  the     2. Properties
                                      nail.   Figure   3  of Reinforcement
                                                          shows   the         (Nails). relationship for nail materials. The mechanical
                                                                       stress–strain
                                  nail. Figure 3 shows the stress–strain relationship for nail materials. The mechanical prop-
                                  properties
                                  erties         of nails
                                          of nails         are given
                                                     are given         in Table
                                                                 in Table   2. 2.        Maximum                        Flexural
                                                             Maximum Strains At                           Young’s                      Normal
                                                   Length
                                               Table 2. Properties   of Reinforcement
                                                                                            Tensile                     Rigidity,
                                    Element
                                  Table  2. Properties         Tensile
                                                          of Reinforcement    (Nails). (Nails).
                                                                            Ultimate                      Modulus                     Stiffness,
                                                    (mm)                                  Strength                           EI
                                                             Force (kN) Stress (με)                         (kPa)                    EA (kN/m)
                                 Maximum              Strains at         Maximum               Young’s
                                                                                             (kPa)
                                                                                         Maximum                 Flexural
                                                                                                                        Flexural2) Normal
                                                                                                                       (kN.mm
                    Length                                   Maximum       Strains   At
    Element                     Tensile
                                  5 mmForce           Ultimate
                                           Steel Length               Tensile  Strength        Modulus Young’s Rigidity, EI            Normal
                                                                                                                                  Stiffness, EA
                     (mm)                                                                  Tensile                      Rigidity,
                                                                                                                          2 ) × 10−3 (kN/m)
                                    Element
                                    (kN)             700         17.4
                                                              Tensile
                                                     Stress (µε)               7625
                                                                           Ultimate
                                                                             (kPa)         8.8 ×(kPa)
                                                                                                  105 Modulus
                                                                                                          21.2 ×(kN
                                                                                                                 107·mm6.51             4165.9
                                                                                                                                      Stiffness,
                                      Nails         (mm)                                  Strength                          EI
  5 mm Steel                                                 Force (kN) Stress (με)5                    7
                                                                                                            (kPa)         −
                                                                                                                                     EA (kN/m)
                      700            17.4                7625             8.8 × 10           (kPa)
                                                                                              21.2 × 10        6.51 × 10 3
                                                                                                                       (kN.mm     2) 4165.9
     Nails
                                  5 mm Steel
                                                     700         17.4          7625        8.8 × 10⁵      21.2 × 10⁷ 6.51 × 10⁻³ 4165.9
                                      Nails

                                  Figure 3. Stress–strain curve of the tested nail.
Pullout Behavior of Nail Reinforcement in Nailed Soil Slope
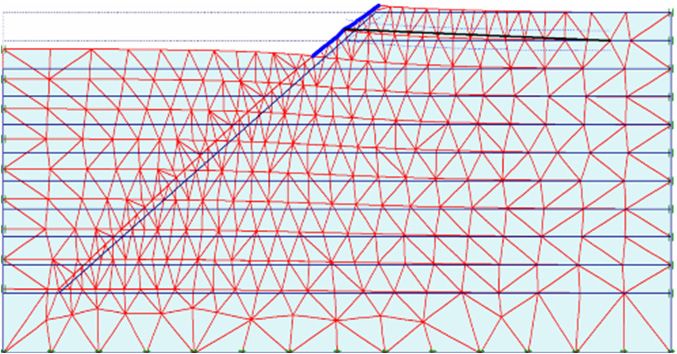
Appl. Sci. 2021, 11, x FOR PEER REVIEW                                                                                                                  6 of 17

 Appl. Sci. 2021, 11, 6419                                                                                                                                6 of 16
                                    Figure 3. Stress–strain curve of the tested nail.

                                          The facing unit selected was a Perspex plate with a thickness of 5.0 mm to simulate
                                           The facing
                                    the shotcrete       unit
                                                    in the    selected was
                                                            prototype   soil anailing
                                                                               Perspex  plate with
                                                                                      system         a thickness
                                                                                               of a thickness    ofof 5.0 mm
                                                                                                                    140.0  mm.toThe
                                                                                                                                  simulate
                                                                                                                                      dimen- the
                                      shotcrete  in the prototype    soil nailing  system  of a thickness    of 140.0  mm.
                                    sions of the facing panel were 848.0 mm wide and 140.0 mm vertical (projected) in height. The  dimensions
                                      of theoffacing
                                    Holes      8.0 mm panel    were 848.0
                                                         in diameter   weremm      wide and
                                                                               provided       140.0 mm
                                                                                          in panels   to fixvertical   (projected)
                                                                                                              the nails’  head. Theinsize
                                                                                                                                        height.
                                                                                                                                             of
                                      Holes  of  8.0 mm    in diameter    were   provided  in  panels   to fix the  nails’  head.
                                    footing has a direct influence on the size of the soil box. The size of footing is chosen      The   sizeasof
                                      footing
                                    185  mm ×has 150a mm
                                                      direct× influence
                                                              22 mm. The  on mechanical
                                                                              the size of the soil box.ofThe
                                                                                           properties           size and
                                                                                                            facing    of footing
                                                                                                                           footingis plate
                                                                                                                                     chosenareas
                                      185 mm
                                    given       × 1503.mm
                                           in Table          × 22
                                                        Figure     mm. The
                                                                 4 shows   the mechanical
                                                                                slope facingproperties
                                                                                              and footing  ofmodel
                                                                                                              facingused
                                                                                                                       and footing    plate are
                                                                                                                             in the study.
                                      given in Table 3. Figure 4 shows the slope facing and footing model used in the study.

                                    (a)                                                                              (b)
      Figure
 Figure        4. Slope
          4. Slope       facing
                    facing        details
                            details        and footing
                                     and footing       model.
                                                   model.       (a) Slope
                                                          (a) Slope       facing;
                                                                     facing;       (b) footing
                                                                             (b) footing model;model; 1: bearing
                                                                                                1: bearing ball; 2:ball; 2: welded
                                                                                                                    welded          stainless
                                                                                                                             stainless steel grooves;
      steelplates;
 3: steel   grooves;   3: steel
                   4: load  cell.plates; 4: load cell.

                                    Table 3. Properties of Facing and Footing Plate
                                     Table 3. Properties of Facing and Footing Plate.
                                                                                            Bending Stiff- Axial Stiff-
                                                        Width Thickness Young’s Modu-  Young’s       Bending       Axial
                                    Component                  Width    Thickness
                                      ComponentMaterial
                                                  Material(mm)   (mm)       lus (kPa) Modulus ness   Stiffness   ness
                                                                                                                 Stiffness
                                                               (mm)       (mm)
                                                                                        (kPa) (kN.mm(kN2·)mm2 )  (kN)
                                                                                                                   (kN)
                                      Facing
                                        Facing Perspex
                                                  Perspex  140  1405.0     5.0 4200      4200   0.04375
                                                                                                      0.04375    0.021
                                                                                                                   0.021
                                     Footing
                                       Footing  Steel
                                                   Steel 150    15022.0     21.2 × 10721.2 × 10188186.6
                                                                           22.0                7     188186.6   4665.78
                                                                                                                  4665.78

                                    2.3.
                                      2.3.Testing
                                            TestingBox
                                                     BoxandandLoading
                                                                 LoadingSystem
                                                                            System
                                           The
                                             The three dimensional modelconsisted
                                                three  dimensional         model       consistedofofthreethreemain
                                                                                                                 mainelements,
                                                                                                                         elements,  namely,
                                                                                                                                       namely,testing
                                                                                                                                                   testingbox,box,
                                    loading
                                      loadingsystem
                                                 systemand  andsandsandraining
                                                                          rainingsystem.
                                                                                     system.Following
                                                                                                   Followingthe   thesimilarity
                                                                                                                        similaritycriteria
                                                                                                                                      criteriadescribed
                                                                                                                                                  describedinin
                                    previous
                                      previoussection
                                                  sectionforforthe
                                                                 the material
                                                                      material and      dimensionsof
                                                                                  and dimensions           ofthe
                                                                                                              thetesting
                                                                                                                    testingbox,
                                                                                                                              box,ananopen
                                                                                                                                         open    frontal
                                                                                                                                              frontal       Per-
                                                                                                                                                         Perspex
                                    spex   box   measuring       1760  mm     × 850   mm     ×  1000   mm     was    used
                                      box measuring 1760 mm × 850 mm × 1000 mm was used for the experimental work. The      for the  experimental        work.
                                    The   loading
                                      loading       system
                                                 system    waswas mademade     of a loading
                                                                          of a loading     frame, frame,    a loading
                                                                                                     a loading     frameframe      basea hydraulic
                                                                                                                            base and      and a hydraulicloading
                                    loading    system.   The    loading    system    was     designed     to  prevent
                                      system. The loading system was designed to prevent any disturbance to the          any   disturbance      to the   nailed
                                                                                                                                                    nailed    soil
                                    soil  model.
                                      model.        A density
                                                A density           control
                                                              control         apparatus
                                                                        apparatus              was designed
                                                                                        was designed                that employs
                                                                                                            that employs               sand raining
                                                                                                                               sand raining      techniquestech-to
                                    niques    to get homogeneous
                                      get homogeneous          sand beds  sand   beds
                                                                             in the      in thebox
                                                                                      testing     testing
                                                                                                      andbox      and tothe
                                                                                                             to obtain      obtain  the required
                                                                                                                               required   relative relative
                                                                                                                                                       densities.
                                    densities.
                                      The sandThe      sanddevice
                                                   placing      placingcomprised
                                                                           device comprised
                                                                                         three main   three    main
                                                                                                          units,       units,sand
                                                                                                                   namely,      namely,     sand perforated
                                                                                                                                     spreader,      spreader,
                                    perforated
                                      plates, and  plates,  andsystem.
                                                     a driven      a drivenThe system.
                                                                                    sand The      sand spreader
                                                                                            spreader     consistedconsisted
                                                                                                                        mainly ofmainly       of a traveling
                                                                                                                                     a traveling      hopper to
                                    hopper     to discharge      sand    through     a  perforated      plate    fixed
                                      discharge sand through a perforated plate fixed to the bottom of the hopper and     to the  bottom     of   the hopper
                                                                                                                                                        a driven
                                    and   a driven
                                      system          system
                                                to control    thetomovement
                                                                     control theofmovement
                                                                                       the hopperofbackwards
                                                                                                          the hopperand    backwards
                                                                                                                              forwardsand        forwards
                                                                                                                                          at certain           at
                                                                                                                                                          speeds.
                                    certain
                                      In thisspeeds.    In this
                                               study, the          study,ofthe
                                                             intensity       theintensity
                                                                                   fall of theofsand
                                                                                                   the fall
                                                                                                        wasofcontrolled
                                                                                                                 the sand was       controlled
                                                                                                                              by changing       theby   chang-
                                                                                                                                                     size   of the
                                    ing  the size of
                                      perforated       theplate
                                                    base     perforated      base hopper
                                                                    of the sand     plate of andthe sand     hopper the
                                                                                                      by changing        andvelocity
                                                                                                                               by changing
                                                                                                                                        of thethe     velocity
                                                                                                                                                  hopper     over
                                    ofthe
                                       thetank.
                                            hopper After
                                                      over a series   of preliminary
                                                              the tank.    After a seriestests,      the size oftests,
                                                                                               of preliminary        perforations     was
                                                                                                                            the size of      chosen forwas
                                                                                                                                         perforations        each
                                      layer of
                                    chosen    for100
                                                  eachmm    thick.
                                                         layer       Figure
                                                                  of 100  mm5thick.
                                                                                 showsFigurethe loading
                                                                                                    5 shows  frame    and sand
                                                                                                                the loading        raining
                                                                                                                                frame    andsystem       used in
                                                                                                                                               sand raining
                                      the study.
                                    system     usedThe
                                                     in process
                                                          the study. of filling  the testing
                                                                          The process            box with
                                                                                             of filling    thesand
                                                                                                               testingis shown    in Figure
                                                                                                                           box with     sand 6. is The
                                                                                                                                                    shown density
                                                                                                                                                               in
                                      of the6.sand
                                    Figure      The bed     was of
                                                      density     measured
                                                                     the sandand  bed controlled
                                                                                        was measured   by placing      temporary
                                                                                                              and controlled      byaluminum          cylinders
                                                                                                                                       placing temporary
                                      with no cover
                                    aluminum             at locations
                                                   cylinders      with no(1–7)
                                                                             covershown       in Figure
                                                                                      at locations          5. The
                                                                                                        (1–7)   shown density   of sand
                                                                                                                           in Figure    5. in
                                                                                                                                            Thethedensity
                                                                                                                                                     filled tank
                                                                                                                                                               of
                                      was measured using the eight permanent cylinders placed at different levels and the box
                                      was emptied very carefully until each cylinder was exposed. The final densities of sand
                                      measured at various levels in the box are presented in Figure 7.
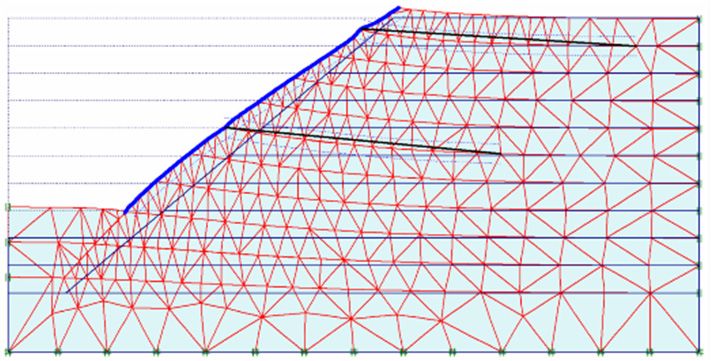
Pullout Behavior of Nail Reinforcement in Nailed Soil Slope
Appl.
   Appl.Sci.
         Sci.2021,
              2021,11,
                    11,xxFOR
                         FORPEER
                             PEERREVIEW
                                 REVIEW                                                                                                                      77of
                                                                                                                                                               of17
                                                                                                                                                                  17

                                           sand
                                            sand inin the
                                                       the filled
                                                            filled tank
                                                                    tank was
                                                                         was measured
                                                                             measured using
                                                                                        using the
                                                                                               the eight
                                                                                                   eight permanent
                                                                                                            permanent cylinders
                                                                                                                        cylinders placed
                                                                                                                                  placed at
                                                                                                                                          at dif-
                                                                                                                                              dif-
Appl. Sci. 2021, 11, 6419                  ferent
                                            ferentlevels
                                                    levelsandandthethebox
                                                                       boxwas
                                                                          wasemptied
                                                                              emptiedvery
                                                                                        verycarefully
                                                                                             carefullyuntil
                                                                                                          untileach
                                                                                                                eachcylinder
                                                                                                                     cylinderwas
                                                                                                                              wasexposed.
                                                                                                                                   exposed.TheThe
                                                                                                                                               7 of 16
                                           final
                                            final densities
                                                  densities of  of sand
                                                                   sand measured
                                                                         measured at
                                                                                  at various
                                                                                     various levels
                                                                                              levels in
                                                                                                      in the
                                                                                                          the box
                                                                                                              box are
                                                                                                                  are presented
                                                                                                                      presented in
                                                                                                                                 in Figure
                                                                                                                                    Figure 7.
                                                                                                                                           7.

                                            (a)
                                             (a)                                                                    (b)
                                                                                                                     (b)
                 Figure
               Figure 5.5.5.
                 Figure      Testing
                             Testing
                          Testing    box
                                   box   and
                                     boxand  loading
                                         andloading   frame
                                              loadingframe  including
                                                             includingsand
                                                       frameincluding  sandraining
                                                                      sand  rainingsystem;
                                                                            raining  system;(a)
                                                                                    system;   (a)Testing
                                                                                             (a)  Testingbox;
                                                                                                 Testing box;
                                                                                                          box;(b)
                                                                                                               (b) Loading
                                                                                                                   Loading
                                                                                                                 (b)       frame.
                                                                                                                     Loadingframe.
                                                                                                                              frame.

                 (a)
                  (a)                                    (b)
                                                          (b)                                     (c)
                                                                                                   (c)                                    (d)
                                                                                                                                           (d)

                 (e)
                  (e)                                    (f)
                                                          (f)                                     (g)
                                                                                                   (g)                                    (h)
                                                                                                                                           (h)
  Appl. Sci. 2021, 11, x FOR PEER REVIEW                                                                                                                    8 of 17
         Figure
      Figure  6. 6.
          Figure 6.Process
                    Process
                 Process     ofof  placing
                                ofplacing   the
                                   placingthe    sand
                                                  sandbeds;
                                             thesand    beds;(a)
                                                        beds;   (a)empty
                                                               (a)   emptytesting
                                                                    empty     testing box;
                                                                                      box;
                                                                                testing    (b)  sand
                                                                                            (b)(b)
                                                                                         box;    sand raining;
                                                                                                   sandraining; (c)
                                                                                                                 (c)levelling
                                                                                                          raining;   levelling sand bed;
                                                                                                                                     bed;(d)
                                                                                                                                sandsand
                                                                                                                      (c) levelling       (d)
                                                                                                                                          bed;first
                                                                                                                                               firstlayer;
                                                                                                                                                  (d)  first(e)
                                                                                                                                                     layer;  (e)
                                                                                                                                                             layer;
         second
          second layer;
                  layer; (f)
                          (f) third
                               third layer;
                                      layer; (g)
                                              (g) fourth
                                                   fourth layer;
                                                           layer; (h)
                                                                   (h) filled
                                                                        filled testing
                                                                                testing box.
                                                                                        box.
      (e) second layer; (f) third layer; (g) fourth layer; (h) filled testing box.

                                         Figure 7.
                                         Figure 7. Density
                                                   Densityobtained
                                                           obtainedatatvarious
                                                                        variousdepths
                                                                                depthsof of
                                                                                         sand  beds.
                                                                                            sand beds.

                                          2.4. Nailed Soil Slope Modeling
                                               The laboratory models with a scale of 1:10 and a soil slope of 400 were prepared to
                                          determine the pullout resistance of the nails at different footing pressures. The slope
                                          height (H) is taken as 700 mm. The construction of the slope-nailed system and loading
Pullout Behavior of Nail Reinforcement in Nailed Soil Slope
Appl. Sci. 2021, 11, 6419                                                                                                                                    8 of 16
                                          Figure 7. Density obtained at various depths of sand beds.

                                          2.4. Nailed Soil Slope Modeling
                                           2.4. The
                                                Nailed   Soil Slopemodels
                                                     laboratory      Modeling   with a scale of 1:10 and a soil slope of 400 were prepared to
                                                 The laboratory
                                          determine     the pullout  models
                                                                        resistancewith of
                                                                                        a scale of 1:10
                                                                                           the nails   at and   a soil slope
                                                                                                           different     footingof pressures.
                                                                                                                                    400 were prepared
                                                                                                                                                The slope  to
                                           determine
                                          height  (H) isthetaken
                                                             pullout   resistance
                                                                   as 700    mm. The of the  nails at different
                                                                                          construction    of thefooting      pressures.
                                                                                                                    slope-nailed          Theand
                                                                                                                                     system    slope  height
                                                                                                                                                    loading
                                           (H) is are
                                          stages  taken   as 700inmm.
                                                       shown             The8.construction
                                                                    Figure        The footingof    the slope-nailed
                                                                                                 pressure    is applied   system
                                                                                                                            on theand   loading
                                                                                                                                     slope nailed stages  are
                                                                                                                                                     system
                                          through a footing plate of a width (B) of 150 mm. The footing plate is placed at 1.5 timesa
                                           shown    in Figure    8. The   footing    pressure   is applied    on   the   slope  nailed  system   through
                                           footing
                                          the widthplate
                                                      of theof plate
                                                               a width
                                                                     (i.e.,(B)
                                                                             X of  150mm)
                                                                                = 225  mm.fromThe footing
                                                                                                   the crestplate
                                                                                                               of theis slope.
                                                                                                                        placedTheat 1.5 timesofthe
                                                                                                                                     length         width of
                                                                                                                                                horizontal
                                           the plate  (i.e., X = 225  mm)      from  the  crest of the slope.   The    length  of  horizontal
                                          nails (Ln) is taken to be equal to slope height (700 mm) in the models. The vertical spacing          nails (Ln) is
                                           taken
                                          (Sv) andtohorizontal
                                                      be equal to    slope height
                                                                   spacing     (Hv) of(700
                                                                                         nailsmm)   in the models.
                                                                                               are provided     as 0.4 Thetimesvertical  spacing
                                                                                                                                 the slope  height.(Sv)  and
                                                                                                                                                      Read-
                                           horizontal    spacing    (Hv)    of  nails are  provided    as  0.4 times     the slope
                                          ings for force and displacement in the nail are measured during the construction of the    height.  Readings    for
                                           force and   displacement      in   the   nail are measured     during     the   construction
                                          slope and after each increment of footing pressure (q) from 5.0, 10.0, 20.0, to 30.0 kPa.       of the  slope  and
                                           after each increment of footing pressure (q) from 5.0, 10.0, 20.0, to 30.0 kPa.

                        Stage 1                                               Stage 2                                           Stage 3

      excvate                                               excvate the second layer (140 mm) and put the       excvate the third layer (140 mm), put wall face,
Appl. Sci. 2021,the
                  11,first layerPEER
                       x FOR     (140 mm), put wall face,
                                      REVIEW                                                                                                                 9 of 17
       pull upper tube, hammer unmeasured nails and         second wall face pannel.                            pull middel tube, hammer unmeasured nails
      assign upper dail gauge                                                                                   and assign middel dail gauge

                            (a)                                                  (b)                                                 (c)

                          Stage 4                                   Stage 5

                                                             excvate the fifth layer (140 mm), put wall face,
       excvate the fourth layer (140 mm) and put the         pull lower tube, hammer unmeasured nails and
       fourth wall face pannel.                              assign lower dail gauge

                            (d)                                                   (e)                                                (f)
                                         Figure
                                         Figure 8.
                                                8. Construction
                                                   Constructionof
                                                                ofthe
                                                                   theslope-nailed
                                                                       slope-nailed system
                                                                                    system and
                                                                                           and loading
                                                                                                loading stages.
                                                                                                        stages.

                                           2.5.
                                            2.5.Pullout
                                                 PulloutTesting
                                                           Testing System
                                                                     System
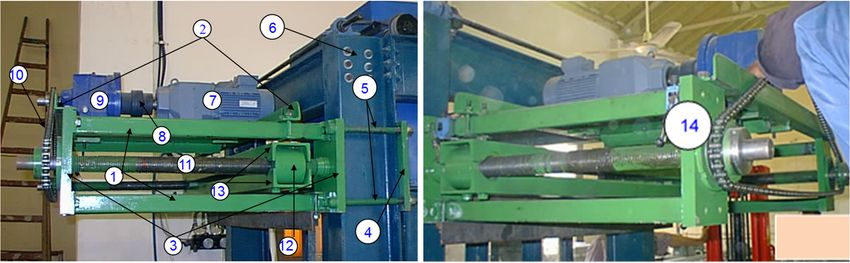
                                                 AA special systemisisdesigned
                                                    special   system         designedtotomeasure
                                                                                             measure  the  pull-out
                                                                                                         the  pull-outresistance
                                                                                                                         resistance  of of
                                                                                                                                         nails  as shown
                                                                                                                                            nails   as shown  in
                                           Figure   9. The
                                            in Figure    9. system
                                                              The systemconsisted    of a driven
                                                                              consisted             systemsystem
                                                                                           of a driven       and a and
                                                                                                                     load acell
                                                                                                                              loadto measure       the tensile
                                                                                                                                     cell to measure         the
                                           force.
                                            tensileThe   experimental
                                                     force.                set-up for
                                                             The experimental           the pullout
                                                                                     set-up           test in atest
                                                                                             for the pullout     nailed
                                                                                                                     in asoil  slope
                                                                                                                          nailed    soilisslope
                                                                                                                                           shown  is in Figure
                                                                                                                                                     shown     in
                                           10.  The  pull-out    test  was  carried   out according     to the  following
                                            Figure 10. The pull-out test was carried out according to the following steps:   steps:
                                           •• StepStep 1.
                                                        1. Adjust
                                                            Adjust the   height of
                                                                     the height    ofthe
                                                                                      thepulling
                                                                                          pullingsystem
                                                                                                    systemaccording
                                                                                                              accordingtoto thethe  position
                                                                                                                                 position    andand    inclina-
                                                                                                                                                   inclination
                                                 tion  of  the
                                                  of the nails;nails;
                                           •• StepStep 2.
                                                        2. Attach the the nail
                                                                          nailtotothe
                                                                                    thepulling
                                                                                         pullingbeam
                                                                                                   beam byby   means
                                                                                                           means        of wire
                                                                                                                    of wire   andand      locking
                                                                                                                                    locking    nut. nut.    The
                                                                                                                                                      The load
                                                 load   cell
                                                  cell is    is connected
                                                          connected     to thetowire
                                                                                  the wire  andpulling
                                                                                       and the    the pulling
                                                                                                           beam; beam;
                                           •• StepStep3.3.Adjust
                                                            Adjustthe thepulling
                                                                          pullingspeed
                                                                                    speedby bymeans
                                                                                                meansofofinverter
                                                                                                            inverterand
                                                                                                                      andPotentiometer
                                                                                                                            Potentiometerto      to300
                                                                                                                                                     300r.p.m,
                                                                                                                                                          r.p.m,
                                                 which
                                                  which corresponds
                                                           corresponds to   to aa horizontal
                                                                                  horizontal speed
                                                                                               speed ofof 0.282627
                                                                                                          0.282627 mm/min;
                                                                                                                      mm/min;
                                           •• StepStep4.4.Switch
                                                            Switchon  onthe
                                                                         theinverter
                                                                              inverterpower
                                                                                         powerandandmeasure
                                                                                                      measurethe  thepulling
                                                                                                                      pullingloadloadevery
                                                                                                                                         everytwo
                                                                                                                                                twoseconds
                                                                                                                                                       seconds
                                                 to
                                                  to give
                                                      give aa displacement
                                                               displacement interval
                                                                                  interval of
                                                                                            of 0.01
                                                                                                0.01 mm
                                                                                                      mm until
                                                                                                            until the
                                                                                                                   the stroke
                                                                                                                        stroke equal
                                                                                                                                 equal to  to 10
                                                                                                                                              10 mmmm or or the
                                                                                                                                                             the
                                                  reading of
                                                 reading     of the
                                                                 the load
                                                                      load cell
                                                                            cell become
                                                                                  become constant
                                                                                           constant with
                                                                                                      with the
                                                                                                             the increasing
                                                                                                                  increasing displacement.
                                                                                                                                displacement.
Pullout Behavior of Nail Reinforcement in Nailed Soil Slope
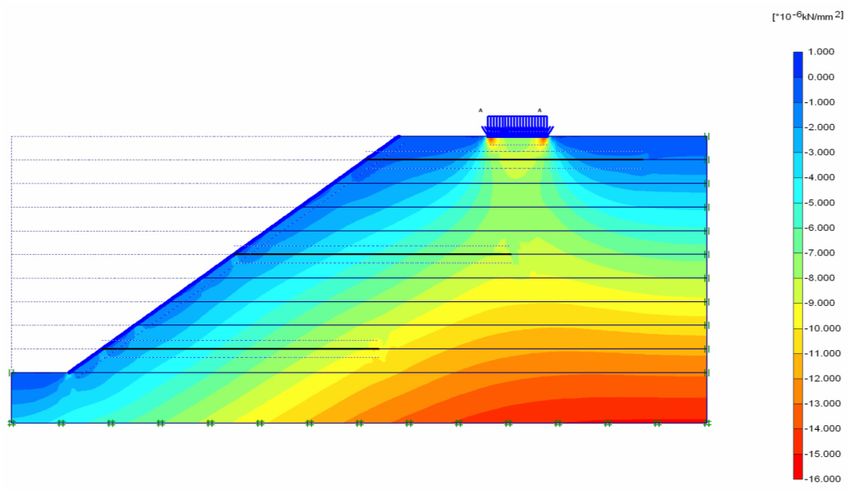
•     Step 2. Attach the nail to the pulling beam by means of wire and locking nut. The
                                          load cell is connected to the wire and the pulling beam;
                                    •     Step 3. Adjust the pulling speed by means of inverter and Potentiometer to 300 r.p.m,
                                          which corresponds to a horizontal speed of 0.282627 mm/min;
Appl. Sci. 2021, 11, 6419           •     Step 4. Switch on the inverter power and measure the pulling load every two seconds
                                                                                                                          9 of 16
                                          to give a displacement interval of 0.01 mm until the stroke equal to 10 mm or the
                                          reading of the load cell become constant with the increasing displacement.

      Figure
      Figure 9.9. Nail
                  Nail pullout
                        pullout system.
                                 system. 1:
                                         1: 44 Beams
                                               Beams of
                                                      of box
                                                         box section;
                                                             section; 2:
                                                                      2: 44 connected
                                                                             connectedangles;
                                                                                        angles;3:3:44plates
                                                                                                      plates280
                                                                                                             280×× 160
                                                                                                                   160 ×
                                                                                                                       × 25
                                                                                                                         25 mm;
                                                                                                                            mm; 4:
                                                                                                                                 4: 22 plates
                                                                                                                                       plates
      280
 Appl.280   × 160 ×  20
            × 16011,×x20
       Sci. 2021,       mm;
                         mm;
                       FOR   5: 8 screws
                                   screws 20 mm in diameter; 6: loading frame; 7: electrical gear motor; 8: coupling; 9: gear box;
                              5: 8REVIEW
                           PEER          20   mm  in diameter;  6: loading   frame; 7: electrical gear  motor; 8: coupling; 9: gear  box; 10:
                                                                                                                                          10:10 of 17
      chain; 11: two power screw rods; 12: two big nuts; 13: pulling beam; 14: two limit switch.
      chain; 11: two power screw rods; 12: two big nuts; 13: pulling beam; 14: two limit switch.

                                     Figure10.
                                     Figure 10. Experimental
                                                Experimentalset-up
                                                             set-upfor
                                                                    forpullout
                                                                       pullouttest.
                                                                               test.

                                     2.6. Finite
                                     2.6. Finite Element
                                                 Element Modeling
                                                         Modeling
                                           The
                                            Thefinite
                                                 finiteelement
                                                        elementmodel
                                                                  modelof ofnail-reinforced
                                                                             nail-reinforcedsoil   soilslopes
                                                                                                        slopeswas
                                                                                                                wasdeveloped
                                                                                                                       developedto   tovalidate
                                                                                                                                        validatethe
                                                                                                                                                  the
                                     laboratory
                                      laboratorymodel
                                                    modelresults.
                                                           results. The
                                                                     The nailed
                                                                          nailedsoil
                                                                                   soilslope
                                                                                         slopeparameters
                                                                                                 parametersused usedin inthe
                                                                                                                          themodel
                                                                                                                               modelare aregiven
                                                                                                                                             giveninin
                                     Table
                                      Table4.4.The
                                                ThePLAXIS-2D
                                                     PLAXIS-2Dcode codewas
                                                                         wasused
                                                                               usedto  todevelop
                                                                                          developaafinite
                                                                                                       finiteelement
                                                                                                               elementmodeling
                                                                                                                          modelingof   ofnailed
                                                                                                                                          nailedsoil
                                                                                                                                                  soil
                                     slopes
                                      slopes considering
                                              considering aa plane
                                                               planestrain
                                                                       straincondition.
                                                                               condition. The  The suitable
                                                                                                     suitable elements
                                                                                                                elements available
                                                                                                                             available ininPLAXIS
                                                                                                                                             PLAXIS
                                     were   used   to model   the  sand,  steel,  and   Perspex     glass  material.    The
                                      were used to model the sand, steel, and Perspex glass material. The 15-node triangular  15-node    triangular
                                     elements
                                      elements available
                                                  available in
                                                             in the
                                                                 the PLAXIS
                                                                      PLAXIScode codewere
                                                                                        wereemployed
                                                                                                employedfor   forsoil
                                                                                                                   soilmodeling.
                                                                                                                         modeling. The The15-node
                                                                                                                                             15-node
                                     triangle
                                      triangle element
                                                element with 12 nodes on the sides    sides and
                                                                                              and 33 nodes
                                                                                                      nodes on on the
                                                                                                                   theinside
                                                                                                                        insideof ofthe
                                                                                                                                    thetriangle
                                                                                                                                         triangleisisa
                                     aproven
                                        provenelement
                                                 elementtotogive
                                                              giveaa robust
                                                                      robust solution
                                                                               solution for for large
                                                                                                large deformation
                                                                                                        deformation geotechnical
                                                                                                                         geotechnical problems.
                                                                                                                                          problems.
                                     The
                                      Thefive
                                           fivenode
                                                nodeplate
                                                       plateelements
                                                             elementswere
                                                                        wereusedusedforforfooting
                                                                                            footingmodeling.
                                                                                                      modeling.The  Thetwo
                                                                                                                         twonode
                                                                                                                               nodeelastic
                                                                                                                                      elasticspring
                                                                                                                                               spring
                                     elements
                                      elements were used to model nail reinforcements. The interface elements were usedto
                                                 were   used  to  model   nail  reinforcements.        The  interface    elements     were   used   to
                                     model
                                      modelthetheinteraction
                                                   interactionbetween
                                                                betweenthe thecomponent
                                                                                componentof     ofthe
                                                                                                    thenailed
                                                                                                         nailedsoil
                                                                                                                 soilslope.
                                                                                                                       slope.A Anonlinear
                                                                                                                                  nonlinearelastic
                                                                                                                                               elastic
                                     (Hyperbolic)
                                      (Hyperbolic) model
                                                      model was
                                                              wasused
                                                                    usedtotosimulate
                                                                             simulatethe   thesand
                                                                                                sandmaterial.
                                                                                                       material.TheThesoil
                                                                                                                         soilparameters
                                                                                                                               parametersused usedinin
                                     the   material  model   are  given  in Table    5.  The   discretized    nailed   soil  slope
                                      the material model are given in Table 5. The discretized nailed soil slope finite element     finite  element
                                     model
                                      model with
                                              with boundary
                                                     boundary conditions
                                                                  conditions isis shown
                                                                                   shown in  inFigure
                                                                                                 Figure11.11. The
                                                                                                              Thepublished
                                                                                                                     publishedliterature
                                                                                                                                  literatureby bythe
                                                                                                                                                  the
                                     authors   [23] presents  the  validation   results   obtained    by  the soil  slope  finite
                                      authors [23] presents the validation results obtained by the soil slope finite element mod- element    models.
                                      els.

                                     Table 4. Nailed soil slope parameters.

                                                    A    B    Y    Z    X  Sh = Sv Slope Nail Incli- H = Ln RD
                                      Parameter                                                                q (kPa)
                                                  (mm) (mm) (mm) (mm) (mm) (mm) Angle (°) nation (°) (mm) (%)
                                                                                                                5, 10,
                                        Value      405 150 834 146 225       280     40       0       700   48
                                                                                                                20, 30
Pullout Behavior of Nail Reinforcement in Nailed Soil Slope
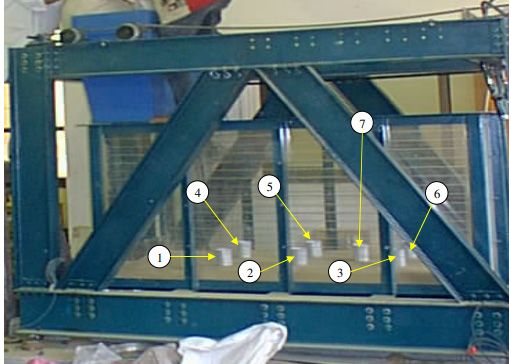
Appl. Sci. 2021, 11, 6419                                                                                                                            10 of 16

                                                            Table 4. Nailed soil slope parameters.

                              B       Y             Z             X       Sh = Sv       Slope               Nail              H = Ln       RD         q
 Parameter A (mm)
                            (mm)    (mm)          (mm)          (mm)       (mm)        Angle (◦ )      Inclination (◦ )       (mm)         (%)      (kPa)
                                                                                                                                                    5, 10,
   Value         405         150     834              146        225        280           40                   0               700         48
                                                                                                                                                    20, 30
      A—Soil width beyond the footing; B—footing width; Y—soil width beyond the toe of slope; Z— soil base depth below the slope; X—distance
      of footing from crest; Sv—nail vertical spacing; Sh—nail horizontal spacing; H—excavation height; Ln—nail length; RD—relative density
      of the sand; q —footing pressure.

                                    Table 5. Material Model Parameters for granular material (Sand).

     Bulk                    Material Model                       Plastic Straining   Plastic Straining                      Elastic            Stress De-
   Density                  (Mohr-Coulomb)                        Due to Deviator     Due to Primary               Unloading/Reloading           pendent
   (kN/m3 )                    C                                  Loading (E50 )ref   Comp. (Eoed )ref              (Eur )ref                   Stiffness
                    ϕ                  ψ                υ                                                                            υur
                             (kPa)                                      (kPa)               (kPa)                    (kPa)                         (m)
 Appl. Sci. 2021, 11, x FOR PEER REVIEW                                                                                                               11 of 17
    16.41           34        0.2        4             0.31             1959                1959                     5877         0.2               0.5

                                     Figure11.
                                    Figure  11.Discretized
                                               Discretizedfinite
                                                           finiteelement
                                                                  elementmodel
                                                                         modelof
                                                                               ofnailed
                                                                                  nailedsoil
                                                                                         soilslope.
                                                                                              slope.

                                    3.3. Results
                                         Results and and Discussion
                                                           Discussion
                                           The
                                            The laboratory
                                                    laboratory and and finite
                                                                         finite element
                                                                                 element models,
                                                                                             models, constructed
                                                                                                          constructed and   and discussed
                                                                                                                                   discussed above,
                                                                                                                                                above, areare
                                    tested    to  investigate     the  performance      of the   nailed   soil  slope   under
                                     tested to investigate the performance of the nailed soil slope under overburden pressure.    overburden      pressure.
                                    Figure
                                     Figure12  12shows
                                                     showsthe themobilization
                                                                    mobilizationof  ofthe
                                                                                        thepullout
                                                                                              pulloutforce
                                                                                                         forcein  innails
                                                                                                                      nailsplaced
                                                                                                                              placedatatdifferent
                                                                                                                                          differentlevels
                                                                                                                                                      levels
                                    within
                                     withinthe thesoil
                                                     soilslope
                                                           slope(upper,
                                                                   (upper,middle,
                                                                             middle,andandlower
                                                                                             lowernail)
                                                                                                      nail)ininthe
                                                                                                                 thecase
                                                                                                                      caseof  ofno
                                                                                                                                 nofooting
                                                                                                                                    footingwithout
                                                                                                                                             withoutany  any
                                    overburden
                                     overburden pressure
                                                       pressure and and atat an
                                                                              an overburden
                                                                                 overburden pressure
                                                                                                   pressure of  of 55 kN
                                                                                                                       kN andand1010kN.
                                                                                                                                      kN.ItItcan
                                                                                                                                              canbe beseen
                                                                                                                                                        seen
                                    from
                                     fromthe thefigures
                                                   figuresthat
                                                             thatthe
                                                                   thepullout
                                                                        pulloutforce
                                                                                  forceininthe
                                                                                            the nails
                                                                                                  nails increases
                                                                                                         increases as  as the
                                                                                                                           the displacement
                                                                                                                                displacement increases.
                                                                                                                                                 increases.
                                    However,
                                     However, the increase in the pullout force is not same in the nails of different levelsand
                                                    the  increase    in the  pullout   force   is not  same     in  the nails    of different  levels    and
                                    the
                                     themaximum
                                           maximum pullout pullout force
                                                                      forceisisalso
                                                                                alsodifferent
                                                                                     differentatatlow lowvalues
                                                                                                            valuesofofoverburden
                                                                                                                           overburdenpressures.
                                                                                                                                           pressures.The The
                                    pullout
                                     pulloutforceforcereaches
                                                         reachesits itsmaximum
                                                                        maximumvalue valuerapidly
                                                                                              rapidlyin  inlower
                                                                                                             lowernails
                                                                                                                      nailsbutbutininupper
                                                                                                                                      upperandandmiddle
                                                                                                                                                     middle
                                    nails
                                     nailsititreaches
                                                reachesitsitsmaximum
                                                                 maximum    value  slowly,
                                                                               value  slowly,having    no or
                                                                                                  having     noa orlower    overburden
                                                                                                                      a lower              pressure.
                                                                                                                                  overburden           This
                                                                                                                                                  pressure.
                                    may    be  due    to  the change    of  over  burden    pressures      which    contribute
                                     This may be due to the change of over burden pressures which contribute to pullout re-        to pullout   resistance.
                                    The    pullout
                                     sistance.     Theforce   slightly
                                                         pullout         decreases
                                                                     force  slightly after  reaching
                                                                                      decreases      afterthe  peak and
                                                                                                            reaching      thethen
                                                                                                                                peakbecome    constant
                                                                                                                                       and then     becomein
                                    lower    nails,   while   it becomes     constant    immediately       in  the   case   of
                                     constant in lower nails, while it becomes constant immediately in the case of middle and  middle    and upper    nails
                                    after
                                     upper  reaching     thereaching
                                               nails after    peak value. the It canvalue.
                                                                               peak   be observed
                                                                                               It can befrom    the figure
                                                                                                           observed      from  that
                                                                                                                                 thethe  ratethat
                                                                                                                                      figure  of increase
                                                                                                                                                    the rate
                                    of
                                     of increase of the pullout force becomes almost the same in the upper, middle,nails,
                                         the pullout     force   becomes     almost  the   same    in the   upper,    middle,     and  lower          with
                                                                                                                                                 and lower
                                    further increase of overburden pressure.
                                     nails, with further increase of overburden pressure.

                                               14.0
                                                                                                     Lower Nail
                                               12.0                                                  Middle Nail
                                                                                                     Upper Nail
                                               10.0
                                      ce (N)

                                                8.0
nails it reaches its maximum value slowly, having no or a lower overburden pressure.
                                    This may be due to the change of over burden pressures which contribute to pullout re-
                                    sistance. The pullout force slightly decreases after reaching the peak and then become
                                    constant in lower nails, while it becomes constant immediately in the case of middle and
  Appl. Sci. 2021, 11, 6419
                                    upper nails after reaching the peak value. It can be observed from the figure that the11rate
                                                                                                                             of 16
                                    of increase of the pullout force becomes almost the same in the upper, middle, and lower
                                    nails, with further increase of overburden pressure.

                                                     14.0
                                                                                                                                 Lower Nail
                                                     12.0                                                                        Middle Nail
                                                                                                                                 Upper Nail
                                                     10.0

                                     Force (N)
                                                       8.0
                                                       6.0
                                                       4.0
                                                       2.0
                                                       0.0
Appl. Sci. 2021, 11, x FOR PEER REVIEW
                                                          0.00          1.00      2.00               3.00            4.00        5.00          6.00   12 of 17
                                                                                   displacement (mm)
                                                                                          (a)
                                                     14.0

                                                     12.0

                                                     10.0
                                     Force (N)

                                                      8.0

                                                      6.0

                                                      4.0                                                                     Lower Nail
                                                                                                                              Middle Nail
                                                      2.0
                                                                                                                              Upper Nail
                                                      0.0
                                                         0.00    0.50     1.00    1.50     2.00               2.50     3.00      3.50       4.00
                                                                                   displacement (mm)
                                                                                         (b)
                                                     20.0
                                                     18.0
                                                     16.0
                                                     14.0
                                                     12.0
                                         Force (N)

                                                     10.0
                                                      8.0
                                                      6.0                                                                     Lower Nail
                                                      4.0                                                                     Middle Nail
                                                      2.0                                                                     Upper Nail
                                                      0.0
                                                         0.00    0.50      1.00   1.50     2.00               2.50     3.00      3.50       4.00
                                                                                   displacement (mm)

                                                                                         (c)
                                  Figure 12.12.
                                    Figure   Pullout force
                                                Pullout    of of
                                                        force nails with
                                                                 nails   displacement;
                                                                       with            (a)(a)
                                                                            displacement;  q =q0=Kn; (b)(b)
                                                                                                  0 kN;  q =q5=kN; (c) (c)
                                                                                                                5 kN;  q =q10= kN.
                                                                                                                               10 kN.

                                       TheThe   relationship
                                             relationship       between
                                                             between     thethe displacement
                                                                              displacement     of of
                                                                                                   thethe  nail
                                                                                                        nail   andand
                                                                                                                    thethe   pullout
                                                                                                                          pullout       force
                                                                                                                                     force   at at three
                                                                                                                                                three
                                    different
                                  different     levels
                                             levels  of of nails
                                                        nails    (upper,
                                                               (upper,      middle,
                                                                          middle,      and
                                                                                     and    lower)
                                                                                          lower)   andand   with
                                                                                                         with      footing
                                                                                                                 footing      pressure
                                                                                                                            pressure    ofof   20.0
                                                                                                                                            20.0  kPakPa
                                    and
                                  and    30.0
                                       30.0 kPakPaareare presented
                                                      presented    in in  Figure
                                                                       Figure   13.13. From
                                                                                     From  thethe  figures,
                                                                                                figures,      it can
                                                                                                           it can  bebe   seen
                                                                                                                       seen     that
                                                                                                                              that  thethe  maximum
                                                                                                                                         maximum
                                    value
                                  value  of of
                                            thethe pullout
                                                 pullout      force
                                                           force  is is reached
                                                                     reached       gradually
                                                                                gradually    in in
                                                                                                 thethe upper
                                                                                                      upper       nails
                                                                                                               nails  andand   rapidly
                                                                                                                            rapidly    ininthethe  other
                                                                                                                                                other
                                    two  nails.  In  the lower   and    middle   nails,  the rate  of  increase    of pullout
                                  two nails. In the lower and middle nails, the rate of increase of pullout force is very steep  force   is very   steep
                                    and   becomes     constant   after   reaching     the peak    value.    There   is  a  large
                                  and becomes constant after reaching the peak value. There is a large difference in the mo-      difference      in the
                                    mobilized     peak   value  of  the  pullout    force of lower    nails,  and   the   pullout
                                  bilized peak value of the pullout force of lower nails, and the pullout forces of upper and        forces   of upper
                                    and middle
                                  middle            nails.difference
                                           nails. This      This difference
                                                                       is moreisthan
                                                                                   more100%
                                                                                          thanfrom
                                                                                                 100%the from    the pullout
                                                                                                             pullout    force offorce    of the upper
                                                                                                                                   the upper      and
                                    and  middle
                                  middle nails.    nails.

                40.0                                                                                       40.0

                35.0                                                                                       35.0

                30.0                                                                                       30.0

                25.0                                                                                       25.0
                                                                                               Force (N)
    Force (N)

                20.0                                                                                       20.0

                15.0                                                                                       15.0
and 30.0 kPa are presented in Figure 13. From the figures, it can be seen that the maximum
                                                                    value of the pullout force is reached gradually in the upper nails and rapidly in the other
                                                                    two nails. In the lower and middle nails, the rate of increase of pullout force is very steep
                                                                    and becomes constant after reaching the peak value. There is a large difference in the mo-
Appl. Sci. 2021, 11, 6419                                           bilized peak value of the pullout force of lower nails, and the pullout forces of upper   and
                                                                                                                                                           12 of 16
                                                                    middle nails. This difference is more than 100% from the pullout force of the upper and
                                                                    middle nails.

                 40.0                                                                                                           40.0

                 35.0                                                                                                           35.0

                 30.0                                                                                                           30.0

                 25.0                                                                                                           25.0

                                                                                                                    Force (N)
     Force (N)

                 20.0                                                                                                           20.0

                 15.0                                                                                                           15.0

                 10.0                                                                          Lower Nail                       10.0                                                   Lower Nail
                                                                                               Middle Nail                                                                             Middle Nail
                  5.0                                                                          Upper Nail                        5.0                                                   Upper Nail
                  0.0                                                                                                            0.0
                     0.00   0.50                      1.00   1.50     2.00   2.50      3.00       3.50       4.00                   0.00    1.00        2.00     3.00      4.00        5.00          6.00
                                                              displacement (mm)                                                                            displacement (mm)
Appl. Sci. 2021, 11, x FOR PEER REVIEW                                                                                                                                                               13 of 17
                                                                    (a)                                                                                        (b)
                                                          Figure 13.
                                                          Figure 13. Pullout
                                                                     Pullout force
                                                                             force of
                                                                                   of nails
                                                                                      nails with
                                                                                            with displacement;
                                                                                                 displacement; (a)
                                                                                                                (a) qq == 20
                                                                                                                          20 kN;
                                                                                                                             kN; (b)
                                                                                                                                 (b) qq =
                                                                                                                                        = 30
                                                                                                                                          30 kN.
                                                                                                                                             kN.

                                                                      Figure
                                                                       Figure 14 14 shows
                                                                                    shows thethe influence
                                                                                                  influence of   of the
                                                                                                                      the nail
                                                                                                                           nail level
                                                                                                                                 level atat different
                                                                                                                                             different footing
                                                                                                                                                          footing pressures
                                                                                                                                                                     pressures on  on the
                                                                                                                                                                                       the
                                                                maximum
                                                                 maximum pullout force of the nail. From this figure, it could be seen that the lower nail
                                                                               pullout  force   of the   nail.   From     this  figure,   it could    be   seen   that  the  lower    nail
                                                                exerts
                                                                 exertsmore
                                                                         more pull-out
                                                                                 pull-outforce
                                                                                            force than
                                                                                                    than the
                                                                                                           the middle
                                                                                                                 middle nail nail and
                                                                                                                                   and the
                                                                                                                                         the least
                                                                                                                                               least pull-out
                                                                                                                                                      pull-out force
                                                                                                                                                                   force occurs
                                                                                                                                                                          occurs at at the
                                                                                                                                                                                       the
                                                                upper    nail.  This  may    be  attributed      to   the  fact  that   the  lower    nail
                                                                 upper nail. This may be attributed to the fact that the lower nail has more overburden      has   more    overburden
                                                                pressure
                                                                 pressure than
                                                                             thanthethemiddle
                                                                                         middleand  andthetheupper
                                                                                                                 uppernail.    Moreover,
                                                                                                                           nail.    Moreover,   thethe
                                                                                                                                                    figure    indicated
                                                                                                                                                         figure    indicatedthatthat
                                                                                                                                                                                  the the
                                                                                                                                                                                        in-
                                                                fluence   of  footing   pressure     on  the   pullout     force   is steep,    increasing
                                                                 influence of footing pressure on the pullout force is steep, increasing in the lower nail but in  the  lower   nail   but
                                                                slowly
                                                                 slowlyincreasing
                                                                          increasing or or becoming
                                                                                           becoming constant
                                                                                                          constant in   in case
                                                                                                                            case of
                                                                                                                                  of the
                                                                                                                                      the middle
                                                                                                                                           middle and and upper
                                                                                                                                                            upper nail.
                                                                                                                                                                     nail. The
                                                                                                                                                                             The reason
                                                                                                                                                                                   reason
                                                                for
                                                                 for this is that the lower nail has little movement, and these movements are enough
                                                                     this is  that  the lower    nail   has   little   movement,       and    these   movements         are  enough to   to
                                                                mobilize
                                                                 mobilizethe themaximum
                                                                                  maximumfriction
                                                                                                frictionforce
                                                                                                           forceand  and hence
                                                                                                                           hence thethe pullout
                                                                                                                                         pullout resistance
                                                                                                                                                    resistance and  and does
                                                                                                                                                                          does not
                                                                                                                                                                                 not lose
                                                                                                                                                                                      lose
                                                                its
                                                                 its value
                                                                     value rapidly.
                                                                            rapidly. Nevertheless,
                                                                                        Nevertheless, in   in the
                                                                                                               the other
                                                                                                                      other two
                                                                                                                             two cases,
                                                                                                                                    cases, the
                                                                                                                                             the maximum
                                                                                                                                                   maximum values values are
                                                                                                                                                                           are reached
                                                                                                                                                                                 reached
                                                                after
                                                                 aftersome
                                                                        sometimetimeand
                                                                                      andgradually
                                                                                            graduallylose  losetheir
                                                                                                                   theirvalues
                                                                                                                           values in in
                                                                                                                                      a short
                                                                                                                                         a short time.  However,
                                                                                                                                                    time.    However,  the the
                                                                                                                                                                            pullout    be-
                                                                                                                                                                                  pullout
                                                                havior
                                                                 behaviorof nail  reinforcement
                                                                             of nail  reinforcement   is affected
                                                                                                          is affected  by abynumber
                                                                                                                               a number   of factors    andand
                                                                                                                                               of factors     the the
                                                                                                                                                                    present   study
                                                                                                                                                                         present        re-
                                                                                                                                                                                    study
                                                                sults  are compared      with   the   existing     literature   results.   Similar    trends
                                                                 results are compared with the existing literature results. Similar trends between the results  between      the  results
                                                                were
                                                                 were observed
                                                                        observed by  by Hong
                                                                                        Hong et et al.
                                                                                                   al. [6]
                                                                                                        [6] for
                                                                                                             for the
                                                                                                                  the pullout
                                                                                                                        pullout behavior
                                                                                                                                   behavior of  of nail
                                                                                                                                                   nail reinforcement
                                                                                                                                                         reinforcement in    in aa nailed
                                                                                                                                                                                   nailed
                                                                soil
                                                                 soilslope.
                                                                      slope.

                                                 40

                                                                                  Upper nail
                                                 35

                                                                                  Middel nail
                                                 30
                                                                                  Lower nail

                                                 25
                            Pull out Force (N)

                                                 20

                                                 15

                                                 10

                                                 5

                                                 0
                                                      0               5                10                    15                        20          25                30           35

                                                                                                         Footing Pressure (kPa)

                                                             Figure14.
                                                             Figure     Maximumpullout
                                                                    14. Maximum pulloutforce
                                                                                        force in
                                                                                               in nails
                                                                                                  nails at
                                                                                                        at different
                                                                                                           different footing
                                                                                                                     footing pressures.
                                                                                                                             pressures.

                                                                      Finite element
                                                                      Finite element models
                                                                                     models were
                                                                                             wereanalyzed
                                                                                                   analyzedfor
                                                                                                             forthe deformed
                                                                                                                  the deformed shape  of aofnailed
                                                                                                                                  shape            soil soil
                                                                                                                                             a nailed   slope  dur-
                                                                                                                                                             slope
                                                                 ing the construction stage and loading stage, and   for footing settlement   at various
                                                                during the construction stage and loading stage, and for footing settlement at various     footing
                                                                footing pressures. The vertical and shear stress results are also obtained during the con-
                                                                struction stage and loading stages. The results obtained from both laboratory and finite
                                                                element models were compared at footing pressures of 0, 5, 10, 20 and 30 kPa. Figure 15
                                                                shows the deformed shape of the system during the construction stage and the loading
0
                       0          5                10               15            20             25             30              35

                                                                Footing Pressure (kPa)

                            Figure 14. Maximum pullout force in nails at different footing pressures.
Appl. Sci. 2021, 11, 6419                                                                                                                          13 of 16
                                    Finite element models were analyzed for the deformed shape of a nailed soil slope
                               during the construction stage and loading stage, and for footing settlement at various
                               footing pressures. The vertical and shear stress results are also obtained during the con-
                                    pressures. The vertical and shear stress results are also obtained during the construction
                               struction stage and loading stages. The results obtained from both laboratory and finite
                                    stage and loading stages. The results obtained from both laboratory and finite element
                               element   models
                                    models   werewere compared
                                                  compared        at footing
                                                             at footing      pressures
                                                                        pressures of 0, of 0, 5,2010,
                                                                                        5, 10,     and2030
                                                                                                         and 30 Figure
                                                                                                           kPa. kPa. Figure  15 the
                                                                                                                       15 shows
                               shows   the deformed  shape  of the system   during the  construction     stage and the
                                    deformed shape of the system during the construction stage and the loading stage.  loading
                               stage.

Appl. Sci. 2021, 11, x FOR PEER REVIEW                                                                                                            14 of 17

                                                              (a)

                                                                     (b)

                                                                     (c)

                                                                     (d)

                                                                     (e)
                                      Figure
                                       Figure15.
                                               15.Deformed
                                                   Deformed   shape
                                                                 shapeof of
                                                                          thethe
                                                                              nailed  soilsoil
                                                                                 nailed    system   during
                                                                                               system         the construction
                                                                                                         during                and and
                                                                                                                  the construction  loading     stage;stage;
                                                                                                                                            loading     (a)
                                      deformed   shape
                                       (a) deformed      (stage
                                                     shape      1); (b)
                                                             (stage      deformed
                                                                     1); (b) deformedshape
                                                                                        shape(stage  3);3);
                                                                                                (stage   (c)(c)
                                                                                                             deformed
                                                                                                                deformedshape (stage
                                                                                                                          shape (stage4);4);(d)
                                                                                                                                             (d)deformed
                                                                                                                                                 deformed
                                      shape
                                       shape(stage
                                              (stage5);
                                                     5);(e)
                                                         (e)deformed
                                                             deformedshapeshape(stage
                                                                                 (stage6,6,qq==3030kPa).
                                                                                                    kPa).

                                            Table
                                              Table66represents
                                                      representsaacomparison
                                                                   comparisonof      ofthe
                                                                                        thefooting
                                                                                            footingsettlement
                                                                                                      settlementobtained,
                                                                                                                 obtained,ininterms
                                                                                                                                termsofofthe
                                                                                                                                          the
                                      fraction
                                       fractionofofthe
                                                    theslope
                                                        slope height
                                                              height (S/H),
                                                                     (S/H),i.e.,i.e.,vertical
                                                                                      verticalsettlement/slope
                                                                                               settlement/slopeheight,
                                                                                                                  height,ininthe
                                                                                                                              thelaboratory
                                                                                                                                  laboratory
                                      and
                                       andcomputational
                                             computationalmodels.
                                                             models.ItItisisclear
                                                                             clearfrom
                                                                                    fromthe
                                                                                          thetable
                                                                                              tablethat
                                                                                                     thatthe
                                                                                                          themaximum
                                                                                                             maximumfooting
                                                                                                                        footingsettlement
                                                                                                                                  settlement
                                      occurs at a surcharge load exerting a foundation pressure of 30.0 kN/m2 in both the mod-
                                      els. It can be inferred from the table that the laboratory model underestimates the footing
                                      settlements. The percentage of difference in settlement between the laboratory and nu-
                                      merical model ranges from 13.37% to 40.59%.
Appl. Sci. 2021, 11, 6419                                                                                                                      14 of 16

                                    occurs at a surcharge load exerting a foundation pressure of 30.0 kN/m2 in both the
                                    models. It can be inferred from the table that the laboratory model underestimates the
                                    footing settlements. The percentage of difference in settlement between the laboratory and
                                    numerical model ranges from 13.37% to 40.59%.

                                    Table 6. Comparison of footing settlement obtained in laboratory and computational models.

                                             Footing pressure (kPa)                         0           5            10           20           30
                                           Footing settlement (Lab., %)                     0          0.29         0.46          0.8         1.45
                                          Footing settlement (Comp., %)                     0         0.265          0.5         1.13         1.95

Appl. Sci. 2021, 11, x FOR PEER REVIEW                                                                                                        15 of 17
Appl. Sci. 2021, 11, x FOR PEER REVIEW    Figures 16–18 depict the vertical, horizontal and shear stresses during the construction             15 of 17
                                    stage and loading stages. It infers from the figures that vertical stresses increased with
                                    the depth and decreased under the slope with the excavation process and then in loading
                                   stages
                                    stages vertical
                                              vertical stresses
                                                         stresses increased.
                                                                   increased. The Theincrease
                                                                                       increasein invertical
                                                                                                     verticalstress
                                                                                                                stressisis reduced
                                                                                                                            reduced as as we
                                                                                                                                          we gogo far
                                                                                                                                                    far
                                   stages     vertical   stresses  increased.    The  increase   in  vertical  stress  is reduced      as we   go   far
                                   from
                                    from the
                                           the footing.
                                                 footing. The
                                                            The horizontal
                                                                  horizontal stresses
                                                                               stresses increase
                                                                                         increase gradually
                                                                                                    gradually with
                                                                                                                 with the
                                                                                                                        the depth
                                                                                                                              depth and
                                                                                                                                      and increases
                                                                                                                                           increases
                                   from the footing. The horizontal stresses increase gradually with the depth and increases
                                    as we
                                   as   we gogo far
                                                 far from
                                                      from the
                                                             the slope
                                                                 slope face.
                                                                         face. These
                                                                               These stresses
                                                                                       stresses increase
                                                                                                 increase with
                                                                                                            with the
                                                                                                                   the excavation
                                                                                                                        excavation process
                                                                                                                                       process then
                                                                                                                                                 then
                                   as we go far from the slope face. These stresses increase with the excavation process then
                                    in the
                                   in   the loading
                                             loading stages.
                                                        stages. The
                                                                 Theshear
                                                                      shearstresses
                                                                              stresses increase
                                                                                        increase near
                                                                                                   near the
                                                                                                         the top
                                                                                                              top surface
                                                                                                                   surface of of the
                                                                                                                                 the sand
                                                                                                                                      sand bed
                                                                                                                                            bed and
                                                                                                                                                  and
                                   in the loading stages. The shear stresses increase near the top surface of the sand bed and
                                    facethe
                                   face   theslope
                                                slopeasaswell
                                                            wellasasnear
                                                                     near   and
                                                                          and     under
                                                                               under   thethe  footing,
                                                                                           footing,      while
                                                                                                      while       within
                                                                                                              within   the the
                                                                                                                             soilsoil  nailing
                                                                                                                                  nailing  mass mass
                                                                                                                                                   the
                                   face the slope as well as near and under the footing, while within the soil nailing mass the
                                    the values
                                   values          are almost
                                              are almost         the same.
                                                             the same.    ZeroZero
                                                                                shearshear  stresses,
                                                                                       stresses,      which
                                                                                                  which         are typically
                                                                                                           are typically          developed
                                                                                                                             developed          at the
                                                                                                                                           at the   re-
                                   values are almost the same. Zero shear stresses, which are typically developed at the re-
                                    reinforced
                                   inforced        mass,
                                                mass,       indicates
                                                         indicates   thethe  changesinindirection
                                                                           changes        directionofofshear
                                                                                                          shearstresses
                                                                                                                  stressesandandshould
                                                                                                                                   should occur
                                                                                                                                            occur at at
                                   inforced mass, indicates the changes in direction of shear stresses and should occur at
                                    these   locations.    In  loading  stages,   the shear  stresses  are  increased     with
                                   these locations. In loading stages, the shear stresses are increased with the increase in thethe increase   in  the
                                   these locations. In loading stages, the shear stresses are increased with the increase in the
                                    overburden pressure.
                                   overburden        pressure.
                                   overburden pressure.

                                 (a)                                                                        (b)
                                 (a)                                                                        (b)
                Figure
                Figure16.
                       16.Vertical
                           Vertical stress
                                    stress during
                                           during construction
                                                  construction and loading stage; (a) construction stage; (b) loading stage.
                Figure 16. Vertical stress during construction and
                                                               and loading stage; (a) construction stage; (b) loading stage.

                                  (a)                                                                         (b)
                                  (a)                                                                         (b)
            Figure 17. Horizontal stress during the construction and loading stage; (a) construction stage; (b) loading stage.
            Figure 17. Horizontal
                       Horizontal stress during the construction and loading stage; (a) construction stage; (b) loading stage.
Appl. Sci. 2021, 11, 6419                                                                                                        15 of 16
                                 (a)                                                                 (b)
            Figure 17. Horizontal stress during the construction and loading stage; (a) construction stage; (b) loading stage.

                                  (a)                                                                (b)
               Figure 18. Shear stress during the construction and loading stage; (a) construction
                                                                                      construction stage;
                                                                                                   stage; (b)
                                                                                                          (b) loading
                                                                                                              loading stage.
                                                                                                                      stage.

                                   4. Conclusions
                                         In this study, nail pullout tests were conducted to assess the pullout behavior of soil
                                   nail reinforcement at different levels in granular materials. The laboratory models of nailed
                                   soil systems of granular with a scale of 1:10 were prepared. The construction sequence
                                   used in a full scale slope was precisely followed in the laboratory model. The construction
                                   of the nailed soil slope system models, loading stages and pullout testing procedures were
                                   clearly defined. The models consisted of a Perspex wall box filled with sand and steel bars
                                   as a reinforcement. The models of sand beds were formed using an automatic sand raining
                                   system. The devices and instruments were installed to record the nail pullout resistance
                                   and displacement. The tests were carried out at variable footing pressure to get the pullout
                                   force of the nails, with a strain controller taking horizontal speed at 0.3 mm/min. The finite
                                   element models of nailed soil slope were also analyzed to validate the laboratory model
                                   results.
                                         The following conclusions may be drawn from the present study.
                                   •    The pullout force was increased as the displacement of the nail increased until it
                                        reached the maximum pullout force and then decreased or became constant;
                                   •    The lower nail exerted a greater pullout force than the middle nail and the least pull-
                                        out force occurred at the upper nail. This may be attributed to the fact that the lower
                                        nail had a greater overburden pressure than the middle and the upper nails;
                                   •    There was a steep increase in the pullout force in the lower nail with an increase in the
                                        footing pressure, whereas in case of the middle nail, there was a slight increase with
                                        the increase in footing pressure;
                                   •    In the upper nail, the rate of increase of pullout forces changed from a high increase to
                                        a constant, whereas in case of the middle nail, the rate of increase of pullout forces
                                        increased slowly and became constant;
                                   •    The numerical model results point out that the laboratory models underestimate the
                                        pullout behavior of nail reinforcement in nailed soil slopes.

                                   Author Contributions: Conceptualization, M.H.M. and M.A.; methodology, M.H.M. and M.A.;
                                   resources, J.M.; writing—original draft preparation, M.H.M. and M.A., writing—review and editing,
                                   J.M., project administration; funding acquisition, M.A. All authors have read and agreed to the
                                   published version of the manuscript.
                                   Funding: Funding for this research was given under award numbers R.G.P2/73/41 by the Deanship
                                   of Scientific Research; King Khalid University, Ministry of Education, Saudi Arabia.
                                   Institutional Review Board Statement: Not applicable.
                                   Informed Consent Statement: Not applicable.
                                   Data Availability Statement: Not applicable.
You can also read