Performance simulation of a grid connected photovoltaic power system using TRNSYS 17
←
→
Page content transcription
If your browser does not render page correctly, please read the page content below
Journal of Multidisciplinary Engineering Science Studies (JMESS)
                                                                                                                  ISSN: 2458-925X
                                                                                                     Vol. 8 Issue 1, January - 2022

    Performance simulation of a grid connected
   photovoltaic power system using TRNSYS 17
                               Case study for Brasov, Romania
                                                  Eftimie Elena
             Dept. of Product Design, Mechatronics and Environment, Transilvania University of Braşov
                                                Brasov, Romania
                                           e-mail eftimiem@unitbv.ro

   Abstract— Currently, sustainable development                  Considering the above aspects, the paper proposes
strategies are predominantly designed as                      for the beginning a comparative analysis of some
solutions to the ecological crisis and the                    specific meteorological and climatological parameters
continuous degradation of the environment, with               specific for two locations of the Brașov area (urban
the main objective of preserving the quality of the           area and extra-urban area Brașov). A comparative
environment. In this sense, on the ecological                 analysis of the weather data recorded for Brașov (from
level, sustainable development has the task of                the urban area and from the area adjacent to the city)
avoiding environmental degradation, which                     with the data generated using different specialized
implicitly leads to the superior capitalization of            software (PVSOL, PVGIS, METEONORM) is also
renewable resources. The widespread use of                    performed. However, the main objective consists in the
energy from natural resources is a key factor in              comparative analysis of the performances of a
protecting the environment and reducing                       photovoltaic system connected to the grid, whose
greenhouse gas emissions (i.e. reducing pollution             operation is simulated for different sets of weather data
and acid rain). Therefore, in the current                     (recorded data and data generated with the software
conditions, the implementation of renewable                   mentioned above).
energy in the built environment has become a
                                                                II.   METEOROLOGICAL DATA
global concern.
                                                                  The city of Brasov is located in an area with a
   Keywords— dynamic simulation; photovoltaic;                relatively high solar potential, with about 210 days of
solar energy; Trnsys                                          sunshine per year and an annual solar flux between
  I.     INTRODUCTION                                         1000 kWh/m2/year and 1200 kWh/m2/year [1]. From
                                                              this, it can be said that around 600-800 kWh/m2/year is
   If we refer to the use of solar energy conversion          100% feasible, that makes the use of any solar panel
systems, it should be mentioned that the climatic             for electricity production very interesting.
parameters (solar radiation - the main input date in
solar equipment design, temperature, humidity, wind              For the correct assessment of the solar potential of
speed) specific to the implementation area, exert a           an area, databases containing direct measurements of
special influence on their design.                            radiative parameters containing records over at least
                                                              one year are required.
    More specifically to the subject of this paper
represented by photovoltaic systems for electricity               Currently, although the literature proposes a series
generation, the solar radiation represents the main           of maps of solar energy potential, they are obtained
input parameter necessary for their design; given this        based on an inventory of data on global solar radiation
aspect, the use of input weather data as close as             (W/m2) and information obtained from the processing
possible to the real values represents a necessity for        of the satellite product SIS-SARAH (Surface Incoming
the design of photovoltaic systems and the simulation         Solar Radiation).
of their performance.
                                                                 However, for a correct assessment of solar energy
    Currently, the literature offers a series of
                                                              production it is necessary to take into account a lot of
mathematical models for estimating solar radiation;
although some of these models have the advantage of           factors of geometry of the solar trajectory, of the relief
simplicity and ease of application, they have the major       and meteorological factors [2, 3].
disadvantage of large errors compared to real values             In addition to those mentioned above, the evolution
(the accurate estimation of diffuse radiation is currently    that both the hardware and software component have
a difficult problem to solve). Moreover, most of the          had in the last decade, has made possible the
time, empirical models (which are determined based            development of specialized software and applications
on measurements from a certain location) are specific         that generate and process a very large volume of data.
to a single location. Another disadvantage is
represented by the fact that most models estimate                 One of them is PVSOL [4], software for calculating
solar radiation in clear sky conditions and there are no      photovoltaic panel systems. For the purpose of as
simple mathematically accurate models to estimate             efficient as possible custom design of photovoltaic
solar radiation in real sky conditions (variable).            systems, PVSOL software takes into account a

                                                     www.jmess.org
JMESSP13420823                                                                                                               4218
Journal of Multidisciplinary Engineering Science Studies (JMESS)
ISSN: 2458-925X
Vol. 8 Issue 1, January - 2022
number of factors such as the geographical location values and values generated with the PVSOL
and its meteorological profile, system size and software. As can be seen for the months January,
orientation, annual consumption and load profile of February, March, June, November and December, the
electrical equipment, the type PV and inverters, etc. values generated by PVSOL overestimate the values
recorded at the Brașov weather station; the largest
Another software for assessing the solar electricity
difference in overestimation is observed for December,
production is the PVGIS software [5]. This specialized
this having a percentage value of 75%. For the other
software allows both the evaluation of direct and
months, the generated values underestimate the
diffuse radiation and the evaluation of performances of
registered values; the largest difference is about -20%
photovoltaic systems, either grid-connected or off-grid.
for August.
A transient analysis software is the Trnsys
software; it uses the METEONORM database [6] as
the default weather database. However, that in the
case of energy simulations using Trnsys software, the
use of weather data generated by METEONORM
software involves the selecting from the database of
the closest location to Brasov (the paper will also
propose the implementation of measured weather data
in Trnsys subroutines).
The proposed comparative diagrams refer to the
monthly values of global solar energy, air temperature
and wind speed. Fig. 2. Monthly mean values of global energy - the
comparison weather data recorded for Brasov and weather
A. Solar resource potential data generated with PVSOL software
Value measured at the two locations – urban and Monthly variation of solar irradiation using PVGIS
extra-urban Brașov area Software
From the point of view of the solar potential (Fig. 1), When comparing the recorded values of solar
it can be seen that the values recorded at the two energy with those obtained after generation with the
weather stations are very close. Only during February, PVGIS software, it can be seen that the percentage
June, September and December the values recorded differences are between -32.4% and 2.7% (Fig. 3). It is
at the weather station in the extra-urban area are interesting that only for December the estimated value
higher than those in the urban area are (the maximum is higher than the real one, for the rest of the year, the
difference was recorded during February and is about generated values underestimating the real ones. As a
3.4kWh/m2).
percentage, this underestimation is relatively high for
For the other months of the year, in which the solar January (-24%), February (-32.4%), March (-25.4%),
potential has higher values for the urban area, the June (-20.5%), August (-13.4%), September (-12.9%)
maximum difference registered for October has the and November (-12.2%). The best-obtained estimation
value of 4.3kWh/m2. is for December (an overestimation of 2.7%) and April
(an underestimation of -4.4%).
Next, to compare the recorded data with the
simulated values with the generation and simulation
software, the values recorded in the urban area were
chosen.
Fig. 3. Monthly mean values of global energy - the
comparison weather data recorded for Brasov and weather
data generated with PVGIS software
Fig.1. Monthly global horizontal irradiation for urban and Monthly variation of solar irradiation using
extra-urban area Brașov METEONORM database from Trnsys software
Monthly variation of solar irradiation using PVSOL If we refer to the values of solar energy obtained
software from the simulations with the Trnsys software
(software that uses the METEONORM databases) it
Figure 2 presents the comparative study of the should be mentioned that the city of Brașov is not
monthly mean values of the solar potential, registered among the sites in the weather database and for the
www.jmess.org
JMESSP13420823 4219Journal of Multidisciplinary Engineering Science Studies (JMESS)
ISSN: 2458-925X
Vol. 8 Issue 1, January - 2022
simulation, the closest site to Brașov was selected, heat (climatological phenomenon manifested by the
namely the city of Cluj-Napoca. concentration of higher temperatures in densely
populated and built-up urban areas, compared to the
The percentage differences obtained between the surrounding rural areas [7]) above the city, respectively
data generated by the Trnsys software compared to to an increase of its temperature.
the values recorded by the weather station are
between -28.4% and 24.5% (Fig. 4). However, it can Regarding the differences between the mean
be noted that only for the months of November and values of temperatures, generated with the
December there was an underestimation more than METEONORM software, these underestimate the
20% (-26.6% and 28.4% respectively) of the real recorded values, except for September. The largest
values (it should be noted that for the two months the observed differences between the generated values
and those recorded, there are for January (2.44oC for
solar energy values have the lowest values, and a
urban area and 1.8oC for extra-urban area), February
difference of 10kWh/m2 can mean a difference of
(4.25oC for urban area and 3.9oC for extra-urban area)
25%). The highest value of overestimating the real and November (4.47oC for urban area and 4.12oC for
values is registered for September, this having the the extra-urban area).
value of 24.5%. For the other nine months, the
percentage differences obtained are in absolute terms Regarding the maximum values of temperature,
less than 9%. they are significantly higher in the extra-urban area
compared to the urban area, the maximum difference
of 1.2oC being recorded for April (Fig. 6).
Fig. 4. Monthly mean values of global energy - comparison
of recorded weather data for Brasov and generated weather
data with METEONORM software for Cluj-Napoca Fig. 6. Monthly maximum temperatures for urban and
extra-urban area Brașov and monthly maximum
B. Mean and maximum monthly temperatures temperatures obtained by simulation with METEONORM
An analysis of the monthly mean values of the software
temperatures recorded for the two stations, shows a
Regarding the maximum temperature values, the
quite similar variation in both the qualitatively and generated values by the METEONORM software are
quantitatively (Fig. 5). This analysis shows that for the lower than those recorded (except for September and
urban area, there is a slight increase in mean October), the differences being for the urban area
temperature values (maximum 0.6oC for January and between -6.33oC (underestimation for February) and
December) but this difference was predictable given 4.8oC (overestimation for September). For the extra-
the two types of areas, urban and extra-urban. The urban area the differences are between -6.76oC
climatic effects induced by the continuous urbanization (underestimation for April) and 3.66oC (overestimation
of the cities are considered, problems approached for September). The January, February, April, August
increasingly both in applied climatology studies and and September months record the largest differences
studies of urban development. (for these months the generated data show larger
differences in absolute values of 3.5oC compared to
the recorded values).
It is noted that the PVSOL software also provides
information on the monthly mean values (Fig. 7);
unfortunately, the differences between the mean
values generated and the mean recorded values are
large (the generated values underestimate the
recorded values for the whole period of the year),
varying between 6.4oC (December) and 14.5oC for
April.
Fig. 5. Monthly mean temperatures for urban and extra-
urban area Brașov and monthly mean temperatures obtained
by simulation with METEONORM software
The main consequence of the increase of urban
areas leads to the intensification of the island of urban
www.jmess.org
JMESSP13420823 4220Journal of Multidisciplinary Engineering Science Studies (JMESS)
ISSN: 2458-925X
Vol. 8 Issue 1, January - 2022
of the values registered for the two areas of Brașov
and of the values generated with the Trnsys software.
During the year considered for study, the highest
values of mean wind speeds were recorded during
March and September (Fig. 9), both in the urban area
(1.68m/s and 1.71m/s respectively) and in the extra-
urban area (2.79m/s and 2.85m/s respectively).
However, that the highest values of mean monthly
speeds were not recorded during the cold period of the
year. It must say that a variation of the wind speed
qualitatively similar to the one presented for the
Fig. 7. Monthly mean temperatures for urban and extra- chosen time period (both for the urban and for the
urban area Brașov and monthly mean temperatures obtained extra-urban area) was observed over the periods of
by simulation with PVSOL software several years [8].
If we refer to the mean annual values of
temperature, the recorded value in the extra-urban
area is -0.3oC lower than that recorded for the urban
area (Fig. 7).
If we compare the mean annual value obtained
using data generated by the METEONORM software
with the mean annual value in the urban area, the
difference is 1.46oC and for the mean annual value in
the extra-urban area the difference is 1.15oC.
The differences between the mean annual value of
the temperature obtained with the help of PVSOL
software and the values of the mean annual Fig. 9. Variation of the mean monthly wind speed, values
temperatures recorded - for the urban and extra-urban registered for the urban and extra-urban area of Brașov and
the values generated by the Trnsys software
area - are 10.8oC and 10.5oC, respectively.
Concerning the values of the mean monthly speeds
A comparison of the mean monthly temperatures
generated by the Trnsys software (METEONORM
recorded with those generated by the PVGIS software
weather database), they are closer to the values
(Fig. 8), leads to the conclusion that the PVGIS recorded for the extra-urban area.
software makes a very good estimation of them. Thus
the differences fall, for the urban area between -0.99oC The mean values of the wind speed generated are
(overestimation for June) and 3.01oC (underestimation much higher comparatively to the values recorded for
for March) and for the extra-urban area between - the urban area, for the longest period of the year. The
1.16oC (overestimation for May) and 2.83oC percentage differences being between (less for
(underestimation for the month March). September when the difference is -4%, by the way the
only month for which the values generated are below
the recorded values) 14% (December) and 95%
(October).
For the extra-urban area, there are months for
which the generated values are quite close to those
recorded (February, April, May, August) the
percentage differences being between -3% and 5%,
for the rest of the months the percentage differences
are between -40% (September) and 12% (June).
Fig. 8. Monthly mean temperatures for urban and extra-
urban area Brașov and monthly mean temperatures obtained
by simulation with PVGIS software
Regarding the mean annual values of
temperatures, the difference between the mean annual
value recorded and that generated with the PVGIS
software is 0.74oC for the urban area, respectively
0.42oC for the extra-urban area.
C. Mean and maximum monthly speeds Fig. 10. Variation of the maximum monthly wind speed,
Regarding the mean and maximum monthly wind values registered for the urban and extra-urban area of
speeds, the next stage presents the variation diagrams Brașov and the values generated by the Trnsys software
www.jmess.org
JMESSP13420823 4221Journal of Multidisciplinary Engineering Science Studies (JMESS)
ISSN: 2458-925X
Vol. 8 Issue 1, January - 2022
When referring to the maximum recorded wind However, the use of photovoltaic systems in
speed, these were recorded during the month of March various applications is a cost-effective option.
(11m/s for urban area and 17.23m/s for the extra-
urban area), Fig. 10. It is obvious that in the extra- The building subject to energy simulations is a
urban area the values of wind speeds are much higher residential building for which a system (fixed stand
comparatively to those recorded for the urban area. type) with an installed power of 4kWp mounted on the
roof was chosen. For the load profile of the building
It must say, however, that the differences between was considered a profile with constant load (annual
the maximum values obtained by generation and the consumption of 1460kWh); it has been considered that
values recorded for the two locations are higher for the the proposed system is sufficient to supply a small
urban area. family household (for example, two person’s
household with one or two children).
In the case of the urban area, the maximum values
obtained by generation are much higher than those The grid-connected photovoltaic panel system
recorded (throughout the year), the percentage proposed for analysis is composed of the following
differences fitting between 10% (December) and 53% basic components: the photovoltaic panel, the charge
(July). controller, the inverter, the utility meter and the
electrical network.
As mentioned above, the percentage differences
between the values recorded for the extra-urban area The photovoltaic panel system produces energy
and the values generated are smaller, ranging during the day and the other components are needed
between -29% (January) and 30% (July). for the correct conversion, distribution and storage of
the energy produced by them.
D. Conclusion
The photovoltaic panel system consists of 16 solar
The comparative analysis of the variation diagrams
PV modules (eight in series and two in parallel, the
of the climatic parameters leads to the conclusion that
maximum power (Pmax) for each solar panel is
for the locations where there is a weather station, it is
250Wp,) which are electrically connected to each
recommended to use the measured meteorological
other. For the photovoltaic panels, a variant sold in
data for the design of the photovoltaic system.
Romania was chosen (AE Solar, type AE250P6-60,
III. SIMULATION OF A GRID-CONNECTED PV SYSTEM Polycrystalline). The cell type is polycrystalline with a
PREPARE YOUR PAPER BEFORE STYLING panel efficiency of 15.27%.
To emphasize the importance of using the The photovoltaic matrix generates direct current,
measured meteorological data in designing solar feeding on sunlight.
photovoltaic systems, the paper proposes calculating The charge controllers regulate the direct current
the energy produced by a photovoltaic grid-connected coming from the photovoltaic panels; these controllers
system for a building located in the Brasov area. For can be of two types: PWM (Pulse Width Modulation)
this, the transient analysis software (Trnsys) will be controllers or with pulse width modulation and MPPT
used; Trnsys software uses the data generated by controllers or with tracking the maximum power point.
METEONORM as the default database for weather For the proposed simulations was chosen the second
data [6]. The simulation of the performances of the variant, respectively the solar PV modules ensures the
grid-connected photovoltaic system will be done using generation DC power at the best output power at a
the weather data generated by the METEONORM time during daylight hours, [9]. In addition, for the case
software for the closest location to Brașov and the considered, being a photovoltaic system with a voltage
weather data measured for the urban and extra-urban of up to 160 volts, it is justified to choose maximum
area of Brașov. The measured weather data will be power point tracking controllers.
implemented in the Trnsys subroutines.
One of the key components of any photovoltaic
In addition, the same analysis of the performance panel system is the inverter. It converts the generated
parameters of photovoltaic systems will be performed direct current into alternating current, taking into
for their simulation using PVSOL and PVGIS software. account the fact that most household and electronic
equipment is supplied with alternating current.
A. System description
Regardless of the photovoltaic panel system used,
After finding out the solar energy potential of the
it has a utility meter. This counter is connected to the
solar panel installation location, it is possible to
proceed to the calculations regarding the justification system and measures how much electricity the house
of the investment in such a system. on which the panels are installed uses.
Photovoltaic systems can be designed for a B. Simulation tool – Trnsys modelling
number of applications, among the main advantages of In order to analyse the performance of the
their use being the energy independence, modularity, photovoltaic system - as mentioned before - the Trnsys
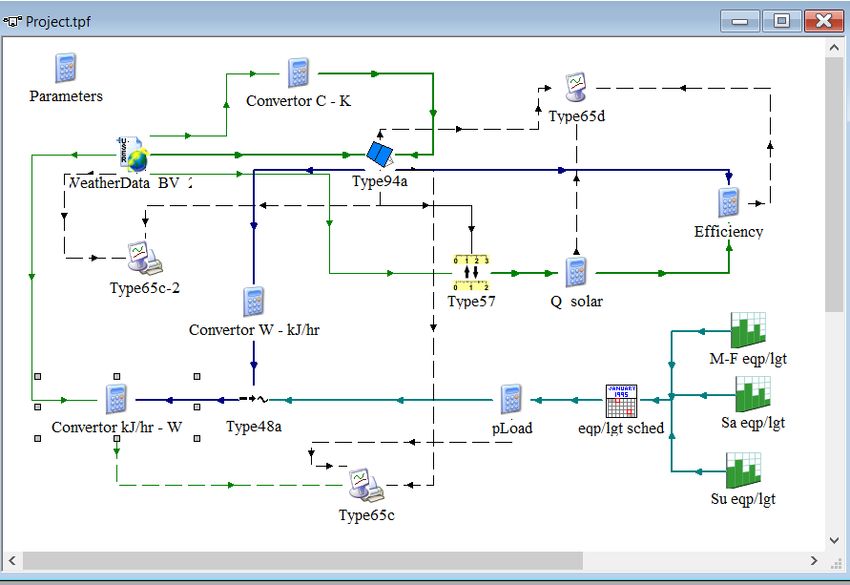
low installation costs, operational safety, reliability, but software will be used, the scheme of the model being
not least that the fact that electricity is free. However, presented in Fig. 11.
the main limiting factors of this technology are its still
high price compared to traditional systems, low return For building the Trnsys model of the grid connected
and long payback time. photovoltaic system with a capacity of 4kW, the
following types of components were used:
www.jmess.org
JMESSP13420823 4222Journal of Multidisciplinary Engineering Science Studies (JMESS)
ISSN: 2458-925X
Vol. 8 Issue 1, January - 2022
to implement meteorological data
characteristic both to urban and extra-urban area of
Brasov, the Weather Data Processor, Type 99, was
used (see Fig. 11), that allows the use of a customized
weather data file and reads the data provided at
regular time intervals; for the simulations with the
meteorological data of the METEONORM database, a
Weather Data Processor, Type 15, was used (the
simulation will be made for the closest location to
Brașov, site contained in the METEONORM
database);
for modelling of the electrical performance of a
photovoltaic array, Type 94 was used; the parameters
defined for this component are characteristic of the
type and number of chosen photovoltaic panels,
respectively, module voltage at max power point and
reference conditions: 29.16V; module current at max
power point and reference conditions: 8.57A; module
area: 1.6368m2; number of modules in series: 8;
number of modules in parallel: 2; array slope: 35o;
power conditioning devices, Type 48a, that
operates in Mode 0, peak-power tracking collector, no
battery, power is feedback to an utility;
Fig. 12. Load profile for all days of the week
by means of Type 41, there were specified
three forcing functions, one for each working day of the
week (Monday to Friday), one for Saturday and one for
Sunday; for the description of time-dependent forcing
functions, for the three types of loading, Type 14 was
used; the three daily loading schedules used are
shown in Fig. 12; because this version of the
component uses dimensionless units, so that it can be
used in a very generic way, each unit on the ordinate
corresponds to 500W, this correction being made with
the help of the pLoad component;
for the necessary conversions of the units of
measurement were used unit conversion routines
provided by Type 57 and equation tools: Convertor C-
Fig. 11. Trnsys model of the 4kW PV grid-connected K, Convertor kJ/hr-W, Convertor W-kJ/hr;
system
for the display of desired variables, there was
used Online Graphical Plotter, Type 65d and Type
65c, the last one allowing in addition to automatic
graphical display of data also, their sending them to an
external file for further processing.
IV. RESULTS AND DISCUSSIONS
The performance parameters discussed in this
section refer to:
monthly variation of PV generated energy;
monthly energy consumption and monthly
energy consumption covered by PV and by grid;
the annual PV energy, the annual own
consumption, the annual grid feed-in energy, the
annual covered by grid energy;
the solar fraction defined as the ratio between
the own consumption energy and the consumption
(monthly or annual values).
www.jmess.org
JMESSP13420823 4223Journal of Multidisciplinary Engineering Science Studies (JMESS)
ISSN: 2458-925X
Vol. 8 Issue 1, January - 2022
It must say that considering the load profile
considered (4kWh/day), the annual value of
consumption is 1460kWh.
The analysis of the performance parameters for the
simulations corresponding to the urban area Brașov
(using the measured weather data) leads to the
following conclusions, Fig. 13 and Fig. 14:
The maximum monthly energy production is of
595kWh and was obtained for August and the
minimum one for January, respectively of 191kWh;
The value of the solar fraction falls between the
limits of 37.3% for December and 71.5% for July;
PV annual energy value obtained is 4822kWh;
of this amount about 17% is used for own consumption
and about 83% is energy feed in grid;
From the total annual consumption of
1460kWh, about 44% represents energy covered by
PV and 56% energy covered by grid;
The annual value of energy covered by grid is
818kWh (energy required to cover the entire
consumption) the energy feed in grid being about
4004kWh;
Fig. 14. PV Energy, consumption, own consumption, grid
feed in energy, energy covered by PV and covered by grid –
urban area of Brașov
The annual value of the solar fraction is about
56% and the annual value of the own power
consumption (the ratio between the own consumption
and the PV energy) is about 17%.
For the extra-urban area of Brașov, the simulations
highlighted the following aspects (Fig. 15 and Fig. 16):
The maximum values of energy production are
obtained for the months of July and August (584kWh);
The minimum monthly value of energy
production is 178kWh and is recorded for January;
The values of the solar fraction fall within the
limits of 38% (December) and 70.2% (July); notes the
qualitative variation similar to the solar fraction curve to
that of the solar energy curve, confirming that the main
factors influencing the values of the solar fraction are
Fig. 13. Monthly PV energy and monthly consumption – climatic conditions;
urban area of Brașov
The annual value of PV energy obtained is
4769kWh; from this about 17% represents the own
consumption and about 83% represents energy feed in
grid;
From the total annual consumption of 1460kWh
about 45% represents energy covered by grid and
55% represents energy covered by PV;
www.jmess.org
JMESSP13420823 4224Journal of Multidisciplinary Engineering Science Studies (JMESS)
ISSN: 2458-925X
Vol. 8 Issue 1, January - 2022
The annual energy covered by grid is about
803kWh and the annual energy feed in grid is about
3965kWh;
For the annual value of the solar fraction was
obtained a value of 55% and for the annual value of
the own power consumption a value of 16.8% (values
close to those calculated for the urban area);
Fig. 16. PV Energy, consumption, own consumption, grid
feed in energy, energy covered by PV and covered by grid –
extra-urban area of Brașov
The annual value of PV energy for the extra-
urban area (4769kWh) is slightly lower compared to
that for the urban area (4822kWh), as well as the
annual value of solar energy is slightly lower for extra-
urban area (1268kWh) compared to that recorded for
the urban area (1276kWh).
If the closest city to Brașov, the existing city in the
METEONORM database, is used, the simulations of
the PV on grid system led to the following results (Fig.
17 and Fig. 18):
The monthly value for PV energy production
varies between 118kWh (December) and 610kWh
(July);
Fig. 15. Monthly PV energy and monthly consumption – The monthly values of solar fraction varies
extra urban area of Brașov between 29.4% for December and 73.3% for July;
The annual PV energy production is about
4808kWh; of this value, about 17% represents own
consumption and 83% represents energy feed in grid;
Regarding the annual energy covered by grid,
this represents about 44% from the total annual
consumption of 1460kWh; the energy covered by PV
represents about 56%;
The annual energy covered by PV is about
825kWh and the annual energy feed in grid is about
3983kWh;
www.jmess.org
JMESSP13420823 4225Journal of Multidisciplinary Engineering Science Studies (JMESS)
ISSN: 2458-925X
Vol. 8 Issue 1, January - 2022
of PV energy values for all months. For instance for
January the PV energy is overestimated with about
33kWh (and this value is relatively high considering
that is a winter month with low solar potential) and for
December, an underestimation about 77kWh is noticed
(and again a high value considering the winter month).
As mentioned above, when choosing the loading
profile, a situation of Profile with constant load was
chosen and for the type of photovoltaic panels, a
variant of panels was chosen that are sold in Romania
but, that can also be found in the software PVSOL
database (AE Solar panels, type AE P6-60_250-
Fig. 17. Monthly PV energy and monthly consumption –
275W). These simulation preconditions have been
the closest city to Brasov, city from METEONORM database established so that the simulation to be performed for
the same conditions for all software and the
comparative analysis of the data to be as accurate as
possible.
Therefore, an analysis of the performance
parameters when using the PVSOL software leads to
the wording of the following conclusions (Fig. 19 and
Fig. 20):
Monthly PV energy production takes values
between 555kWh for July and 307kWh for November;
The annual value of PV energy production is
about 5341kWh; of this value approximately 12%
represents the own consumption energy end 88%
represents energy feed in grid;
From the annual consumption of 1460kWh,
43% represents energy covered by PV and 57%
represents energy covered by grid;
Fig. 18. PV Energy, consumption, own consumption, grid Fig. 19. Monthly PV energy and monthly consumption –
feed in energy, energy covered by PV and covered by grid – PVSOL simulation for Brașov
the closest site to Brașov
The annual value of the solar fraction is 56.5%
and the annual value of the own power consumption is
17.5%;
Comparing the annual values of PV energy
obtained from simulations using METEONORM
database (4808kWh) and the measured weather data
for Brașov area (4822kWh), it is obtained a difference
of 22kWh. Even if the annual difference is not large,
however, the analysis of the monthly variation of
photovoltaic energy highlights that there are months
where these differences are important. In addition, it
cannot be stated that there is an even overestimation
www.jmess.org
JMESSP13420823 4226Journal of Multidisciplinary Engineering Science Studies (JMESS)
ISSN: 2458-925X
Vol. 8 Issue 1, January - 2022
registered for the months: May, August and
September.
The annual value of PV energy production is of
4277kWh, value that is underestimated largely
compared to the value of photovoltaic energy obtained
with the data measured for the urban area.
Fig. 21. Monthly PV energy and monthly consumption –
PVGIS simulation for Brașov
The analysis of the annual values of produced
photovoltaic energy leads to the conclusion that the
simulation using Trnsys software leads to the smallest
percentage difference compared to the value
calculated using weather data recorded for the urban
area of Brașov, respectively about 0.3% (Fig. 22).
The percentage difference between the annual
values of photovoltaic energy calculated using the
Fig. 20. PV Energy, consumption, own consumption, grid
feed in energy, energy covered by PV and covered by grid –
PVSOL database and that obtained using the weather
PVSOL Brașov data recorded for the Brașov urban area is
approximately 10.8%. Therefore the use of simulations
Calculating the annual solar fraction it resulted with data generated by the PVSOL software could lead
the value of 42.6% and for the own power to an under-dimensioning of the PV system (the
consumption a value of 11.6%; there is an important annual PV energy production is estimated to be higher
difference between these values and those calculated with approximately 520 kWh).
with the measured data for Brașov; What is interesting is that although the annual value
It is noticed that similar to the monthly solar of photovoltaic energy obtained from simulations with
energy variation compared to the measured solar PVSOL software is overestimated, still the annual
energy for Brașov urban area (fig. 2), for the winter value of own consumption energy is 622kWh
period (January, February, December) and the months compared to 818kWh, value calculated with measured
of March and April, the PVSOL software overestimates weather data (percentage represents 17% of PV
in a great extend the PV energy calculated with the energy).
measured weather data.
Regarding the simulations performed with the
PVGIS software, the following conclusions can be
worded, Fig. 21:
The monthly values of the PV energy
production are between the limits of 165kWh for
December and 516kWh for July;
Except for September, all the monthly values of
PV energy production simulated with PVGIS software
are underestimated comparing the values obtained
with measured weather data;
the greatest differences between the monthly Fig. 22. Annual PV energy
values of the PV energy simulated with PVGIS and The percentage difference between the annual
those obtained with the measured data for the Brasov values of photovoltaic energy calculated with the
urban area (differences greater than 80kWh) were PVGIS software and that obtained using the data
www.jmess.org
JMESSP13420823 4227Journal of Multidisciplinary Engineering Science Studies (JMESS)
ISSN: 2458-925X
Vol. 8 Issue 1, January - 2022
measured for the urban area of Brașov is curvature of the Carpathians, its climate being
approximately -11.3% PV (the annual PV energy characterized by the transition note between the
production is estimated to be lower with approximately temperate climate of oceanic type and the temperate
545 kWh). climate of continental type [10].
In terms of both the values of the solar potential In these circumstances, the development of some
and the values of photovoltaic energy, between the methods for generating weather data that take into
two areas of Brasov (urban area and extra-urban area) account all these specific conditions of such an urban
there are relatively small differences. area (where the urban pollution leads to a decrease in
solar radiation), is extremely difficult.
Although between the annual values of photovoltaic
energy calculated using the weather data provided by
METEONORM, respectively using the measured
weather data, there are no significant differences, an
analysis of monthly values, emphasises that there are
months for which the differences are significant, Fig.
23.
Thus, the overestimation of photovoltaic energy is
about 100kWh for September, and for the months of
January, March, April and July this overestimation is
between 25kWh and 38kWh. The most important
underestimation of photovoltaic energy is for
November, this having a value of 98kWh; for October
and December the underestimation is between 44kWh
and 77kWh.
Fig. 24. Monthly variation of energy generation and
Fig. 23. PV Energy and Solar Fraction energy consumption for the months of September and
December – urban area of Brașov
Also, the analysis of the monthly values of the solar
fraction shows that the percentage differences are
between -8% and 7%, values recorded for the months
for that there were significant differences of
overestimation and underestimation of photovoltaic
energy (December and September).
To highlight better the above differences, Figs. 24-
26 present the monthly variation of energy generation
and energy consumption for the months of September
and December, months at the maximum and minimum
in terms of photovoltaic energy production. The
diagrams represents the simulations achieved with
Trnsys using the meteorological databases for Brașov
urban and extra-urban areas and the METEONORM
database for the nearest town to Brașov.
Given the results of simulations with Trnsys
software and the PVSOL and PVGIS software, it can
worded the following conclusion: sizing of the grid-
connected photovoltaic systems is recommended to be
performed using meteorological data from weather
stations located in the area of implementation theirs.
The weather data generated with the specialized
software cannot take into account the geographical
and climatic characteristics specific to each area of
implementation of the PV systems. The city of Brașov
is located in a depression area, in the internal
www.jmess.org
JMESSP13420823 4228Journal of Multidisciplinary Engineering Science Studies (JMESS)
ISSN: 2458-925X
Vol. 8 Issue 1, January - 2022
Fig. 25. Monthly variation of energy generation and Environment, Ecosystems and Development, Puerto
energy consumption for the months of September and De La Cruz, Tenerife, Canary Islands, Spain,
December –extra-urban area of Brașov December 14-16, 2009, pp. 208-211.
[2] Satellite Application Facility on Climate
Monitoring (CM SAF).
[3] E. Eftimie. “Estimation of monthly Ångström-
Prescott equation coefficients for Brasov urban area,
Romania”, in International Conference on Economic
Engineering and Manufacturing Systems, Brasov, 24
– 25 November 2011, RECENT, Vol. 12, no. 3(33),
pp. 259-264.
[4] http://pvsol-online.valentin-software.com/#/
[5] https://ec.europa.eu/jrc/en/pvgis
[6] S. A. Klein and W.A. Beckman, “TRNSYS 16,
A transient System Simulation Program”, University of
Wisconsin Solar Energy Laboratory, Madinson, USA,
2006.
[7] D. J. Sailor. “Simulated urban climate
response to modification in surface albedo and
vegetative cover” in Journal of Applied Meteorology,
vol. 34, no. 7, 1995, pp. 1694–1704.
[8] E. Eftimie. “Wind Characteristics and Wind
Potential Assessment for Braşov Region, Romania”,
in International Journal of Science and Engineering
Fig. 26. Monthly variation of energy generation and Investigations, vol. 3, issue 27, April 2014, pp. 1-9.
energy consumption for the months of September and
December –the closest town to Brașov (Cluj-Napoca) [9] S. Manju and S. Netramani. “Progressing
towards the development of sustainable energy: A
One last aspect to mention concerns the avoided
critical review on the current status, applications,
CO₂ emissions. Thus, if we take into account the fact
that in 2017 at national level, the average specific developmental barriers and prospects of solar
values of CO2 emissions and radioactive waste photovoltaic systems in India”, in Renewable and
resulted from electricity production, were Sustainable Energy Reviews, Volume 70, April 2017,
314.52kg/kWh [11], then for the considered PV pp. 298-313.
system, the value of avoided CO2 emissions is about [10] C. Şerban, E. Eftimie and L. Coste, L.
1516kg/year for the urban area and 1500kg/year for “Simulation Model In Trnsys Of A Solar House From
extra-urban area. Braşov, Romania”, in Renewable Energy and Power
ACKNOWLEDGEMENT Quality Journal, No.9, 2011.
The meteorological database used in this analysis [11] https://www.anre.ro/ro/despre-anre/rapoarte-
were provided both by Department of Renewable anuale. National Energy Regulatory Authority (ANRE).
Energy Systems and Recycling and by Research & Report on the results of the monitoring of the
Development Institute, from Transilvania University of electricity market in December 2016.Autoritatea
Braşov, Romania. Națională de Reglementare în Domeniul Energiei
(ANRE). Raport privind rezultatele monitorizării pieței
REFERENCES de energie electrică în luna decembrie 2016.
[1] E. Eftimie. “Radiative Parameters Specific to
Braşov Urban Area”, in the Book: Recent Advances in
www.jmess.org
JMESSP13420823 4229You can also read