Accuracy of Local Knowledge in Prediction of Seasonal Weather: Empirical Evidence from North Eastern Nigeria
←
→
Page content transcription
If your browser does not render page correctly, please read the page content below
Environment and Pollution; Vol. 10, No. 2; 2021
                                                                               ISSN 1927-0909      E-ISSN 1927-0917
                                                                Published by Canadian Center of Science and Education

      Accuracy of Local Knowledge in Prediction of Seasonal Weather:
              Empirical Evidence from North Eastern Nigeria
          Ahmed Abubakar Jajere1, Joshua, Jonah Kunda2, Umar Muhammed Bibi3 & Yusuf Maina-Bukar4
1
    Department of Geography, Federal University Kashere, Gombe, Nigeria
2
    School of Geography, University of Nottingham, Nottingham, UK
3
    Department of Geography, Federal University Kashere, Gombe, Nigeria
4
    Desert Research, Monitoring and Control Centre (DRMCC), Yobe State University, Damaturu, Nigeria
Correspondence: Joshua, Jonah Kunda, School of Geography, University of Nottingham, Nottingham NG7 2RD,
UK. E-mail: Jonah.joshua@nottingham.ac.uk

Received: March 27, 2021           Accepted: May 24, 2021           Online Published: June 4, 2021
doi:10.5539/ep.v10n2p33                          URL: https://doi.org/10.5539/ep.v10n2p33

Abstract
Over the years, West African Sahel’s people developed some strategies for predicting the seasonal weather using
meteorological indicators to plan for extreme weather events. This study used information on local indicators of
seasonal weather prediction and mean monthly rainfall and temperature record (1981-2017) from Nguru weather
station located at Latitude 14°N in achieving the aim of the study. Both qualitative and quantitate (descriptive and
inferential) statistical tools were employed in analysing the collected data. The study found that the local
population of the study area used meteorological indicators in predicting the seasonal weather. The results of the
analysis revealed that the variability of the annual rainfall during the study period was large. An increasing trend
of 3.1mm annually was observed. While decreasing trend in the cold, dry and hot dry season temperature and an
increasing trend in warm moist temperature by 0.025°C, 0.05°C and 0.0004°C respectively, was observed. Annual
rainfall amount accounts for 31% and 2% variability in cold dry and warm moist season temperature, respectively.
Cold, dry season and warm moist season temperature respond to any 1mm increase in annual rainfall by decreasing
by 0.012°C and 0.002°C, respectively. The Hot, dry season temperature also accounts for 4% of the variability in
annual rainfall. The model’s result revealed anyone 1°C increase in hot dry season temperature lowers the annual
rainfall by 10mm. This study confirmed that the observed relationship between seasons weather conditions by
local population exist. Therefore annual rainfall is the major determinant of cold dry seasonal temperature in the
study area.
Keywords: climate variability, indigenous knowledge and seasonal weather prediction
1. Introduction
The people of West African Sahel, primarily farmers and Pastoralist, have been copping with large scale seasonal
weather condition variability. According to Bibi et al (2014) the areas in the Northeast of Nigeria beyond the 120
latitudinal line is prone to drought and climate variability. The three distinct seasons (Hot dry, Cold Dry and wet)
temporal variability are extreme. The climate-sensitive livelihoods in the fragile ecosystem respond significantly
to any slide fluctuation in seasonal weather condition. Accurate information on what the seasonal weather will be
like, remained the major constraint to local population climate variability copping strategies. Over the years, people
developed some strategies for predicting the seasonal weather that enable them to plan for extreme weather events.
The use of meteorological, astronomical and biological indicators by several African societies for centuries in
predicting local weather and climate is reported in several studies (Chang, Yanda and Ngana, 2010; Makwara 2013;
Okonya and Kroschel 2013). The local knowledge on weather/climate prediction techniques has attracted the
attention of scientific research in several parts of African societies (Kijazi, Chang’a, Liwenga, Kanemba and Nindi
2013; Enock 2013; Chikaire, Ajaero, Ibe, Orusha and Onogu, 2018; Zuma-Netshiukhwi, Stigter and Walker, 2013).
The studies broadly identified the predicting variables, and little attention is given to validating the effectiveness
and accuracy level of local predictions techniques. Thus, a need to evaluate the accuracy and validity of weather
prediction using local knowledge, especially in the West African Sahel ecological belt. The focus of satellite-
derived weather forecast information is mainly on rainfall. The established relationship between West African

                                                         33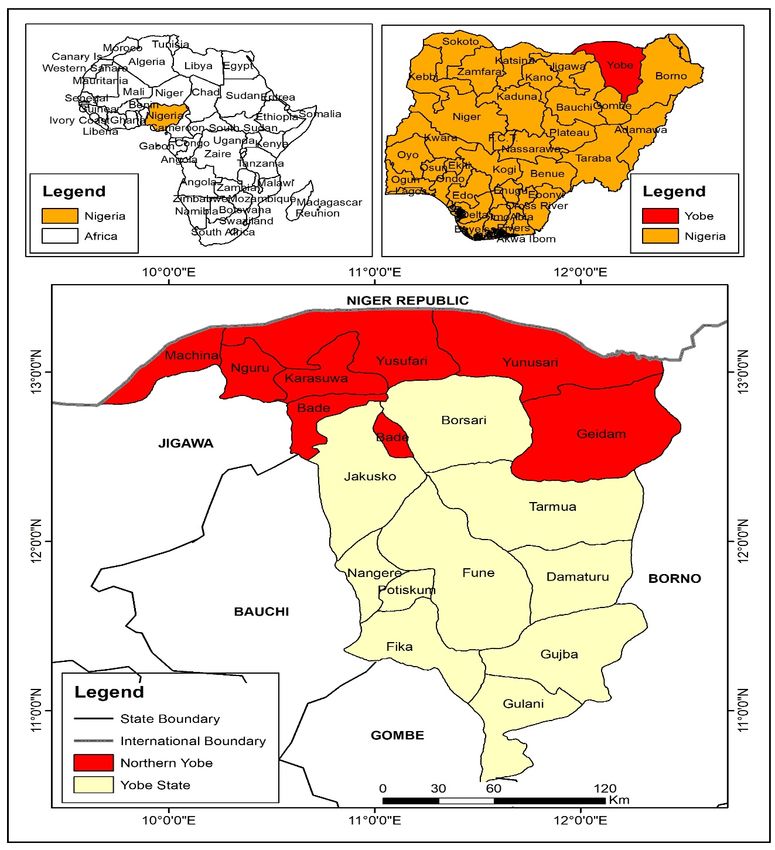
ep.ccsenet.org                                Environment and Pollution                           Vol. 10, No. 2; 2021

Sahel rainfalls with Sea Surface temperature enables a more accurate rainfall forecast using satellite data. Little
attention is given to seasonal temperature. At the same time, Harmattan season weather is vital to the economy
and livelihood in general of the people of Sahel. According to the local knowledge of the people of Sahel, the
intensity of Harmattan season temperature is the function of the annual rainfall pattern. Therefore it is against this
backdrop that this study validated the meteorological indicators of local Knowledge weather predictions using
historical climate data from the weather station in a part of the West African Sahel.
2. Literature/Theoretical Underpinning
Local knowledge is a total sum of experience people accumulated over time through interaction with the
environment or society (Makwara, 2013). Some of the knowledge is passed from generation to generation and
developed over time. Local knowledge is the human capital of societies. It is the principal asset they invest in the
struggle to survive, which encompasses skills and insight people apply to maintain and improve their livelihoods
(Makwara, 2013 citing Williams and Muchena 1991). Today much local Knowledge system are at risk of
becoming extinct (Radeny, Desalegn, Mubiru, Kyazze, Mahoo, Recha, Kimeli and Solomon, 2019). Local
population livelihoods are climate-sensitive. Thus climatic variability poses a threat to fragile livelihoods that
depends on mother earth. The Local population predict seasonal climate to plan for the extreme event. The local
population used local environmental and astronomical indicators in predicting seasonal weather (Radeny, et-al
2019). The Local Knowledge of weather predictions has attracted the attention of scientific studies in recent years.
The studies primarily focused on identifying the indicators for documentation and integration in seasonal weather
prediction techniques.
Chang’a, Liwenga Kanemba and Nindi (2013) reported that local communities of Mahenge and Ismani wards,
Tanzania, used Plant phenology particularly that of mango trees, in predicting the rainfall pattern. An assessment
of the forecasted and observed 2011/2012 seasonal rainfall indicates comparable results. Chang’a, Yanda and
Ngana (2010), in their study on Indigenous knowledge in seasonal rainfall prediction in the South-western
Highland of Tanzania, found that the local communities widely used plant phenology in seasonal rainfall
forecasting. Early and significant flowering of Mihemi (Erythrina abyssinica) and Mike (Brachystegia speciformis)
trees from July to November has been identified to be one of the signals of the excellent rainfall season. The
behaviour of the Dudumizi bird has been singled out as one of the best indicators for rainfall. Local farmers of
South Eastern Nigeria predict the dry season and harmattan using fruits drying/falling off from trees, increasing
termites, shedding of the tree, and appearance of rainbows, among others. Okonya and Kroschel (2013) reported
that Uganda’s local communities used meteorological indicators such as wind direction and cloud colour in
predicting rainfall. Improve accuracy and reliability of seasonal weather forecast need to be enhanced in the present
increasing climatic variability over most of the world posed global climate change. Therefore “Systematic
documentation and subsequently integration of Indigenous Knowledge (IK) in seasonal rainfall forecasting is one
of the promising initiatives that need to be explored” (Chang’a, Yanda and Ngana 2010).
3. Methodology
Three decades’ monthly rainfall and temperature records from Nguru (Latitude 14°) were sourced from Northeast
Arid Zone Development Programme (NEAZDP) meteorological Stations. The data contained monthly rainfall
records used to calculate the mean annual rainfall, monthly max, min, and seasonal temperature. The local
knowledge indicators used in seasonal weather prediction was sourced through Participatory Rural Appraisal (PRA)
methods namely key informant interviews and Focus Group Discussions (FGDs) were used in Identification of the
traditional indicators used for seasonal rainfall forecast in Sahel Savannah of North eastern Nigeria. A total of four
villages two each from Agro-pastoralist and agrarian communities (Dagona, Dachia, Maimalari and Garin lamido)
were sampled as shown in figure 1.

                                                         34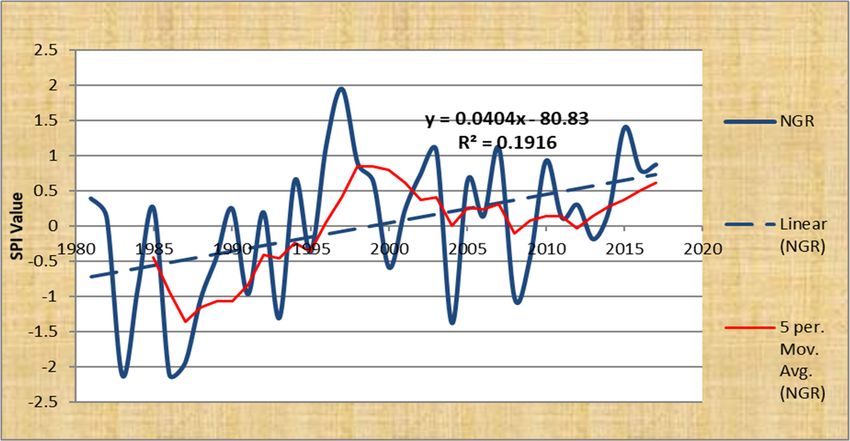
ep.ccsenet.org                                Environment and Pollution                           Vol. 10, No. 2; 2021

                  Figure 1. Agro-pastoralist and agrarian communities of North eastern Nigeria

The selection of the villages was not systematic; it was mainly based on the accessibility to the respective villages
and history. The interview and discussion questions explored perceptions on climate variability and various
techniques used within the community in seasonal weather forecasting. Content analysis technique was used in
analysing information collected from key informants interviews and FGDs.
The annual temperature of the station was divided in to three temperature seasons: hot/dry, warm/moist and
cold/dry.
Hot/dry season = March, April, May and June mean temperature
Warm/moist = July, August, September and October mean temperature
Cold/dry (Harmattan) = November, December, January and February mean temperature
Annual Rainfall = total rainfall that falls in the year
Linear regression statistical tool was used in determining annual rainfall and Seasonal temperature variability trend

                                                          35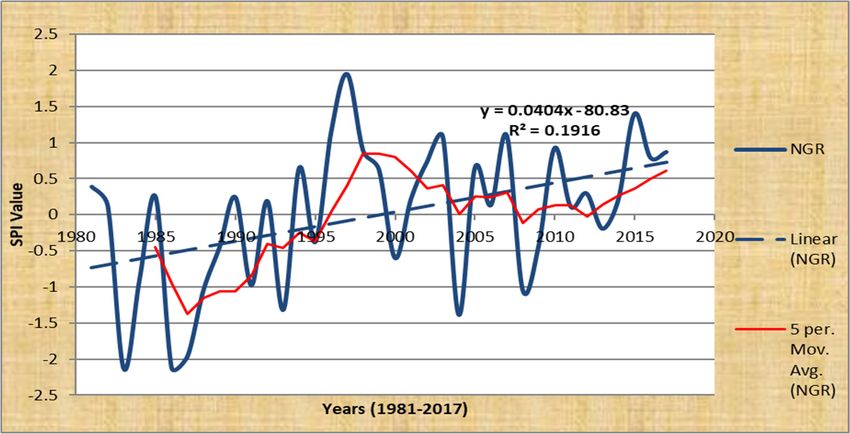
ep.ccsenet.org Environment and Pollution Vol. 10, No. 2; 2021
during the study period
Yt = f(T) (1)
Where Yt = annual rainfall and temperature
T = time
Explicit for
Yt =λ o + λ1 T
Where λ o = constant
λ 1 = coefficient of time
CDST= f (Annual Rainfall) (2)
CDST t 0 1 ARF t et .......... .......... .......... .......... .......... .......... ........( 3)
WMST t 0 1 ARF t et .......... .......... .......... .......... .......... .......... ........( 4)
ARFt 0 1 HDST t et .......... .......... .......... .......... .......... .......... ........( 5)
4. Results and Discussion
Local indicators used for seasonal weather prediction
Table 1. People perception on reliability of local indicators for weather prediction
Indicators Reliability
Astronomical Fair
Meteorological Excellent
Plants phenology Good
Animals behavior Good
The discussant generally agreed that the use of meteorological indicators in seasonal weather prediction is the most
reliable. The use of astronomical indicators lack expertise as very few people have the knowledge now. This is
because of the religious believe that is discouraging the use of astronomical knowledge in prediction.
Table 2. Knowledge on local indicators based on seasonal weather
Signs Descriptions in relation to seasonal weather
The higher the total annual rainfall the lower the cold dry and warm moist seasonal
Annual rainfall amount
(hamattan) and temperature
Hot dry season
The higher the hot dry season temperature the higher the annual rainfall amount
temperature
Wind speed The higher the hot dry seasonal wind speed the higher the annual rainfall
Rainfall variability pattern of Nguru (1981-2017)
The descriptive statistics of Nguru station monthly rainfall (1981-2017) are presented in table 3 and figure 2. The
decadal standardised precipitation index and annual rainfall variability trend are presented in table 4 and figure 2.
36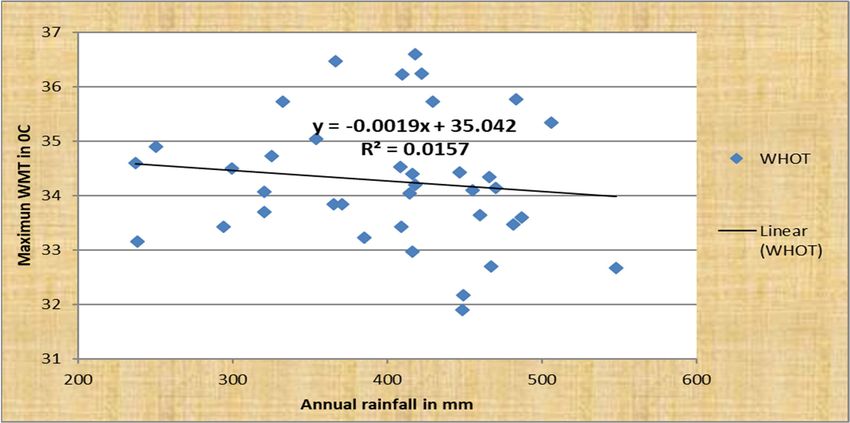
ep.ccsenet.org                                Environment and Pollution                         Vol. 10, No. 2; 2021

Table 3. Nguru monthly rainfall descriptive statistics (1981-2017)
            MEAN      MAX        MIN    STDV      Skewness     Kurtosis    Coefficient    Count of rain>51mm
                                                                           of Variance    (%)
   JAN      0         0          0      0         -            -           0              0
   FEB      0         0          0      0         -            -           0              0
   MCH      0.4       14         0      2.4       -            34          536            0
   APR      3         38         0      8.4       2.9          8.8         248            0
   MAY      8.8       49         0      12        1.9          3.9         131            0
   JUN      33        110        4      24        1.2          1.3         73             30
   JUL      135       314        29     62        0.5          0.3         42             92
   AUG      161       281        74     49        0.6          0.7         29             100
   SEP      62        186        5      35        1.1          3.1         57             0
   OCT      5         39         0      8         2.7          8.1         186            0
   NOV      0         0          0      0         -            -           -              0
   DEC      0         0          0      0         -            -           -              0
   RDY      31        53         17     8         0.5          0.7         25             -
   ARF      408       616        237    85        -0.5         -0.3        19             -
  DRT 63            95       35         15        -            -           24             -
Source: Author Analysis (2018)

                          Figure 2. Nguru monthly rainfall distribution rainfall (1981-2017)
Source: Author Analysis (2018)

                                                         37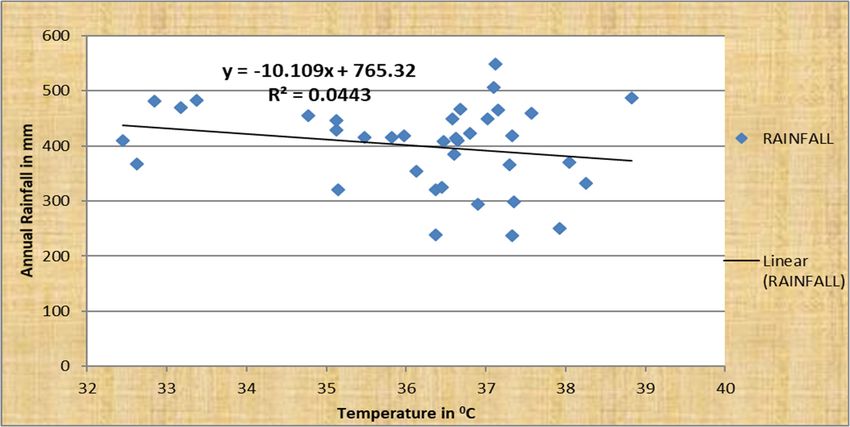
ep.ccsenet.org                                        Environment and Pollution                     Vol. 10, No. 2; 2021

                         600
                                                           y = 3.0869x + 340.87                     AnRF
        Rainfall in mm   500                                    R² = 0.1916

                         400
                                                                                                     Linear
                                                                                                    线性
                         300                                                                        (AnRF)
                         200                                                                         5 per.
                                                                                                    5Mov.
                                                                                                      移动平
                         100                                                                        均Avg.
                                                                                                    (AnRF)
                           0
                            1981   1986    1991      1996     2001      2006      2011     2016

                                    Figure 3. Nguru annual rainfall variability trend (1981-2017)
Source: Author Analysis (2018)

The analysis results revealed significant year-to-year variability in rainfall characteristics around these 37 years
(1981-2017) averages, much more than Potiskum station (Jajere 2020). The variability in rainfall attributes of the
station was significant in the 1980s up till 1990s and lower between 2000 to 2018, as in fig.3 while, Jury and
Isabella, 2002; Anyamba and Tucker, 2005 report decreasing trend in the amounts of rainfall with increasing
variability in the West African Sudano-Sahelian region, in the last 50years (1963-2013). Annual rainfall and rainy
days fluctuate between the Maximum of 616mm to a minimum of 237mm and a Maximum of 53days to a minimum
of 17days, respectively. Large scale variability in annual rainfall and rainy days was observed with a standard
deviation of 85mm from the average of 408mm and 8days from the average 31days, respectively. Monthly, the
onset and cession months of July and September shows large variability with a standard deviation of 62mm from
the average of 135mm and 35mm from the average of 62mm, respectively. The annual rainfall variability trend
result shows an increasing annual trend of 3.1mm. Thus, the variability is statistically insignificant at a 0.2 R2
value.
Every month, the station records precipitation from March to October. Thus, the threshold of 51mm was recorded
from July to September within the study period. Except for August, the Minimum rainfall below 51mm was
recorded in all of the month within the period. The Month of August, which records the peak of the season, shows
a dramatic variability trend with a Maximum of 161mm and a minimum of 74mm, which is slightly above 51mm
thresh hold. As shown in figure 6, the station records eight rainy months with only three months with a rainfall
threshold of 51mm.

                                                                 38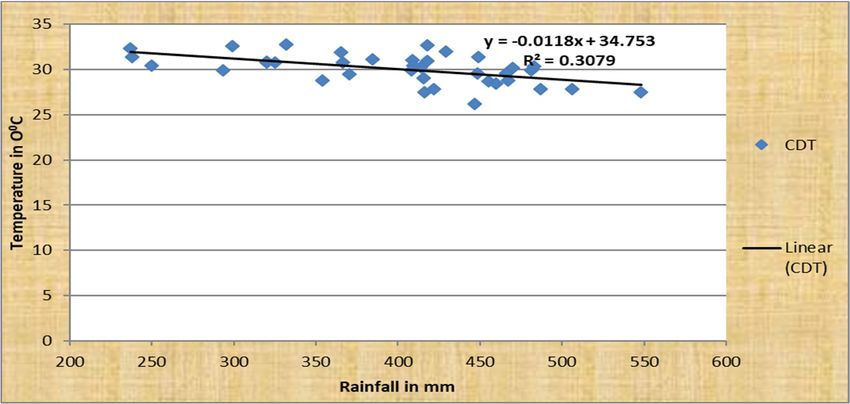
ep.ccsenet.org                              Environment and Pollution                          Vol. 10, No. 2; 2021

                            Figure 4. Nguru station SPI variability trend (1981-2017)
Source: Author Analysis (2018)

Table 4. Descriptive summary of Nguru station SPI (1981-2017)
                 Drought Intensity       SPI Values           Number of Years     Percentage
                 Categories
                 Extremely wet           >2                               0             0
                 Very wet                1.5 to 1.99                      1              3
                 Moderately wet          1 to 1.50                        4             11
                 Near normal             -0.99 to 0.99                   25             68
                 Moderately drought      -1 to -1.49                      4             11
                 Severally drought       -1.5 to -1.99                    1              3
                Extremely drought        -2<                              2              5
Source: Author Analysis (2018)

                                                         39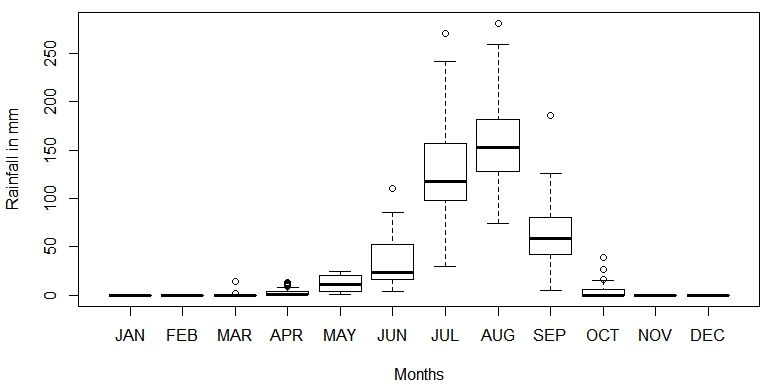
ep.ccsenet.org                               Environment and Pollution                           Vol. 10, No. 2; 2021

                          Figure 5. SPI trend and moving averages in Nguru (1981-2017)
Source: Author Analysis (2018)

Within the study period, the rainfall pattern at Nguru records 25years of near-normal wetness. The station recorded
7years of dryness; extreme drought in 1983 and 1986, severe drought in 1986, moderate drought in 1988, 1993,
2004 and 2008. Five (5) years of wetness were also recorded, with a very wet season in 1997 and moderate wetness
in 1996, 2003, 2007 and 2015. This study’s findings confirm Usman, Abdulhamid, and Sawa (2015) that reports
shift toward wetter condition. A similar study by Stephen and Tobi (2014) in their study of 90years of rainfall
distribution across all climatic zones of Nigeria report common change points and transitions from dry to wet
(upward shift) in all climatic zones.

Table 5. Decadal rainfall seasonality indices in KYRB Downstream (1981-2017)
                 Period             Seasonality Index                            Remark
     1981-1990                              1.3              Most rain in three months or less
     1991-2000                              1.2              Most rain in three months or less
     2001-2010                              1.2              Most rain in three months or less
    2011-2017                               1.4              Most rain in three months or less
Source: Author Analysis (2018)

The seasonality index analysis from 1981 to 2017 revealed that seasonal rainfall spread is primarily concentrated
within 3months. Thus, the higher values observed in the 1980s and 2011-2017 reveal that the rainfall spread during
the periods occurs in less than 3months.

                                                        40
ep.ccsenet.org Environment and Pollution Vol. 10, No. 2; 2021
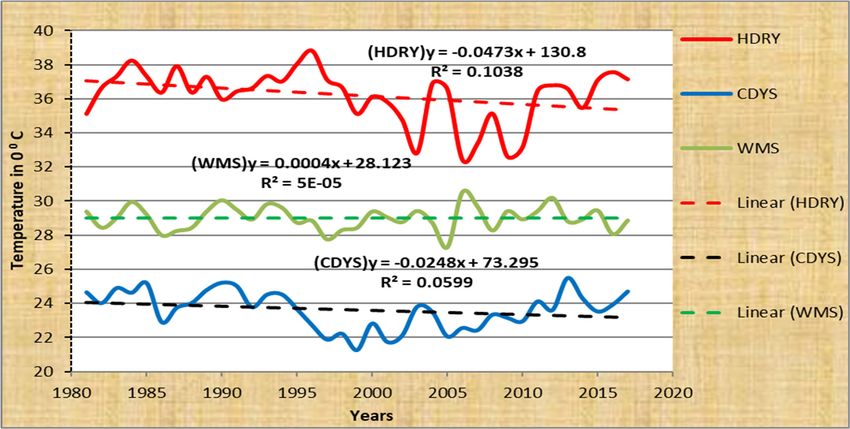
4.1 Nguru Station Temperature Pattern during the Study Period
Table 6. Descriptive summary of seasonal temperature of Nguru (1981-2017)
Mean temp Max temp Min temp Diurnal temp
CDS HDS MWS CDS HDS MWS CDS HDS MWS CDS HDS MWS
Mean 23.8 30.6 28.0 29.9 37.1 33.5 17.7 24.2 22.5 12.2 13.0 11.0
Max 25.6 32.3 29.4 33.0 39.2 35.7 20.7 26.3 25.7 17.7 16.8 14.1
Min 20.6 28.5 26.1 25.0 34.6 31.15 14.1 21.7 20.5 8.1 9.9 6.3
Stdv 1.4 0.9 0.9 2.24 1.12 1.23 1.3 1.2 1.24 2.3 1.3 1.7
Skwe -0.9 -0.8 -0.2 -0.8 -0.3 -0.02 -0.5 -0.1 0.9 0.18 -0.1 -0.5
Kurt -0.1 0.11 -0.8 -0.1 -0.4 -0.8 1.1 -0.4 0.7 -0.6 1.4 0.41
CV 2.05 0.9 0.8 5.0 1.3 1.5 1.7 1.3 1.5 5.19 1.8 2.97
Note; CDS, Cold dry season; HDS, Hot dry season; MWS, Moist warm season
Source: Author’s Analysis (2018)
4.2 Nguru Station Cold Dry Season Temperature Pattern during the Study Period
The cold, dry season at Nguru Station falls between months November to February, with January being the coldest
month. The Maximum cold, dry season temperature of Nguru fluctuates between the Maximum of 33°C to
Minimum of 25°C with a standard deviation of 2.2°C from the average of 30°C. At the same time, the minimum
temperature of the season fluctuates between the Maximum of 20.7°C to Minimum of 14.1°C with a standard
deviation of 1.3°C from the average of 17.7°C. The cold, dry season begins in mid of November and ends in the
mid of March. The result of monthly temperature descriptive statistics revealed that March is colder than
November Within the season. The maximum temperature falls below 30°C between December and February, while
the minimum temperature falls below 17°C. The variability in the cold, dry season temperature revealed large
scale variability of 30%, with an annual decreasing trend of 0.1°C during the study period.
4.3 Nguru Station Hot Dry Season Temperature Pattern during the Study Period
The hot, dry season at Nguru Station falls between months April to July, with May been the hottest month. The
Maximum hot, dry season temperature of Nguru fluctuates between the Maximum of 39.15°C to Minimum of
34.6°C with a standard deviation of 1.1°C from the average of 37.1°C. In contrast, the minimum temperature of
the season fluctuates between the Maximum of 25.6°C to Minimum of 20.6°C with a standard deviation of 1.4°C
from the average of 23.8°C. The maximum temperature of the season rises above 40°C between April and July,
while the minimum temperature falls below 30°C. The variability in hot, dry season temperature revealed small
scale variability of 10%, with an annual decreasing trend of 0.05°C during the study period.
4.4 Nguru Station Warm Moist Season Temperature Pattern during the Study Period
The Maximum moist warm-season temperature of Nguru fluctuates between the Maximum of 35.7°C to Minimum
of 31.2°C with a standard deviation of 1.2°C from the average of 33.5°C. In comparison, the minimum temperature
of the season fluctuates between the Maximum of 25.7°C to Minimum of 20.5°C with a standard deviation of
1.2°C from the average of 22.5°C. The maximum temperature of the season falls below 38.5°C between August
and October, while the minimum temperature falls below 29°C. The variability in warm moist season temperature
revealed variability of only 0.5%, with an increasing annual trend of 0.005°C during the study period.
41ep.ccsenet.org Environment and Pollution Vol. 10, No. 2; 2021
Figure 6. Nguru Seasonal Temperature Variability Trend
Source: Author Analysis (2018)
4.5 Relationship between Annual Rainfall and Seasonal Temperature
Theoretically, rainfall amount influence temperature at both local and regional scale. The local knowledge of
people in the Sahel on seasonal rainfall and temperature prediction shows that there is a relationship between
rainfall and cold, dry season temperature and hot, dry season temperature and seasonal rainfall pattern.
Table 7. Annual rainfall and seasonal temperature of Nguru
CDS HDS WMS Ann RF
CDS 1 -0.222 0.085 -0.424**
HDS 0.222 1 -0.36* -0.282
WMS 0.085 -0.36* 1 0.091
Ann RF -0.424** -0.282 0.091 1
** Significant at 99% * Significant at 95%
(CDS= Cold dry season HDS= Hot dry season WMS = Warm moist season, Ann RF =Annual rainfall)
The result of the correlation coefficient in table 5 revealed a statistically significant negative relation between
annual rainfall and cold, dry season temperature at a 99% level of significance. The impact of annual rainfall on
cold, dry season temperature was estimated using linear regression. The result of the regression coefficient is
presented in table 5.
Table 8. Impact of annual rainfall on cold dry season temperature
Coefficients
Model Unstandardized Coefficients Standardized Coefficients T Sig.
B Std. Error Beta
1 (Constant) 34.753 1.213 28.655 .000
ARF -.012 .003 -.555 -3.946 .000
a. Dependent Variable: CDST
Source: Author Analysis (2018)
42ep.ccsenet.org Environment and Pollution Vol. 10, No. 2; 2021
The local knowledge on climate variability prediction enables them to understand the relationship between annual
rainfall and seasonal temperature. They assume that annual rainfall determines the Cold, dry season temperature,
i.e. the higher the annual rainfall, the lower the cold, dry season temperature. This study used a linear regression
equation model to validate their assumption. Based on the estimated model, the annual rainfall has a statistically
significant negative impact on cold, dry season temperature. This implies that an increase in annual rainfall
decreases the cold, dry season temperature; the annual rainfall pattern accounts for 31% variability in cold, dry
season temperature. According to the model results, any 1mm increases in annual rainfall decrease the cold, dry
season temperature by 0.02°C.
Figure 7. Relationship between rainfall and cold dry season temperature
Source: Author Analysis (2018)
Table 9. Regression coefficient of the impact hot dry season temperature on rainfall
Model Unstandardized Standardized t Sig.
Coefficients Coefficients
B Std. Error Beta
1 (Constant) 765.316 287.363 2.663 .012
HDRY -10.109 7.934 -.211 -1.274 .211
Source: Author Analysis (2018)
According to their perception, the perceptions of the local population on rainfall variability prediction are that
annual rainfall is a function of Hot dry season temperature, i.e. Hot dry season temperature is the major driver of
annual rainfall variability according to their perception, the higher the hot, dry season temperature the lower the
annual rainfall. The hot, dry season temperature has a statistically insignificant negative impact on annual rainfall
based on the estimated model. This implies that an increase in hot, dry season temperature decrease the annual
rainfall amount. According to the model results, any 1% increases in temperature during the hot, dry season
decreases annual rainfall by 10mm.
43ep.ccsenet.org Environment and Pollution Vol. 10, No. 2; 2021
Figure 8. Relationship between rainfall and hot dry season temperature
Source: Author Analysis (2018)
Table 10. Regression coefficient of the impact hot dry season temperature on rainfall
Model Unstandardized Standardized t Sig.
Coefficients Coefficients
B Std. Error Beta
1 (Constant) 35.272 1.053 33.483 .000
Ann RF -.005 0.003 -.282 -1.738 .091
a Dependent Variable: MWST
Figure 9. Relationship between rainfall and warm moist season temperature
Source: Author Analysis (2018)
44ep.ccsenet.org Environment and Pollution Vol. 10, No. 2; 2021
The linear regression analysis presented in fig.9 revealed that rainfall has a negative relationship with Warm moist
season temperature (i.e. the higher the annual rainfall, the lower the warm moist season temperature). The result
shows that the impact of annual rainfall on warm moist season temperature is not significant as it accounts for only
2% of the variability in warm moist season temperature. Any 1mm increase in annual rainfall lower the warm
moist season temperature by 0.002°C
5. Discussion
The findings of this study are confirmed by the study of Tinyiko and John (2016). The study found a positive
correlation between rainfall and temperature on the monthly time scale and a negative correlation between the
variables on an annual time scale. Generally, the temperatures trend line within the study period shows a decreasing
trend, as against the ICPC reports of an increase in average global temperature. The study of Aiyelokun Oluwatobi
and Odekoya Oluwakemi (2016) on atmospheric temperature variability in Ijebu-Ode, Southwest Nigeria, with
the use of parametric (Least Square Regression) and non-parametric (Mann Kendall) test. Reported a general
increase in air temperature since 1983. Also, Dammo et al. (2015) reported a significant increase (positive trend)
in temperature in North-Eastern Nigeria during 1981-2010. The temperature decreasing trend in the study area
may not be unconnected with the rising rainfall of the Sahel. Several empirical studies reported a negative
relationship between rainfall and temperature (Peter, 2012; Kevin and Denis, 2005; Rong-Gang and Mark, 2012).
Available empirical studies on local knowledge on climate prediction in African largely focused on identifications
and documentation of the indicators. (Ladislaus, Pius and James 2010; Kijazi et-al .2013; Chikaire J. U. et-al. 2018;
Maren Radeny et-al. 2019) confirmed that rural farmer of different part of Africa used Astronomical,
meteorological and biological indicators in weather forecasting. Although the accuracy level of local knowledge
was not been adequately investigated. According to Maren Radeny et-al. (2019) coordinated research and
systematic documentation of IK for weather forecasting, including accuracy and reliability of IK are steal largely
lacking.
5.1 The Implication to Research and Practice
Rainfall and temperature are major climatic elements that determined the general ecosystem function and services.
The type of crop to be produce and output is primarily a function of seasonal rainfall and temperature. Rainfall
can be supplemented through irrigation, but temperature modification for crop production is impossible or cost-
effective. The Hamadan season temperature of Sahel fall low 30C, which can support the production of some
temperature crops like Irish Potatoes. The result of this study will be used in regional agricultural planning and
other developmental planning.
6. Conclusion
The rainfall variability result revealed significant year-to-year variability in rainfall characteristics around these
37years (1981-2017) averages. Every month, a threshold of 51mm was recorded from May to October. Within the
study period, a 100% monthly threshold (51mm) count was recorded only in August. The annual rainfall variability
coefficient of 21 was recorded. Between 1981 to 2017, drought index results revealed that 5, 25 and 7 seasons of
wetness, near normal and dryness was observed, respectively. Generally, the variability in rainfall attributes was
significant in the 1980s up till the 1990s and lower between 2000 and 2017. The monthly temperature variability
within the study period was large. Thus August and September show lower fluctuation when compared with other
months. The mean annual temperature variability is much lower than the monthly and seasonal mean. Hot, dry
season and cold, dry season temperature show more considerable variability than a warm moist season. The
fluctuation of temperature attribute during the study period was significant in the 1980s to mid-1990s than what is
observed in 2000 to 2017. Generally, the temperatures trend line within the study period shows a decreasing trend.
The hot, dry season and cold, dry season temperature show a decreasing trend of -0.05°C and -0.025°C at a
statistically significant R-value of 0.32 and 0.24. In contrast, warm moist season temperature shows a statistically
insignificant increasing trend of 0.0004°C. Annual rainfall amount accounts for 31% and 2% variability in cold
dry and warm moist season temperature, respectively. Cold, dry season and warm moist season temperature
respond to any 1mm increase in annual rainfall by decreasing by 0.012°C and 0.002°C, respectively.
References
Aiyelokun, O., & Odekoya, O. (2016). Analysis of Trend and Variability of Atmospheric Temperature in Ijebu-
Ode, Southwest Nigeria. International Research Journal of Agricultural Science and Soil Science, 6(2), 25-
31.
Anyamba and Tuckers. (2005). Analysis of Sahelian vegetation dynamics using NOAA-AVHRR NDVI data from
1981–2003. Journal of Arid Environments, 63, 596–614. https://doi.org/10.1016/j.jaridenv.2005.03.007
45ep.ccsenet.org Environment and Pollution Vol. 10, No. 2; 2021
Chang’a, L. B., Pius, Z. Y., & James, N. (2010). Indigenous knowledge in seasonal rainfall prediction inTanzania:
A case of the South-western Highland of Tanzania. Journal of Geography and Regional Planning, 3(4), 66-
72. Retrieved from http://www.academicjournals.org/JGRP
Chikaire, J. U., Ajaero, J. O., Ibe, M. N., Orusha, J. O., & Onogu, B. (2018). Relevance of Indigenous Knowledge
in Weather and Climate Forecast for Planning Farm Activities by Farmers in Imo State, Nigeria. Agri Res &
Tech: Open Access J, 19(1). https://doi.org/10.19080/ARTOAJ.2018.19.556082
Dammo, M. N., Ibn Abubakar, B. S. U., & Sangodoyin, A. Y. (2016). Trend and Change Analysis of Monthly and
Seasonal Temperature Series Over North-Eastern Nigeria. Journal of Geography, Environment and Earth
Science International, 3(2), 1-8. https://doi.org/10.9734/JGEESI/2015/18512
Jajere, A. A. (2020). Wetlands Response to Climate Variability: Emperical Evendence from Kumadugu-Yobe River
Basin. An Unpublished P.h. D thesis Submitted to Department Geography and Environmental Management.
Ahmadu Bello University Zaria. Nigeria.
Jury, M. R., & Isabelli, G. (2002). Decadal climate variability in the Eastern Caribbean. Journal of Geophysical
Research: Atmospheres (1984–2012), 116(D21). https://doi.org/10.1029/2010JD015107
Kijazi, A. L., Chang’a, L. B., Liwenga, E. T., Kanemba, A., & Nindi, S. J. (2013). The use of indigenous knowledge
in weather and climate prediction in Mahenge and Ismani wards, Tanzania. Journal of Geography and
Regional Planning, 6(7), 274-280. https://doi.org/10.5897/JGRP2013.0386
Ladislaus, B., Chang’a, Pius, Z. Y., & James, N. (2010). Indigenous knowledge in seasonal rainfall prediction in
Tanzania: A case of the South-western Highland of Tanzania. Journal of Geography and Regional Planning,
3(4), 66-72.
Makwara Enock, C. (2013). Indigenous Knowledge Systems and Modern Weather Forecasting: Exploring the
Linkages. Journal of Geography and Regional Planning, 6(7), 274-280.
Maren, R., Ayal, D., Drake, M., Florence, K., Henry, M., John, R., Philip, K., & Dawit, S. (2019). Indigenous
knowledge for seasonal weather and climate forecasting across East Africa. Climatic Change, 156, 509–526.
https://doi.org/10.1007/s10584-019-02476-9
Okonya, J. S., & Jürgen, K. (2013). Indigenous knowledge of seasonal weather forecasting: A case study in six
regions of Uganda. Agricultural Sciences, 4(12), 641-648. https://dx.doi.org/10.4236/as.2013.412086
Peter, E. A. (2012). An Assesment of Rainfall and Temperature Variations in Selected Stations in parts of Northern
Nigeria. Ph.D Thesis A Thesis in the Department of Geography and Planning, University of Jos.
Radeny, M., Ayal, D., Drake, M., Florence, K., Henry, M., John, R., Philip, K., & Dawit, S. (2019). Indigenous
knowledge for seasonal weather and climate forecasting across East Africa. https://doi.org/10.1007/s10584-
019-02476-9
Rong-Gang, C., & Mark, B. (2012). The Interdependence Between Rainfall and Temperature: Copula Analysis.
The Scientific World journal. https:/doi.org/10.1100/2012//405675
Stephen, B. O., & Tobi, E. M. (2014). Rainfall distribution and change detection across climatic zones in Nigeria.
Weather and Climate Extremes, 5-6, 1–6. https://doi.org/10.1016/j.wace.2014.10.002
Usman, S. U., Abdulhamid, A. I., & Sawa, B. A.(2015). An Assesement of Spatio-Temporal Variability of Drought
in The Semi-arid Zone of Nigeria Using Standardized Precipitation Index. Zaria Geographer, 22(1), 98-108.
Zuma-Netshiukhwi, G., Kees, S., & Sue, W. (2013). Use of Traditional Weather/Climate Knowledge by Farmers
in the South-Western Free State of South Africa: Agrometeorological Learning by Scientists Atmosphere.
https://doi.org/10.3390/atmos4040383
Copyrights
Copyright for this article is retained by the author(s), with first publication rights granted to the journal.
This is an open-access article distributed under the terms and conditions of the Creative Commons Attribution
license (http://creativecommons.org/licenses/by/4.0/).
46You can also read


