Ozone-Depleting Substances Concentrations - gov.epa.cfpub
←
→
Page content transcription
If your browser does not render page correctly, please read the page content below
Report on the Environment             https://www.epa.gov/roe/

Ozone-Depleting Substances Concentrations
Ozone, a gas present throughout the Earth’s atmosphere, is a pollutant at the Earth’s surface but
forms a protective layer in the stratosphere, helping shield the Earth from the sun’s ultraviolet (UV)
radiation. Exposure to UV radiation is associated with skin cancer, cataracts, and other human health
and ecological problems (U.S. EPA, 2006).
Starting in the late 1970s, stratospheric ozone levels were observed to be declining due to worldwide
releases of various human-produced chemicals referred to as ozone-depleting substances (ODS),
particularly halocarbons such as the long-lived chlorofluorocarbons (CFCs), bromine-containing
halons, and methyl bromide. Through rapid catalytic reactions with ozone, the chlorine and bromine
from these chemicals have depleted the protective ozone layer (see the Stratospheric Ozone Levels
indicator).
Worldwide production and consumption of ODS are being progressively phased out under the
provisions of the 1987 Montreal Protocol on Substances that Deplete the Ozone Layer. In the U.S.,
EPA implements the Montreal Protocol as well as Title VI of the Clean Air Act to reduce the use
and emissions of ODS. Over time, reducing the atmospheric loading of ODS is expected to result in
global increases in stratospheric ozone. However, because some ODS have long atmospheric
lifetimes, and because of pre-phaseout ODS stockpiling for post-phaseout use, atmospheric
concentrations of ODS have only recently begun to stabilize and in some cases begun to decline.
While some gases, like methyl chloroform, decay quickly in the atmosphere, other gases, like CFCs
and halons, have atmospheric lifetimes on the order of hundreds or thousands of years.
Different measures are used to track long-term trends in atmospheric concentrations of ODS. First,
the National Oceanic and Atmospheric Administration (NOAA) has developed an Ozone Depleting
Gas Index (ODGI) as a measure of the combined contributions of ODS to stratospheric chlorine and
bromine (Newman et al., 2007; NOAA, 2020; WMO, 2018). This aggregate index is calculated
from ground-based measurements of numerous individual ODS at remote locations worldwide, with
adjustments to account for the lag time for ODS to travel from the troposphere to the stratosphere.
Separate ODGI values are reported for mid-latitudes and for Antarctica. For purposes of this
indicator, mid-latitudes are considered 35 to 60 degrees north latitude, which roughly corresponds to
latitudes for North America. An ODGI value of 100 percent represents the year with the highest
potential for ozone depletion based on the NOAA measurements. Over mid-latitudes, this occurred
in 1997, and over Antarctica, this occurred in 2001 and 2002. Conversely, an ODGI value of 0
percent represents the estimated load of ODS for 1980. The eventual return of ODS values to their
1980 levels (i.e., an ODGI value of 0 percent) is considered a significant milestone; however, some
ODS-catalyzed stratospheric ozone depletion will still occur at these levels.
The second measure commonly used to track long-term trends is concentrations of individual ODS
(e.g., carbon tetrachloride, methyl bromide) and groups of ODS (e.g., hydrochlorofluorocarbons,
halons). The measure reported in this indicator is the equivalent effective chlorine concentration
(EECl). These values represent ODS concentrations weighted by their potential to catalyze the
destruction of stratospheric ozone.
This indicator presents ODS trends using both measures described above based on measurements
from the NOAA Climate Monitoring and Diagnostics Laboratory between 1992 and 2019. The
longest running remote sampling locations include: Alert, Northwest Territories, Canada; Point
Barrow, Alaska; Niwot Ridge, Colorado; Mauna Loa, Hawaii; American Samoa; Cape Grim,
Tasmania, Australia; and the South Pole (Montzka et al., 1999). Because most ODS have long
atmospheric half-lives, the ODS concentrations shown in this indicator reflect past and recent
contributions from emissions sources within the U.S. and worldwide.
What the Data Show
ODGI values for mid-latitudes increased between 1992 and 1997 and then steadily decreased
through 2019 (Exhibit 1). The 2019 value (53.4 percent) suggests that ODS levels have progressed
46.6 percent towards returning to their estimated 1980 values from their peak in 1997. Similarly,
ODGI values for Antarctica increased between 1992 and 2002 before decreasing through 2019
(Exhibit 1). The recent value for Antarctica suggests that 2019 ODS levels in that region have
progressed 22.1 percent of the way from peak levels to the 1980 levels.
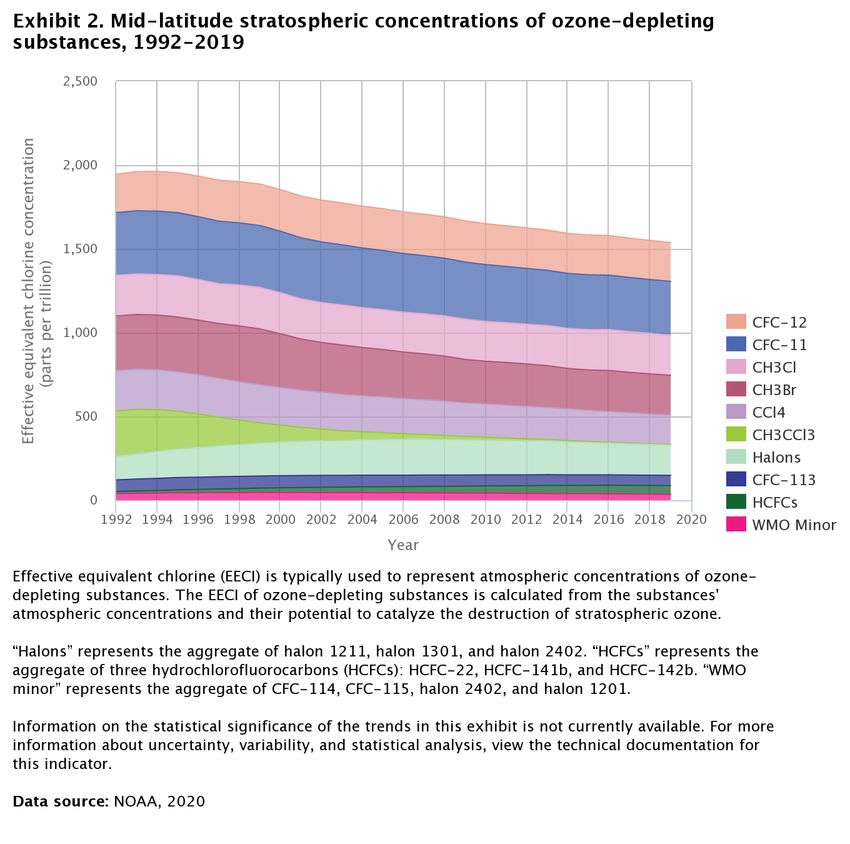
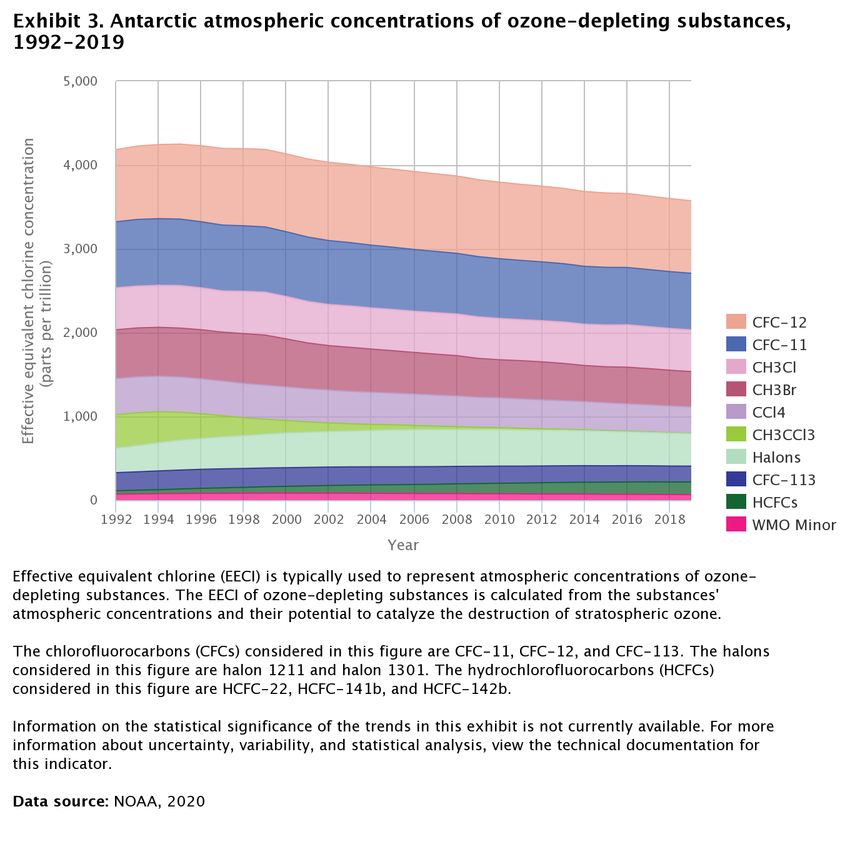
Long-term trends in EECl concentrations of individual ODS vary across chemicals and region. For
each substance, tropospheric EECl levels over mid-latitudes are consistently lower than the
corresponding levels over Antarctica (Exhibits 2 and 3). In both regions, EECl concentrations of
methyl chloroform decreased dramatically (i.e., by more than 98 percent) between 1992 and 2019.
Over the same time frame, EECl concentrations for methyl bromide, carbon tetrachloride, and
CFC-11 also decreased in both regions, but by smaller amounts (i.e., between 14 and 28 percent). On
the other hand, EECl concentrations of several ODS increased in both regions between 1992 and
2019 (Exhibits 2 and 3). This occurred for halons, CFC-12, and some hydrochlorofluorocarbons.
While the concentration of CFC-11 decreased each year from 1995 to 2019, the rate of decrease
slowed starting in 2014. In mid-2018, a higher than expected atmospheric concentration of CFC-11
was detected (Montzka et al., 2018). Atmospheric modeling suggested that these concentrations
resulted from an increase in CFC-11 emissions from new production and use in eastern mainland
China, inconsistent with the Montreal Protocol agreement to phase out global chlorofluorocarbon
production and consumption by 2010 (Rigby et al., 2019). Following efforts from the United States
and other parties to the Montreal Protocol to address the unexpected emissions, CFC-11
concentrations are again decreasing at their earlier rate, and no delay of the healing of the ozone
layer is expected (Montzka et al., 2021).
In summary, although tropospheric concentrations of some ODS compounds have begun to decline,
concentrations of others have not yet stabilized. The relatively slow decline of CFCs is generally a
result of continued emissions of CFCs from stockpiles and their long atmospheric lifetimes. The
increase in certain ODS likely results from continued emissions from stockpiles and continued
production and consumption of certain ODS in both developed and developing countries.
Limitations
The calculation of EECl depends on the understanding of the interactions and atmospheric
residence times of many different gases; incorrect knowledge about these factors could affect
trends in the EECl.
EECl is calculated by weighting each ODS’s concentration by the substance’s ability to
catalyze destruction of stratospheric ozone, or the ozone depletion potential. The ozone
depletion potentials used to transform the data have inherent uncertainties, which can affect
the trend analyses.
Factors additional to trends in halocarbons affect trends in stratospheric ozone. These factors
include changes in climate (e.g., temperature, winds), changes in emissions and concentrationsof trace gases like nitrous oxide and methane, and changes in aerosol loading such as occurs
after an explosive volcanic eruption.
Data Sources
Concentrations of ODS presented in this indicator are based on measurements made by NOAA’s
Global Monitoring Division. The 1992–2019 data are taken from NOAA’s Ozone Depleting Gas
Index website (NOAA, 2020) ( https://www.esrl.noaa.gov/gmd/odgi/).
References
Montzka, S.A., J.H. Butler, J.W. Elkins, T.M. Thompson, A.D. Clarke, and L.T. Lock. 1999.
Present and future trends in the atmospheric burden of ozone-depleting halogens. Nature
398(6729):690-694.
Montzka, S.A., G.S. Dutton, P. Yu, E. Ray, R.W. Portmann, J.S. Daniel, L. Kuijpers, B.D. Hall, D.
Mondeel, C. Siso, J.D. Nance, M. Rigby, A.J. Manning, L. Hu, F. Moore, B.R. Miller, and J.W.
Elkins. 2018. An unexpected and persistent increase in global emissions of ozone-depleting CFC-11.
Nature 557:413–417. https://www.nature.com/articles/s41586-018-0106-2.
Montzka, S.A., G.S. Dutton, R.W. Portmann, M.P. Chipperfield, S. Davis, W. Feng, A.J. Manning,
E. Ray, M. Rigby, B.D. Hall, C. Siso, J.D. Nance, P.B. Krummel, J. Mühle, D. Young, S.
O'Doherty, P.K. Salameh, C.M. Harth, R.G. Prinn, R.F. Weiss, J.W. Elkins, H. Walter-Terrinoni,
and C. Theodoridi. 2021. A decline in global CFC-11 emissions during 2018−2019.
Nature 590:428–432. https://www.nature.com/articles/s41586-021-03260-5.
Newman, P.A., J.S. Daniel, D.W. Waugh, and E.R. Nash. 2007. A new formulation of equivalent
effective stratospheric chlorine (EESC). Atmos Chem Phys 7:4537-4552.
NOAA (National Oceanic and Atmospheric Administration). 2020. Ozone Depleting Gas Index
website. Last accessed July 27, 2020. https://www.esrl.noaa.gov/gmd/odgi.
Rigby, M, S. Park, T. Saito, L.M. Western, A.L. Redington, X. Fang, S. Henne, A.J. Manning, R.G.
Prinn, G.S. Dutton, P.J. Fraser, A.L. Ganesan, B.D. Hall, C.M. Harth, J. Kim, K.R. Kim, P.B.
Krummel, T. Lee, S. Li, Q. Liang, M.F. Lunt, S.A. Montzka, J. Mühle, S. O’Doherty, M.K. Park, S.
Reimann, P.K. Salameh, P. Simmonds, R.L. Tunnicliffe, R.F. Weiss, Y. Yokouchi, and D. Young.
2019. Increase in CFC-11 emissions from eastern China based on atmospheric observations. Nature
569:546–550. https://www.nature.com/articles/s41586-019-1193-4.
U.S. EPA (United States Environmental Protection Agency). 2006. Air quality criteria for ozone and
related photochemical oxidants. EPA/600/R-05/004aF-cF. Research Triangle Park,
NC. https://cfpub.epa.gov/ncea/risk/recordisplay.cfm?deid=149923.
WMO (World Meteorological Organization). 2018. Scientific assessment of ozone depletion: 2018.
Geneva, Switzerland. https://community.wmo.int/scientific-assessment-ozone-depletion-2018.You can also read