OPSENS, INC. (TSX:OPS) (OTCQX:OPSSF) - INVESTOR PRESENTATION 2021
←
→
Page content transcription
If your browser does not render page correctly, please read the page content below

OpSens, Inc.
(TSX:OPS) (OTCQX:OPSSF)

Investor Presentation 2021

                             OPSSF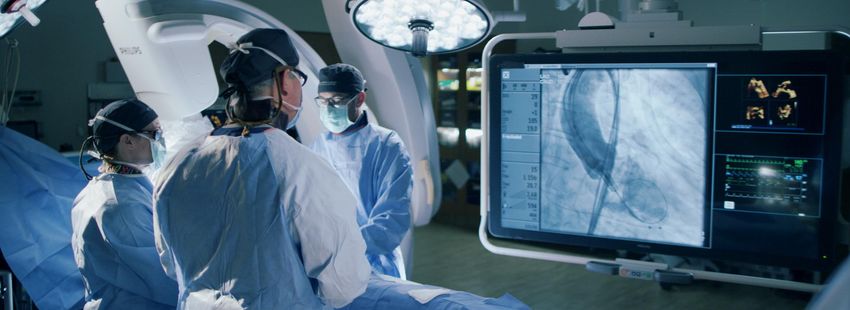
Forward Looking Statement

    This presentation contains forward-looking statements with respect to the Company. These forward-looking statements, by their nature, require the Company to make
    certain assumptions and necessarily involve known and unknown risks and uncertainties that could cause actual results to differ materially from those expressed or implied
    in these forward-looking statements. Forward-looking statements are not guarantees of performance. These forward-looking statements, including financial outlooks, may
    involve, but are not limited to, comments with respect to the Company’s business or financial objectives, its strategies or future actions, its targets, expectations for financial
    condition or outlook for operations and future contingent payments. Words such as “may,” “will,” “would,” “could,” “expect,” “believe,” “plan,” “anticipate,” “intend,”
    “estimate,” “continue,” or the negative or comparable terminology, as well as terms usually used in the future and conditional, are intended to identify forward-looking
    statements.

    The Company quarterly reviews net earnings (loss) and Earnings Before Interest, Taxes, Depreciation, Amortization and Stock-based compensation costs (“EBITDAO”).
    EBITDAO has no normalized sense prescribed by IFRS. It is not very probable that this measure is comparable with measures of the same type presented by other issuers.
    EBITDAO is defined by the Company as the addition of net earnings (loss), financial expenses (income), depreciation and amortization and stock-based compensation costs.
    The Company uses EBITDAO for the purposes of evaluating its historical and prospective financial performance. This measure also helps the Company to plan and forecast for
    future periods as well as to make operational and strategic decisions. The Company believes that providing this information to investors, in addition to IFRS measures, allows
    it to see the Company’s results through the eyes of management, and to better understand its historical and future financial performance.

2
OpSens Overview
Cardiovascular Business Based on Proprietary Optical Technology
Diagnostic and Treatment Rapidly Growing Applications

    Ventricular assist device                                                                                          ▪   Transcatheter Aortic Valve
    Abiomed - Impella Heart Pump                                  BUSINESS PARTNERSHIPS        AORTIC VALVE STENOSIS       Replacement (TAVR) utilizing
    ▪ 5-year supply agreement                                                                    Expansion Business        proprietary OpSens guidewire
          ▪ signed in 2019                                                                        $4 B WW Market1      ▪   Commercialization Expected in
    Neurology – Laser ablation                                                                                             2022
    Monteris
    ▪ Neuroblate Optic® Laser probes

    OptoWire – Flagship product                                                                                                  100,000+
    ▪ Physiological measurement                                                                                                  Patients
              ▪   Fractional Flow Reserve (FFR)                                CORONARY ARTERY DISEASE                           Evaluated/Treated with
              ▪   Diastolic Pressure Ratio (dPR)                                 Current Core Business                           OpSens’ Product for
    ▪   Commercialized since 2015                                                  $1 B WW Market                                Coronary Heart Blockages

                                                                                                                                  2,000+
                                                                                                                                  Monitors Installed
3       1. Global TAVR/Implantation, Kenneth Research – Just. 1
OpSens - Investment Highlights
                                                                                                                                                                                                             FY ends August 31st
                                                                                                                                                  CA $ M                            Core Revenue Growth
                                                                                                                                                                                (excluding licensing revenue)
   •     Strong Core Revenue growth (+50%) between 2016 and 2019                                                                                     $35
                                                                                                                                                                                                     $29.4       $29.5
                                                                                                                                                     $30
            •     Lead by continuous growth in FFR (Coronary Artery Disease)                                                                         $25                              $22.0
                  product                                                                                                                            $20
                                                                                                                                                     $15
                                                                                                                                                                        $16.4                                                 $17.1

                                                                                                                                                     $10
                                                                                                                                                               $9.2

   •     Potential breakthrough product (TAVR) to address the $4 billion1                                                                             $5
                                                                                                                                                      $0
         Aortic Valve Stenosis market                                                                                                                          2016      2017          2018          2019        2020       YTD-2021

            •     Commercialization in 2022                                                                                                                                FFR       Other medical      Industrial

                                                                                                                                                  CA $ M                         Adjusted EBITDAO (excluding
   •     Significant improvement in adjusted EBITDAO driven by:                                                                                      $4
                                                                                                                                                                                     licensing revenue)*
                                                                                                                                                                                                                          $2.2
            •     Growth in revenue                                                                                                                  $2
                                                                                                                                                                                                              $0.1

            •     improvement in gross margins                                                                                                       $0
                                                                                                                                                                                               ($0.4)
                                                                                                                                                    ($2)

                                                                                                                                                    ($4)                             ($2.6)
   •     $28.75 M bought deal public offering – Feb. 2021                                                                                           ($6)               ($4.7)

                                                                                                                                                    ($8)
                                                                                                                                                              ($7.4)
                                                                                                                                                               2016    2017          2018       2019         2020        YTD-2021

*Comparative figures for 2016 to 2019 have not been adjusted to reflect the adoption of IFRS 16 - Lease Agreements as defined in the Company’s accounting policy.

  4       1. Global TAVR/Implantation, Kenneth Research - Just. 1
Coronary Artery Disease

OpSens’ OptoWire for Physiological Measurement

Coronary Artery Disease: Market

                                                                                                                   FFR/dPR
                                                                                                           Global Market (US$ Million)
          Coronary Artery Disease Overview
          Blockage or narrowing (stenosis) of the arteries                        The Global FFR Market is expected to                                                              $1B

          that supply blood to the heart muscle, often due                        reach US$1 billion by 2025, growing at a
          to a buildup of fatty plaque inside the arteries,                       CAGR* of 10% between 2019-2025                                                            $660
          which may cause a heart attack.                                                                                                                            $600

                                                                                                                                                              $520

                                                                                                                                                       $456
                                                                                                                                            $400

          2009          FAME1             Trial Creates Market                                                              $300
                                                                                                                                    $350

          In 2009, the FAME Study showed that when FFR is                                                           $250
                                                                                                            $207
          used prior to percutaneous coronary intervention                                          $167
          (PCI), patient outcomes are improved.                                             $124
                                                                                     $75

                                                                                    2009    2010    2011    2012    2013    2014    2015    2016       2017   2018   2019   2020   Beyond
                                                                                                                                                                                   (2025)
                                                                                   *Compound annual growth rate

6   1. Jan 15, 2009 NEJM 2009; 360:213-224 DOI: 10.1056/NEJMoa0807611 – Just. 2   St-Jude Medical 2015 – Investor Conference, (2015-02-06) – Just. 3
                                                                                  Based on growth projected in Global FFR Market 2016-2020 – Just. 4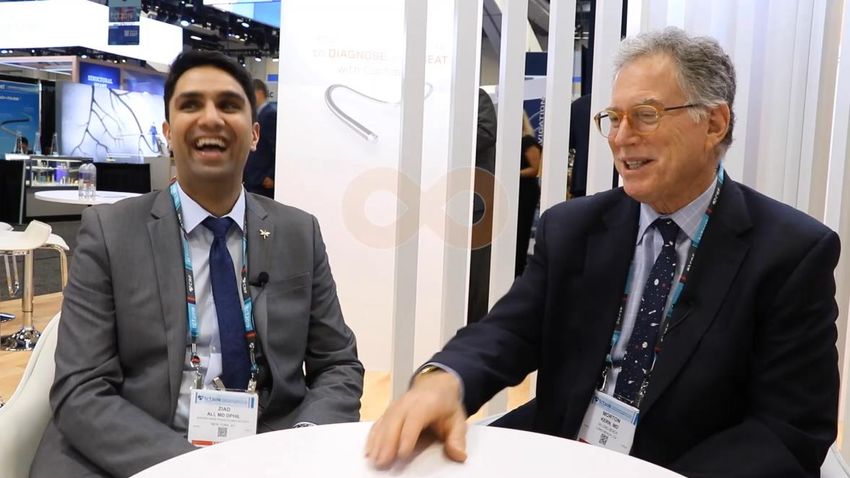
Coronary Artery Disease: Procedure Flow

        Diagnose                     Treat                        Confirm
                                                                                     FFR Scale
    Coronary Disease        +   Coronary Disease         +     PCI Treatment

                                                                                                 >0.80 may be treated
                                                                                                 without stent

    Cardiologist measures       Cardiologist delivers        Cardiologist measures                 0.80
    blood pressure              stent to blockage over       blood pressure
    before/after a              the OptoWire.                before/after the
    blockage to obtain a                                     blockage again to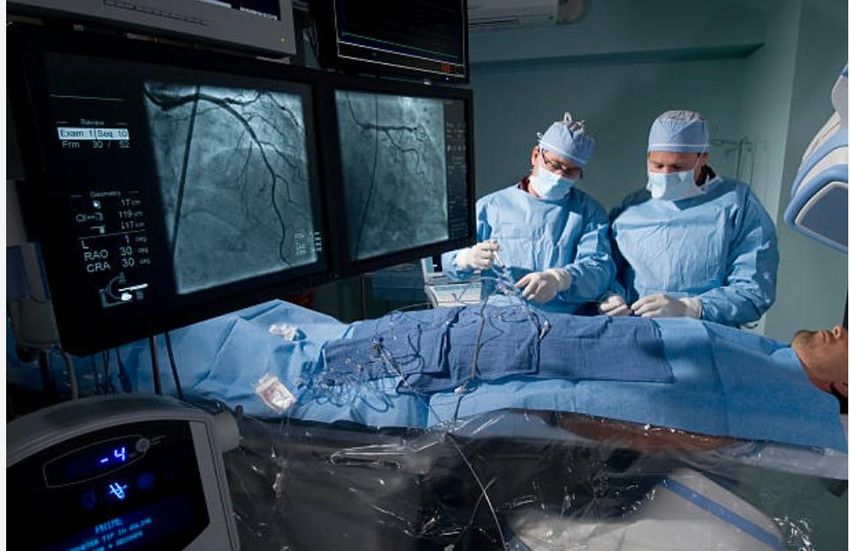
Coronary Artery Disease: Example of Treatment

                                    Watch video

8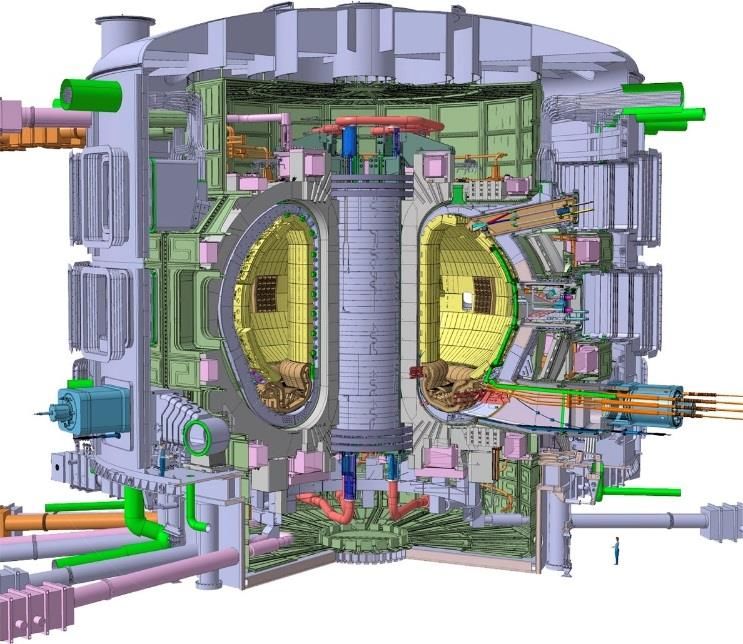
Coronary Artery Disease: OptoWire Competitive Advantages
             Performance – Superior Guidability                                               Improved Accuracy                                 Freedom in Workflow
        Access complex anatomies with workhorse-like performance                                  Repeat measurements                          Manipulate like your WH guidewire and
                                                                                                  with the same accuracy                         assess post-PCI and multi-vessels

          Current market
    leading pressure guidewires:        Workhorse (WH)              OpSens’ OptoWire
                                         guidewires:              2nd generation pressure
    ✓ 3 Electrical wires                                                guidewire:
    ✓ Small SS inner core                                                                         1st gen fiber optic   2nd gen fiber optic
                                                                                                                                              Reliable disconnect/reconnect feature on
    ✓ Core offset from center      ✓ Central Fiber Optic Wire   ✓ Concentric design                                                                       optical handle unit
      creates whipping & limited   ✓ Large inner core           ✓ Large inner core
      torqueability                ✓ Nitinol Core               ✓ Nitinol Core              Temperature dot technology absorbs
                                                                                               dilatation and reduces drift

                     WORKHORSE PERFORMANCE:                                                 ACCURACY: 2nd generation                              CONNECTIVITY: Optical
                     Pressure guidewire design, excellent                                   fiber optic sensor designed                           contact immune to
                     shape retention = control, torque,                                     to provide lowest drift in the                        procedural contaminants -
                     support for easy vessel access.                                        industry, consistent,                                 Disconnect/reconnect with
                                                                                            repeatable measurements.                              confidence to diagnose and
                                                                                                                                                  deliver stents on the same
                                                                                                                                                  guidewire.

9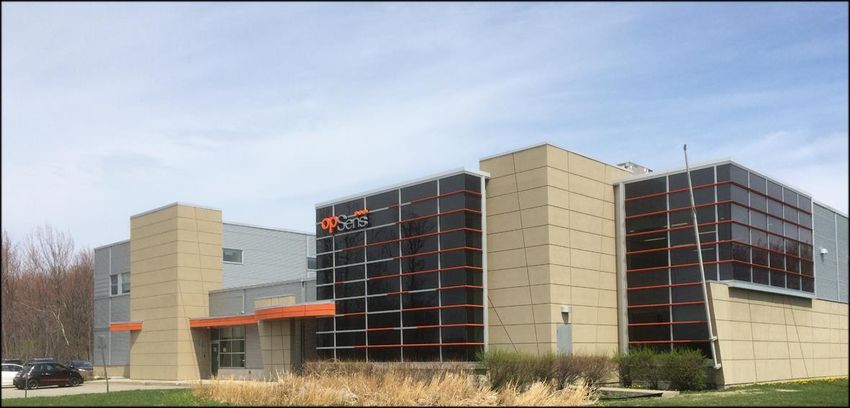
Coronary Artery Disease: OptoWire Competitive Advantages
                  ACCURACY (DRIFT)                                                                              WORKHORSE/CONNECTIVITY

                             Drift in pressure wires

                             Electronic wires

                             ▪     St Jude Medical < 7 mmHg / hour
                             ▪     PhilipsVolcano < 30 mmHg / hour

                             New fiber optic wires

                             ▪     OpSens              < ~0 mmHg / hour

     “Something about technical pitfalls: The most annoying is drift. And drift is inherent to   “Let’s get to one more point I think this program highlighted and that was the post-PCI
     all electronic pressure wires. Drift and e-pressure wires is given here for St. Jude        FFR. Now, Dr. Uretsky’s group has been using the OptoWire as a primary wire—workhorse
     Medical is less than 7 mm per hour and the Volcano wire it is small and a maximum of        wire all the way through finishing with FFR. Give me your thoughts on how often we
     30 mm per hour. There’s the new fiberoptic wires—I have some experience with                should do that or why we’re not doing it more.”
     OpSens—note the drift is actually ZERO.” Dr. Nico Pijls, Catharina Hospital,
                                                                                                 “Well, I am going to start with why we’re not doing it more and that is because of the
     Netherlands
                                                                                                 technology. So up until really—the OpSens wire which handles more like a workhorse wire
                                                                                                 than any other wire but has an incredible feature in its connect/reconnect. So, being able
                                                                                                 to disconnect this, maneuver it, and reconnect it without really a significant change in
                                                                                                 pressure really gets you to the point in which it makes it easy to do a post-PCI physiological
                                                                                                 assessment.” [Dr. Ziad Ali, Columbia University Medical Center/New York-Presbyterian
                                                                                                 Hosp. & Dr. Morton J. Kern, Chief of Medicine at Long Beach VA Medical Center, California]

10
Coronary Artery Disease: OpSens’ OptoWire
FFR/dPR OptoWire Revenue
Global Market Share Breakdown (CA$ M)
OptoWire 38% 5-Year CAGR* $20.0
(OpSens) $18.7
4%
Others $14.2
6% $12.4
$5.2
Electrical Wires
(Abbott/Phillips)
90% $0.0
2015 2016 2017 2018 2019 2020
*Compound annual growth rate
FY ending August 31st
11Coronary Artery Disease: OptoWire Sales Channels*
Canada Japan
▪ Sales Channels: Direct ▪ Sales Channels: Distributor
▪ Market Size: US$20 M ▪ Market Size: US$90 M
▪ OptoWire Market Share: 15% ▪ OptoWire Market Share: 15%
United States EMEA
▪ Sales Channels: Direct/GPO ▪ Sales Channels: Distributors
▪ Market Size: US$225 M ▪ Distributors: Multiple
▪ OptoWire Market Share: 3% ▪ Market Size: US$135 M
▪ OptoWire Market Share: 7%
The OptoWire has been used in more than 100,000 cases
Currently 2,000+ OptoMonitors installed across the world, creating revenue recurrence and a base for additional product offerings
12 *2019 figuresCoronary Artery Disease: Manufacturing Efficiencies Driving Margin Expansion
OptoWire COGS Improvements OptoWire COGS*
53% TTM
PRODUCT MARGINS
▪ Major improvements in manufacturing
efficiencies in the last three years
▪ OptoWire III driving significant additional
savings
▪ Economies of scale with volume increase.
2016
2017
2018
2019
2020
*COGS Cost of Goods Sold
Chart reflects OptoWire COGS with exact dollar figures hidden for competitive reasons
13Coronary Artery Disease: OpSens’ Growth Drivers
OptoWire
Continued Market Growth of more than 10% Annually
Create GPO Relationships in the U.S. to drive adoption in
1,400 Cath Labs – already two GPO with major players – one
of them, Vizient represents one third of all U.S. cathlabs
(approx. 700)
OptoMonitor
U.S. Launch of dPR Capabilities
Worldwide Launch of Next Generations
OptoWire III
OptoMonitor III
14Aortic Valve Stenosis OpSens Guidewire for TAVR Procedure
Aortic Valve Stenosis
OpSens is developing the industry’s first
TRANSCATHETER AORTIC-VALVE REPLACEMENT GUIDEWIRE that can
▪    DELIVER THE VALVE and allow for
▪    CONTINUOUS PRESSURE MEASUREMENT,
Key attributes in optimal valve positioning.

16
Aortic Valve Stenosis: Transcatheter Aortic Valve Replacement (TAVR) Market

                                                                                    Aortic Valve Stenosis Market
                                                                                            (US$ Billion)2
           Disease Overview
                                                                                                                                     $8.2
           Aortic valve stenosis occurs when the heart's        The Aortic Valve Stenosis Market is
           aortic valve narrows. This narrowing prevents        expected to reach US$8 billion by
           the valve from opening fully, reducing or            2025,
                                                                                                                              $6.3
           blocking blood flow from the heart into the          CAGR of 43% between 2019-2025
           main artery to the body (aorta) and onward to
           the rest of the body.
                                                                                                                       $4.6

           TAVR vs SAVR Studies1                                                               $3.6

           In multiple studies, minimally invasive TAVR is               $2.8

           shown to be superior to open chest Surgical
           Aortic Valve Replacement (SAVR), including
           reduction in hospital stay and decrease in
           death, for both high and low risk patients.
                                                                         2017                  2019                    2021   2023   2025

17   1. March 16, 2019, at NEJM.org. - Just. 5 and 6         2. Global TAVR/Implantation, Kenneth Research – Just. 1
Aortic Valve Stenosis: Key Factors in Evaluating TAVR Guidewire Options
Pressure measurement guidewire in TAVR procedures will be key to confirm valve positioning
Need: Optimal Valve Positioning World’s largest aortic valve manufacturer has no
guidewire to deliver valve = significant opportunity
OpSens’ continuous pressure measurement guidewire to gain guidewire market share
enables optimal valve positioning and repositioning
Guide wire Continuous
Improve Cardiologist and Hospital Workflow Player Delivering Aortic Pressure
Valve Measurement
OpSens’ guidewire allows for a single wire to diagnose
and deliver the valve, potentially reducing
complications, saving time and money
BSC ꭗ ꭗ
Edwards √ ꭗ
Leverage Existing Footprint
Medtronic √ ꭗ
With its first product, OpSens created a global sales &
distribution network, installing 2,000+ adaptable
OptoMonitors which can be leveraged for TAVR. √ √
18 1. Quantified Benefits of OpSens TAVR Wire Final Presentation, Confidential Advisors, August 16, 2019 – Just. 7Aortic Valve Stenosis – On the Forefront
Mick Jagger - How to fix a rocker’s heart
▪ Underwent the procedure in 2020
▪ Back on the stage a few weeks later
Watch Radio Canada segment on Mick Jagger’s story – in French only
https://ici.radio-canada.ca/tele/decouverte/site/segments/reportage/153144/jagger-coeur-tavi or
https://www.facebook.com/DecouverteRC/videos/1042187592826498/
19Aortic Valve Stenosis: Product Development Timeline*
2021 2022
J M M J S N J M M J S N
Animal Studies
Design phase
First use on human
1. Canada Health Canada Filing Approval Market
2. United States FDA Filing 510K Market
3. Europe CE Filing CE Market
*Civil Calendar
20OpSens - Partnership Ventricular assistance (heart pump) and other medical applications
Ventricular Assist Device: Abiomed Partnership for Impella® Heart Pump
     Abiomed Agreement
     Pre-2014: Strategic Partnership
     ▪ OpSens and Abiomed have ongoing partnership to integrate OpSens’
       sensor into Impella to provide blood pressure measurements that can
       be used to enhance Impella’s performance and ease-of-use.
     April 2014: License and Upfront Payment
     ▪ Abiomed acquired exclusive worldwide license to OpSens’ miniature
       optical pressure sensor which was to be integrated into Impella to help
       further automate its control and operation in cath labs.
       Abiomed paid US$6 M to OpSens.
     April 2018: FDA Approval and Milestone Payment
     ▪ Abiomed received FDA approval for Impella, triggering an additional
       US$500,000 payment to OpSens.
     April 2019: Supply Agreement
     ▪ Abiomed and OpSens agreed to a five-year agreement to supply the
       critical component for Impella. Contract includes mutual renewal
       clauses.

22
Industrial Segment Innovative fiber optic measurement solutions for industrial applications Take advantage of OpSens' proprietary technology to offer solutions for TEMPERATURE, PRESSURE, STRAIN/DEFORMATION, LINEAR DISPLACEMENT, FORCE AND LOAD for a variety of industries, including AERONAUTICS - fuel monitoring SEMICONDUCTORS - temperature assessment during manufacturing MILITARY - validation of electro-explosive devices NUCLEAR - infrastructure monitoring.
Industrial Segment
Recent Highlights

     OpSens Solution awarded a contract from
     RI Research Instruments GmbH for absolute
     and differential fiber optic pressure sensors for
     the International Experimental Thermonuclear
     Reactor (ITER).

     ITER: World's largest nuclear fusion and scientific
     experimentation project - 35 nations committed to building
     and demonstrating a safe, carbon-free, almost unlimited
     nuclear fusion-based potential energy source.                Tokamak Reactor - ITER

24
Financials
Key Accomplishments And 2021 Goals

              Recent Accomplishments                                       Near-Term Goals

                                                                                                                   FY
 FDA Clearance to Market Diastolic Pressure Algorithm    Growing Revenues and Financial Results                   2021
 ("dPR")
                                                                                                                 Summer
                                                         First-In-Man for Aortic Valve Stenosis (TAVR) Product    2021

 Signing of Five-Year Agreement with Abiomed to
 Supply Critical Component of Impella Heart Pump         Signing of New GPO Agreements to Accelerate U.S.          FY
                                                                                                                  2021
                                                         Growth in Coronary Artery Disease Market
 Signing of Two Major GPO Agreements to Expand U.S.
 Coronary Artery Disease Market – one of them,           Increased Critical and Revenue Growth for OpSens’         FY
                                                                                                                  2021
 Vizient, represents one third of U.S. Cathlabs (±700)   Industrial Activities
                                                                                                                   FY
 Approval for OW III - U.S., Japan, Canada & Europe      Potential Uplisting to a Major American Exchange         2021

 $28.75 Million Bought-Deal Financing

26
Income Statement
$CAD FY Ended August 31, 2019* FY Ended August 31, 2020 FY Ended August 31, 2021
Q1 Q2 Q3 Q4 FY 2019 Q1 Q2 Q3 Q4 FY 2020 Q1 Q2
Revenues
Sales 6 800 800 7 255 400 7 525 900 7 867 100 29 449 200 6 989 000 8 258 000 6 630 000 7 576 000 29 453 000 8 319 000 8 810 000
Others 2 302 000 663 500 336 900 - 3 302 400 - - - - - 17 000 19 000
Total Revenue 9 102 800 7 918 900 7 862 800 7 867 100 32 751 600 6 989 000 8 258 000 6 630 000 7 576 000 29 453 000 8 336 000 8 829 000
Cost of sales 3 461 000 3 361 400 3 339 200 3 875 000 14 036 400 3 079 000 4 009 000 2 986 000 3 760 000 13 834 000 3 664 000 4 260 000
Gross Margin 5 641 800 4 557 500 4 523 600 3 992 100 18 715 200 3 910 000 4 249 000 3 644 000 3 816 000 15 619 000 4 672 000 4 569 000
Gross Margin (%) 62.0% 57.6% 57.5% 50.7% 57.1% 55.9% 51.5% 55.0% 50.4% 53.0% 56.0% 51.7%
Product Sales Gross Margin (%) 49.1% 53.7% 55.6% 50.7% 52.3% 55.9% 51.5% 55.0% 50.4% 53.0% 56.0% 51.6%
Expenses (revenues)
Administrative expenses 1 112 400 1 126 000 1 194 800 1 160 000 4 593 200 1 475 000 1 249 000 1 301 000 1 015 000 5 040 000 1 469 000 1 488 000
Sales and marketing expenses 2 422 700 2 460 100 3 059 000 3 174 500 11 116 300 2 850 000 2 835 000 1 637 000 1 458 000 8 780 000 1 588 000 1 555 000
R&D expenses 1 073 400 1 319 000 1 293 000 1 115 500 4 800 900 1 296 000 1 423 000 1 411 000 1 312 000 5 442 000 1 295 000 1 284 000
4 608 500 4 905 100 5 546 800 5 450 000 20 510 400 5 621 000 5 507 000 4 349 000 3 785 000 19 262 000 4 352 000 4 327 000
Other income - - - - - - - (801 000) (882 000) (1 683 000) (490 000) (110 000)
Financial income (revenues) (59 500) 26 700 30 000 159 300 156 500 160 000 124 000 44 000 356 000 684 000 216 000 293 000
Income (loss) before income taxes 1 092 800 (374 300) (1 053 200) (1 617 200) (1 951 700) (1 871 000) (1 382 000) 52 000 557 000 (2 644 000) 594 000 59 000
Income Tax - - - - - - - - - - - 19 000
Net loss & comprehensive loss 1 092 800 (374 300) (1 053 200) (1 617 200) (1 951 700) (1 871 000) (1 382 000) 52 000 557 000 (2 644 000) 594 000 40 000
Basic and diluted net earnings (loss) per share 0.01 (0.00) (0.01) (0.02) (0.02) (0.02) (0.02) 0.00 0.01 (0.03) 0.01 0.00
Number of common shares outstanding 89 923 762 89 968 817 90 017 143 90 017 143 90 180 317 90 266 031 90 280 317 90 280 317 90 280 317 90 280 317 90 280 317 106 652 410
*FY 2019 Comparative figures have not been adjusted to reflect the adoption of IFRS 16 – Leases as set out in the Company’s accounting policy.
27Balance Sheet Highlights
$CAD August 31, 2018 August 31, 2019 August 31, 2020 February 28, 2021
Cash and cash equivalents 10,886,800 14,856,000 10,884,000 39,313,000
Accounts receivable, net 2,816,300 5,115,200 4,041,000 5,246,000
Inventory 5,220,000 5,133,100 6,505,000 5,825,000
Total current assets 19,785,200 26,099,000 22,543,000 51,249,000
Property, plant and equipment 3,174,900 2,962,300 3,230,000 2,953,000
Intangible assets 625,900 1,027,200 1,622,000 1,706,000
Right-of-use assets 0 0 4,513,000 4,752,000
Total assets 23,586,000 30,088,500 31,908,000 60,660,000
Current liabilities 3,438,300 4,787,200 5,655,000 7,092,000
Long-term debt 653,700 7,135,000 6,608,000 5,881,000
Lease liabilities 0 0 4,298,000 4,540,000
Shareholders’ equity 18,673,000 17,440,700 15,347,000 43,147,000
February 25, 2021: $28.75 M bought deal financing
(includes $3.75 M over-allotment option exercised in full)
28Appendix
Core Revenue Growth – 2016 to 2019
                                               Annual
                                         FY ends August 31st
                          $35

                          $30                                        $29.4          $29.5
                                                                      $2.4           $2.4

                          $25
                                                     $22.0            $7.0           $8.4
                 CA $ M   $20
                                                      $2.1

                                                                                            $17.1
                                       $16.4          $5.7
                                        $1.5                                                  $2.0
                          $15
                                        $2.5                                                  $3.7

                          $10   $9.2                                 $20.0
                                                                                    $18.7   $8.3
                                $3.2                 $14.2
                                $0.8   $12.4                                                 $11.4
                          $5
                                $5.2

                          $0
                                2016   2017          2018            2019           2020    YTD-2021
                                               FFR   Other medical     Industrial

30
Gross Margins (excluding others revenue)*
Annual
60%
FY ends August 31st
50%
40%
30%
53.0% 53.0% 54.0%
49.0%
20%
37.0%
10%
11.0%
0%
2016 2017 2018 2019 2020 YTD-2021
Product Gross Margins
*Comparative figures for 2016 to 2019 have not been adjusted to reflect the adoption of IFRS 16 - Lease agreements as set out in the Company’s accounting agreement.
The adoption of IFRS 16 - Leases on September 1, 2019 , contributed to an increase in gross margin of $58,000 or 0.00% for the year ending August 31, 2020.
31Adjusted EBITDAO (excluding others revenue)*
Annual
FY ends August 31st
$4
$2.2
$2
$0.1
$0
($0.4)
CA $ M
($2)
($2.6)
($4)
($4.7)
($6)
($8) ($7.4)
2016 2017 2018 2019 2020 YTD-2021
*Comparative figures for 2016 to 2019 have not been adjusted to reflect the adoption of IFRS 16 - Lease Agreements as set out in the Company’s accounting agreement.
The adoption on September 1, 2019 of IFRS 16 - Leases contributed to an increase of $715,000 in EBITDA for the year ending August 31, 2020.
32Facility overview
Quebec City, Canada
750 Boulevard du Parc-Technologique
Québec, QC
Canada G1P 4S3
Total employees: ~180
Total square footage: 30,000 total; 5,500 of clean room space
Certifications: FDA registered, ISO 13485, MDCAF Canada
Last FDA inspection date: February 6–8, 2017; no 483s
33Executive Management Team President & Chief Executive Officer / Louis Laflamme Chief Financial Officer / Robin Villeneuve President, OpSens Solutions / Gaétan Duplain Louis Laflamme became President, CEO and Director of OpSens in 2013. Robin Villeneuve recently served as Chief Financial Officer for Federal Gaétan Duplain has been President of OpSens Solutions since October He had been CFO and Corporate Secretary of the Company since 2005. Fleet Services Inc., a private maritime company. Prior to that, he 2006. His primary responsibilities are to oversee the energy sector’s His main tasks are to define and execute the Company’s strategy worked as Chief Financial Officer for seven years at Virginia Mines Inc., research activities by orienting the main lines of commercial and toward shareholders and the financial community in operational a company listed on the Toronto Stock Exchange. He was part of the intellectual property development, planning the work and administrative activities. From March 2005 to November 2005, he was team that oversaw and successfully negotiated the sale of Virginia implementing the Corporation’s action plan. In 1994, he co-founded Director, Finance and Administration for DEQ Systems Corp. Mines to Osisko Gold Royalties Ltd. He previously held several strategic FISO Technologies Inc., a company manufacturing fiber optic sensors, (TSXV:DEQ), a manufacturer and distributor of electronic systems. From financial positions for AbitibiBowater Inc. now known as Produits where acted as Vice-President from 1994 to 2003. With this company, 2002 to 2005, he held positions within the administration department Forestiers Résolu Inc. Robin Villeneuve began his career and completed Mr. Duplain acquired experience in high-tech business development including that of VP Finance at TGN biotech inc., a company specializing his initial training with PricewaterhouseCoopers. He holds a Bachelor’s and strategic planning. He obtained a Bachelor’s degree in Physical in R&D in biotechnology. From January 2002 to July 2002, he also degree in Business Administration from Université Laval, is a member of Engineering from Université Laval in 1985 and a Master’s degree in served as Corporate Controller at St-Raymond Forest Products Ltd., a the Order of Chartered Professional Accountants of Quebec and is also Optics and Laser from the same university in 1986. manufacturer of wood veneer. From 1998 to 2001, he was Chief of a certified corporate director. Mission in certification consulting at Samson Bélair/Deloitte & Touche LLP. Mr. Laflamme is a member of Quebec’s Order of Chartered Professional Accountants since 2001. He received a BA in Business Administration from Université Laval in 1998. 34
Board of Directors
        Executive Chairman of the Board / Alan Milinazzo                                                     Director / Denis Sirois
        Alan Milinazzo is a Partner at Heidrick & Struggles’, Boston, and a member of the Global             Denis M. Sirois is President & CEO of Telesystem Energy. since January 2017, a clean
        Healthcare and Life Sciences Practice in Medical Devices. Prior to joining Heidrick & Struggles,     technology company which has developed the world’s most efficient and reliable
        he was CEO of InspireMD, a pioneer in embolic prevention systems for coronary and vascular           river hydrokinetic system producing renewable, baseload power.
        applications. He previously served as President and CEO of Orthofix International N.V., a $600 M     He also acts as VP – Investments of Telesystem. since March 2006. Telesystem is a
        publicly traded global orthopedic and Spine Company, as well as general manager of                   technology focused family office with long-term value creation and innovation as
        Medtronic’s coronary and peripheral vascular businesses where he was instrumental in the             principals. Telesystem has invested over $1.3 B globally in venture opportunities of
        development and commercialization of key products, including the company’s first coronary            all stages and have concluded more than $22 B of transactions since inception. He
        drug-coated stent platform. He spent 12 years with Boston Scientific in global sales and             has over 20 years of experience in corporate finance, mergers and acquisitions and
        marketing leadership roles during a period of unprecedented growth in the cardiology                 private equity. Through his career, He has been involved in transactions of all sizes,
        franchise.                                                                                           ranging from start-ups to multinational corporations. Mr. Sirois currently sits on the
        Director / Jean Lavigueur, CPA                                                                       Board of Telesystem (and affiliates), Telesystem Energy, OpSens, Northstar Earth
        Jean Lavigueur is, since 2006, CFO of Coveo Solutions, a company in enterprise search engines.       and Space, and journal Le Devoir.
        He was, from 2007 to 2012, director of iPerceptions (TSXV:IPE), a web-focused customer
        analytics provider. He was Chairman of iPerceptions’s Audit Committee and President of the           Director / Pat Mackin
        Special Committee of independent directors when the company was sold and privatized. Mr.             Pat Mackin is President, CEO and Chairman of CryoLife, Inc. (NYSE:CRY) since
        Lavigueur served on the Board of Cossette (TSX:KOS) and was responsible for the audit                September 2014, a leader in the manufacturing, processing, and distribution of
        committee and special committee of independent directors until December 2009, when the               implantable living tissues and medical devices in cardiac surgical procedures.
        company was sold and privatized. He was co-founder of Taleo (NASDAQ:TLEO), a company                 CryoLife markets and sells products in over 80 countries. Before joining CryoLife,
        providing management services and hiring talent on the Internet and was CFO from 1999 to             from 2007 to 2014, he was President of the Cardiac Rhythm Disease Management
        2005, after serving in other roles, including VP, Finance. From 1996 to 1999, he was CFO of Baan     Division at Medtronic (NYSE:MDT). From 2004 to 2006, also at Medtronic, he held
        Supply Chain Solutions, a company in enterprise resource planning (ERP) and from 1991 to             the positions of VP, Vascular, Western Europe where he launched the Corporation’s
        1996, CFO of Group Berclain, a firm in management solutions for assembly lines that had              first drug-eluting stent and VP and General Manager, Endovascular Business Unit.
        subsequently been acquired by Baan. Prior to joining the Group Berclain, he worked within            Prior to joining Medtronic, from 1996 to 2002, he worked for six years at Genzyme,
        divisions of audit and tax Coopers & Lybrand (now PriceWaterhouseCoopers SRL / LLP), a firm of       Inc., serving as Senior VP and General Manager for the Cardiovascular Surgery
        public accountants. Mr. Lavigueur holds a B.A.A. from Université Laval and has been a certified      Business Unit and as Director of Sales, Surgical Products division. From 1991 to
        professional accountant since 1986.                                                                  1996, He spent five years at Deknatel/Snowden-Pencer, Inc. in various sales and
                                                                                                             marketing roles and three years as an Officer in the US Army. Mr. Mackin received
        Director / Denis Harrington
                                                                                                             an MBA from the Kellogg School of Management at Northwestern University and is
        Denis Harrington is the owner of Denis L Harrington Consulting, LLC a management and strategy
                                                                                                             a graduate of the US Military Academy at West Point.
        consulting firm he established in 2012 after nearly 30 years of successful leadership roles in the
        US Army and the Medical Device Industry. Recently, Denis served as CEO for BridgePoint
        Medical, leading BridgePoint from development stage through commercialization to an
                                                                                                             President & Chief Executive Officer / Louis Laflamme
        acquisition by Boston Scientific in 2012. Denis came to BridgePoint Medical from Boston
                                                                                                             See Executive Management Team for bio.
        Scientific where he spent 18 years. Denis’ last role at BSC was as Senior VP of US Cardiology,
        Rhythm and Vascular Sales – managing over 1800 people and $3 B in revenue.
                                                                                                             President, OpSens Solutions / Gaétan Duplain
                                                                                                             See Executive Management Team for bio.

35
Reconciliation Of EBITDAO To Net Earnings (Loss)
FY ends August 31st
YTD-2021
$CAD 2016* 2017* 2018* 2019* 2020*
Feb. 28 2021
Net Earnings (loss) (9,282,000) (6,537,000) (4,550,000) (1,952,000) (2,644,000) 635,000
Financial Expenses (income) 57,000 (7,000) (50,000) 157,000 684,000 509,000
Depreciation of property, plant and
549,000 699,000 801,000 802,000 1,548,000 761,000
equipment and right-of-use assets
Amortization of intangible assets 73,000 90,000 98,000 91,000 120,000 110,000
Change in fair value of embedded
732,000 164,000 501,000 - - -
derivative
EBITDACO (7,871,000) (5,591,000) (3,200,000) (902,000) (292,000) 2,351,000
Stock-based compensation costs 451,000 864,000 618,000 489,000 438,000 168,000
EBITDAO (7,420,000) (4,727,000) (2,582,000) (413,000) 146,000 2,183,000
*Comparative figures have not been adjusted to reflect the adoption of IFRS 16 – Leases as set out in the Company’s accounting policy.
The adoption on September 1st, 2019 of IFRS 16 - Leases contributed to increase by $715,000 for the year ended August 31, 2020.
.
36You can also read