New Genes Interacted With Recent Whole-Genome Duplicates in the Fast Stem Growth of Bamboos
←
→
Page content transcription
If your browser does not render page correctly, please read the page content below
New Genes Interacted With Recent Whole-Genome Duplicates
in the Fast Stem Growth of Bamboos
Guihua Jin,†,1 Peng-Fei Ma                     ,†,1 Xiaopei Wu,1 Lianfeng Gu,2 Manyuan Long,*,3 Chengjun Zhang,*,1 and
De-Zhu Li*,1
1
 Germplasm Bank of Wild Species, Kunming Institute of Botany, Chinese Academy of Sciences, Kunming, Yunnan, China
2
 Basic Forestry and Proteomics Research Center, College of Forestry, Fujian Agriculture and Forestry University, Fuzhou, Fujian, China
3
 Department of Ecology and Evolution, The University of Chicago, Chicago, IL, USA

                                                                                                                                                               Downloaded from https://academic.oup.com/mbe/advance-article/doi/10.1093/molbev/msab288/6377341 by guest on 30 October 2021
†
 These authors contributed equally to this work.
*Corresponding authors: E-mails: dzl@mail.kib.ac.cn; zhangchengjun@mail.kib.ac.cn; mlong@uchicago.edu.
Associate editor: Michael Purugganan

Abstract
As drivers of evolutionary innovations, new genes allow organisms to explore new niches. However, clear examples of this
process remain scarce. Bamboos, the unique grass lineage diversifying into the forest, have evolved with a key innovation
of fast growth of woody stem, reaching up to 1 m/day. Here, we identify 1,622 bamboo-specific orphan genes that
appeared in recent 46 million years, and 19 of them evolved from noncoding ancestral sequences with entire de novo
origination process reconstructed. The new genes evolved gradually in exonintron structure, protein length, expression
specificity, and evolutionary constraint. These new genes, whether or not from de novo origination, are dominantly
expressed in the rapidly developing shoots, and make transcriptomes of shoots the youngest among various bamboo
tissues, rather than reproductive tissue in other plants. Additionally, the particularity of bamboo shoots has also been
shaped by recent whole-genome duplicates (WGDs), which evolved divergent expression patterns from ancestral states.
New genes and WGDs have been evolutionarily recruited into coexpression networks to underline fast-growing trait of
bamboo shoot. Our study highlights the importance of interactions between new genes and genome duplicates in
generating morphological innovation.
Key words: fast stem growth, orphan genes, de novo genes, WGD, woody bamboos, evolutionary innovation.

Introduction                                                                            divergence of duplicated genes (Long et al. 2013). A dramatic
                                                                                        genetic novelty is the orphan genes created through various
Evolutionary innovations are throughout the Tree of Life and                            molecular evolutionary processes, especially de novo genes
contribute to organismal diversification (Pigliucci 2008;

                                                                                                                                                             Article
                                                                                        from noncoding sequences with several well-documented
Wagner and Lynch 2010). The morphological and physiolog-                                organisms (Carvunis et al. 2012; McLysaght and Guerzoni
ical innovations allow organisms to explore new niches to                               2015; Xie et al. 2019; Zhang et al. 2019; Heames et al. 2020).
generate biological diversity. Examples of major innovations                            New genes in animals and plants tend to be preferentially
have been known from flowers in angiosperms, lung in tetra-                             expressed in the male reproductive tissues (Dai et al. 2006),
pods, feathers in birds, and wings in insects (Liem 1988;                               and thus an “out of testis” hypothesis for the emergence of
Averof and Cohen 1997; Albert et al. 2002; Prum and Brush                               new genes has been proposed (Dai et al. 2006; Vinckenbosch
2002). How novel traits originate becomes a fundamental                                 et al. 2006).
question in evolutionary biology. However, the majority of                                  Recent advances in genome sequencing of multiple related
studies have focused on external environmental induce for                               species enable to explore the relationship between evolution-
innovations. We know little about the genetic basis underly-                            ary innovations and origin of new genes. The species distri-
ing the appearance of phenotypic novelties, despite a link                              bution of a gene suggests its possible age (Long et al. 2013).
between the innovations and genomic novelty in general                                  Computationally, by studying genome evolution within a
and new genes in particular that has long been hypothesized                             phylogenetic content, phylostratigraphy can detect evolu-
(Chen et al. 2013; Erwin 2021). Recent studies provided direct                          tionary origin of orphan genes through sequence similarity
evidence in support of this hypothesis by attributing pheno-                            searches in genomes across the Tree of Life (Domazet-Loso et
typic innovation to the evolution of new genes (Kaessmann                               al. 2007). This approach identifies specifically the origin of new
2010; Chen et al. 2011; Long et al. 2013; Erwin 2015; Santos et                         genes which lack traceable homologs to existing genes in
al. 2017). Evolutionary new genes, also called as lineage-                              other lineages. These orphan genes may have been created
specific genes that emerged recently in a given lineage, can                            in several alternative mechanisms from rapid sequence evo-
be derived from existing genetic elements like the process of                           lution of homologous copies to lateral transfer to de novo
ß The Author(s) 2021. Published by Oxford University Press on behalf of the Society for Molecular Biology and Evolution.
This is an Open Access article distributed under the terms of the Creative Commons Attribution License (https://creativecommons.
org/licenses/by/4.0/), which permits unrestricted reuse, distribution, and reproduction in any medium, provided the original work is
properly cited.                                                                                                                        Open Access
Mol. Biol. Evol. doi:10.1093/molbev/msab288 Advance Access publication September 28, 2021                                                               1
Jin et al. . doi:10.1093/molbev/msab288                                                                                      MBE
origination (Moyers and Zhang 2016; Domazet-Loso et al.                 sequenced, we combined phylostratigraphy with a noncoding
2017; Zhang et al. 2019; Vakirlis et al. 2020; Jin et al. 2021).        ancestral search for orphan and de novo gene candidates
It assigns every gene within a genome to a given phylogenetic           (Zhang et al. 2019), to determine the phylogenetic age of
rank designated as phylostratum (PS)–describing the age of              genes in the genomes of woody bamboos and found that
gene in a phylogenetic context, parallel to chronostrati-               new genes were highly and specifically expressed in the shoot
graphic age in geology. The genes underlying innovation are             tissue. The noncoding ancestral sequences, as core evidence
thus hypothesized to be enriched in the corresponding phy-              of de novo genes, are rarely detected in metazoans from
lostratum when innovation first emerged (Sestak et al. 2013;            mammals to invertebrates. The Oryza genomes in the grass
Sestak and Domazet-Loso 2015; Trigos et al. 2017; Shi et al.            family provided the first genomic evidence for existence of de

                                                                                                                                            Downloaded from https://academic.oup.com/mbe/advance-article/doi/10.1093/molbev/msab288/6377341 by guest on 30 October 2021
2020). To distinguish the orphan genes that are created de              novo genes (Zhang et al. 2019). We inferred that genomes of
novo from other alternative mechanisms, the closely related             bamboos, as a grass subfamily Bambusoideae, likely contain
species is searched for their noncoding ancestral sequences             de novo genes with detectable noncoding ancestral sequen-
and reconstruction of origination processes (Murphy and                 ces. Our study highlights a central role for orphan and de
McLysaght 2012; Zhang et al. 2019). In combination with                 novo genes, through interaction with whole-genome dupli-
gene expression analyses, further insights can be gained into           cates (WGDs), in the origination and evolution of morpho-
the birth process of new genes and their potential functions.           logical innovations in bamboos, pinpointing a general
Two similar transcriptome indices for gene, the transcriptome           correlation between phenotypic innovations and genomic
age index (TAI) and transcriptome divergence index (TDI),               novelty.
have been developed with higher values indicating younger
and more divergent transcriptome (Domazet-Loso and Tautz
                                                                        Results
2010; Quint et al. 2012). Moreover, new genes need to be
recruited into the genetic network to be functional and the             Phylogenetic Origination of Woody Bamboo Genes
interaction of genes can be identified by the gene coexpres-            and Their Features
sion network based on common expression profiles (Shao et               To trace the phylogenetic origins of woody bamboo genes, we
al. 2019).                                                              selected one herbaceous bamboo Olyra latifolia and three
    Here we use the bamboos (Poaceae, Bambusoideae) as a                woody bamboos with sequenced genomes (Zhao et al. 2018;
model system to study this question. Bambusoideae is the                Guo et al. 2019) for phylostratigraphic analysis, together with
only major grass lineage diversifying into the forest habit with        other 65 representative genomes across the Tree of Life (sup-
more than 1,600 species worldwide (Soreng et al. 2017). In              plementary table 1, Supplementary Material online). The three
contrast to other grasses, the majority of bamboo species               woody species, Bonia amplexicaulis, Guadua angustifolia, and
have woody, tall, and lignified stems (fig. 1A), reaching up            P. edulis, represent all of the three major lineages of woody
to approximately 20 m in the widely cultivated moso bamboo              bamboos in the Bambusoideae (Guo et al. 2019). We sepa-
(Phyllostachys edulis) and even more than 30 m in a few spe-            rately adopted the genes of Bo. amplexicaulis and P. edulis, for
cies such as Dendrocalamus sinicus (Chang and Wu 2000;                  which the quality of genome assemblies is much higher than
Song et al. 2016), being the tallest grasses in the world.              that of G. angustifolia, as query to conduct analyses. In con-
Furthermore, the growth and development of these tall stems             sidering the polyploid nature of woody bamboos, the paralo-
can be rapidly completed within 2  3 months, showing a                 gous genes within genome were gathered to generate
“slow-fast-slow” pattern (Zhou 1983). For example, the shoot            nonredundant queries (supplementary fig. 1, Supplementary
of moso bamboo can grow 1 m in height within 24 h (Ueda                 Material online). In all, we defined 12 phylostrata (PS) ranks
1960; Liese and Kohl 2015; Song et al. 2016), which is hundreds         ranging from the oldest PS1 (cellular organisms) to the youn-
of times faster than other woody trees (Li et al. 2020). This           gest PS12 (species specific) based on the ladder-like phyloge-
trait of fast growth of woody stem could be considered as a             netic tree and nearly identical results were obtained in using P.
key innovation in bamboos, likely facilitating their adaptation         edulis and Bo. amplexicaulis (fig. 1BE; supplementary fig. 2,
to the forest habit with access to light and thus vast species          Supplementary Material online). We thus focused on the
diversification. Another unique trait of bamboos is the infre-          results below using the genes of P. edulis as query.
quent flowering with intervals as long as 2060 years while a               A total of 50,936 genes from P. edulis were assigned to 12
high ability of propagation by clone (Janzen 1976).                     PSs (fig. 1B and C) and the number of genes per rank was
    Previous works have mainly focused on morphology, anat-             positively correlated with gene ages (Pearson correlation co-
omy, and physiology to study the trait of fast growth of                efficient r ¼ 0.7742, P ¼ 0.00312). There were five peaks of
woody stem in bamboos (Ueda 1960; He et al. 2002; Wang,                 appearance of genes during the evolutionary history of bam-
Ren, et al. 2012; Song et al. 2016). Only a few genes related to        boos, which were associated with the emergence of cellular
plant hormones network, cell cycle regulation and cell wall             organisms (PS1), Eukaryota (PS2), Viridiplantae (PS3),
metabolism have been investigated for the evolution of this             Embryophyta (PS4), and Angiosperms (PS6). This pattern of
unique trait (Cui et al. 2012; Peng, Lu, et al. 2013; Li et al. 2018;   distribution for gene ages was also observed in the previous
Wei et al. 2018). Recent genomic studies revealed the poly-             studies of Arabidopsis and rice (Oryza sativa) (Cui et al. 2015).
ploidization history of woody bamboos (Guo et al. 2019),                An overwhelming proportion of 96.82% genes could be
which was suggested to be related to the origin and evolution           traced back to the old gene ranks from PS1 to PS9 before
of this trait. By taking advantage of bamboo genomes recently           the origin of bamboos. As such, there were only 1,622 genes
2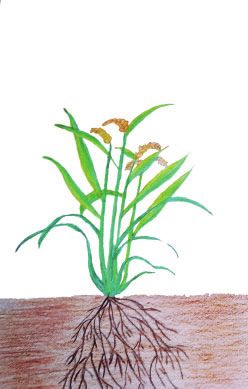
New Genes in Bamboo Rapid Growth . doi:10.1093/molbev/msab288 MBE
A Woody bamboo
Leaf
Downloaded from https://academic.oup.com/mbe/advance-article/doi/10.1093/molbev/msab288/6377341 by guest on 30 October 2021
Grass
Internode
Shoot tip
Shoot
Lateral bud
Root
Rhizome
B C D E
Clusters MYA
PS1 Cellular organism 5857 13485
3936
PS2 Eukaryota 8117 16632
2101
PS3 Viridiplantae 2982 5180
1160
PS4 Embryophyta 5194 8568
532
PS5 Tracheophyta 603 924
Old
370
PS6 Angiosperms 2267 3152
181
PS7 Monocots 256 299
133
PS8 Poaceae 764 892
76
PS9 BOP 172 182
46
PS10 Bamboo362 388
42
Woody 234
New
237
bamboo PS11
33
985 997
PS12 0
Pro Eu Gr Ph Se Am oth P Or Oly Gu Bo P. 0 5 10 15 0 25 50 75 0 25 50 75 100
e
ka kar en ysc agi l b e a
ore r m nic y zo ra l adunia edu
ryo yo o n o id a l Number of genes Novel cluster/MY % of genes
tes tes alga mitr ella lla & onoc idea eae tifoli a anamp is
e ell a
a p moel Eudi ots e &C & Po gu lex
s tifoicau
Singletons
ate l e n c hlo o
ns do ot rid ide a lia lis = 2 copies
rffi oid e
i ea
e >= 3 copies
FIG. 1. Morphological character and phylostratigraphic age of Phyllostachys edulis. (A) Comparison of the growth pattern of grass and woody
bamboo. (B) Phylostratigraphic ages distribution of P. edulis. Numbers denote the number of nonredundant gene clusters per phylostratum
(PS1PS12). The tree stratifies species by major evolutionary innovations, from the emergence of simple unicellular organisms up to P. edulis. The
dating of phylogenetic tree is from TimeTree (Kumar et al. 2017). (C) Number of genes per phylostratum. (D) Gene fixation rate per PS. (E) Gene
copies distribution of each cluster.
emerging in the bamboo lineage, including 388 of PS10, 237 of bamboo lineage has a rate of origination of approximately
PS11, and 997 of PS12 (supplementary table 2, Supplementary 35 orphan genes/My. We also calculated the fixation rate of
Material online), which could be considered as bamboo- gene families for different PSs and found that the internode
lineage specific. We called them evolutionary new genes, or leading to bamboos corresponding to PS10 had the highest
orphan genes, thereafter. Splitting from the subfamily rate of 90.5 clusters/My (fig. 1D; supplementary table 3,
Pooideae approximately 46 million years (Mys) ago, the Supplementary Material online). Interestingly, the
3
Jin et al. . doi:10.1093/molbev/msab288                                                                                 MBE
opportunity for genes to being singleton decreased with their      sinicus with available transcriptome data (Chen et al. 2018). In
ages, and 41.15% of the PS1 genes had multiple copies              agreement with the observations in P. edulis, the TAI value
whereas 98.78% of the PS12 genes were all single copy (fig. 1E).   reached a peak at the fast growth stage of the D. sinicus shoot
                                                                   and new genes were also highly expressed in this stage (sup-
New Genes Preferentially Expressed in the Fast-                    plementary fig. 5, Supplementary Material online). Together,
Growing Phase of Shoot                                             these results suggested that the findings above could hold
To identify the expression pattern of each phylostratum, we        true for the whole lineages of woody bamboos. In sum, the
used transcriptome data from seven tissues of P. edulis, in-       expression data above reveal that the new genes especially
cluding root, leaf, rhizome tip, later bud, shoot tip, inflores-   those from PS11 have played an important role in the rapid

                                                                                                                                       Downloaded from https://academic.oup.com/mbe/advance-article/doi/10.1093/molbev/msab288/6377341 by guest on 30 October 2021
cence, and shoot (supplementary fig. 3 and table 4,                growth of shoot for woody bamboos.
Supplementary Material online). Among them, the shoot tis-
sue contained eight different development stages according         Nineteen PS11 Genes Identified as De Novo Genes and
to the height of shoot (fig. 2A). Expression was observed for      Their Step-Wise Evolution of New Genes
81.10% of the total genes (41,307 genes) having a value of         To gain insight into the origination process of new genes of
fragments per kilobase million (FPKM) 1 at least in one of        PS11, we performed a pipeline as in Zhang et al. (2019) to
the seven tissues (supplementary tables 5 and 6,                   detect those of being de novo origin, which could represent
Supplementary Material online). Surprisingly, the new genes        veritable leaps of evolutionary innovation (Blevins et al. 2021).
tended to be more expressed than the old ones with 71.91%          Among the 237 PS11 genes, we identified 19 de novo genes
of PS10, 86.92% of PS11, and 83.65% of PS12 genes expressed        with high confidence (supplementary table 9, Supplementary
whereas a range of 66.0383.42% of PS1PS9 genes                   Material online). All of these de novo genes had complete
expressed.                                                         coding frames in the woody bamboos P. edulis and Bo.
   Phylotranscriptomic analyses combing gene age and ex-           amplexicaulis, whereas their orthologous sequences were
pression information revealed generally higher TAI values for      noncoding in at least one of the four outgroup species (Ol.
the shoot than the other tissues (fig. 2A). This value rose to     latifolia, Raddia distichophylla, Brachypodium distachyon, and
the highest point in the shoots of 0.52.0 m in height, cor-       rice). Three examples of identified genes were shown for the
responding to the turning point from the slow to fast growth       de novo origination processes in figure 3AC.
of the P. edulis shoot (Song et al. 2016). A similar trend was         For the de novo gene PH02Gene41079, it became a gene
also observed with TDI (fig. 2B). These results suggested          through one nucleotide substitution at 19 bp from “TAG” to
higher expression level of new genes and thus divergent tran-      “GAG” to remove premature stop codon (supplementary fig.
scriptomes in the shoot, particularly at the height of 0.52.0     6, Supplementary Material online). For PH02Gene36478, it
m. Similarly, at the individual level of phylostratum, highly      originated by an 10 bp deletion to resolve frameshift and
elevated expression level of new genes of PS11, originating at     the premature stop codon (fig. 3B; supplementary fig. 7,
the common ancestor of woody bamboos, was found in the             Supplementary Material online); For PH02Gene38072, it trans-
shoots and also peaking at the 2.0 m stage (fig. 2C). All the      formed through multiple steps including four substitution
genes from the remaining phylostrata with the exception of         and one indel mutation (fig. 3C; supplementary fig. 8,
PS5PS7 and PS9, whose genes had a much lower degree of            Supplementary Material online). Totally, there were seven
altered expression than that of PS11, showed no significant        de novo genes formed by substitution like that and the
changes of expression across the tissues. To avoid the impact      remaining 12 genes by indel mutation in a similar way (sup-
of potential spurious new genes with low expression levels, we     plementary table 9, Supplementary Material online).
further analyzed gene ages and expression levels for the top       Furthermore, all the de novo genes had transcriptional evi-
1,000 highly expressed genes per tissue. An index of expres-       dence supported by full-length transcriptome data in P. edulis
sion preference (EP ¼ expression frequency/gene frequency)         and/or Bo. amplexicaulis. Among them, 11 genes also had
was calculated for each phylostratum (supplementary tables         transcriptional evidence in Ol. latifolia, suggesting that the
7 and 8, Supplementary Material online) with greater value         noncoding RNA transcription had emerged earlier than the
pointing to preferred expression of genes in a given tissue.       open reading frames (ORFs) in evolution, similar to Oryza
Results showed that the genes of PS11 had the highest EP           (Zhang et al. 2019).
value in the shoot tissue (fig. 2D), further proving new genes         We further examined the 19 de novo genes for their po-
highly and specifically expressed in the shoot. In addition, for   tential functionality and particularly from the translational
the average gene expression level, the genes of PS1 had the        evidence. Firstly, we calculated the substitutions at synony-
highest expression level and significantly higher than other       mous sites (Ks), nonsynonymous sites (Ka) and Ka/Ks value of
PSs in all the tissues excluding shoot (P < 0.05 in the            orthologs between P. edulis and Bo. amplexicaulis. Among
Wilcoxon rank sum test, fig. 2E; supplementary fig. 4,             them, we detected nine genes with Ka/Ks value significantly
Supplementary Material online). In contrast, the genes of          less than one and two genes significantly larger than 1
PS11 showed the highest expression level in the shoot, indi-       (P < 0.05, v2 test) (supplementary table 10, Supplementary
cating a special role of the PS11 genes within the new genes in    Material online), indicating purifying and positive selection,
the rapid growth of P. edulis shoot.                               respectively. These results suggest they are undergoing evo-
   To check whether these findings were applicable to other        lutionary constraints and thus support the coding potential
woody bamboos, we conducted a similar analysis for the D.          of these de novo genes. We subsequently analyzed the
4
New Genes in Bamboo Rapid Growth . doi:10.1093/molbev/msab288 MBE
A C
3.30 p = 0.0149 160
Mean Expression Level
3.20 140 PS11
3.10
3.00 120
2.90 100
TAI
2.80 80
2.70
60
2.60
2.50 40
2.40 20
2.30
Downloaded from https://academic.oup.com/mbe/advance-article/doi/10.1093/molbev/msab288/6377341 by guest on 30 October 2021
0
Sh nce
2m
5m
0m
0m
0m
0m
0m
0m
izo ud
ot
ip
re tip
af
ot
Sh nce
In zom d
re e tip
ip
2m
5m
0m
0m
0m
0m
0m
0m
af
tt
Ro
u
Le
Rh ral b
tt
Ro
Le
0.
0.
1.
2.
3.
5.
6.
7.
flo me
e
oo
R h ral
0.
0.
1.
2.
3.
5.
6.
7.
e
oo
sc
sc
te
te
Shoots
La
Shoots
La
i
flo
In
B D
EP of 1000 Highly Expressed Genes
0.37 13
p = 0.0177
0.36
0.35 11 PS11
0.34
0.33 9
0.32
TDI
7
0.31
0.30 5
0.29
0.28 3
0.27
0.26 1
ip
sc p
Sh nce
2m
5m
0m
0m
0m
0m
0m
0m
Sh nce
ip
2m
5m
0m
0m
0m
0m
0m
0m
In om d
ot
izo ud
ot
ra af
re tip
ra a f
re e ti
u
tt
tt
Ro
Ro
Le
Le
Rh l b
lb
0.
0.
1.
2.
3.
5.
6.
7.
0.
0.
1.
2.
3.
5.
6.
7.
oo
flo me
e
e
oo
sc
te
te
z
Shoots Shoots
i
La
flo
La
Rh
In
E Root Shoot 1.0m
* PS 1 2 3 4 5 6 7 8 9 10 11 12
* *
15 ** * ** *
* ** * *
* * **
* *
10 * *
Log2(FPKM)
5
0
-5
-10
1 2 3 4 5 6 7 8 9 10 11 12 1 2 3 4 5 6 7 8 9 10 11 12
Phylostratum
FIG. 2. Evolutionary transcriptome profiles of Phyllostachys edulis. (A) TAI profiles. A high TAI value indicates that the sample expresses a high
number of younger genes. (B) TDI profile. The gray shade represents the standard deviation by permutation analysis. The P value was derived by
application of flat line test. (C) Mean expression level of genes from each phylostratum (PS). (D) EP of the top 1,000 highly expressed genes. (E) The
expression level of each PS in root and in shoot 1.0 m. The Wilcoxon rank sum test was used for comparison of expression difference between PS1
and other PSs (*P < 0.05) in root, and between PS11 and other PSs in shoot 1.0 m.
expression patterns of all de novo genes in the seven P. edulis an example with six peptides, supported by liquid
tissues and found that all of them were tissue-specific chromatography-tandem MS (LCMS/MS) in the shoots
expressed (fig. 3D) like the expression pattern of de novo (supplementary fig. 9, Supplementary Material online).
genes in rice (Zhang et al. 2019). The tissue with the largest These results lend further support for that the new genes
number of specifically expressed genes (SEGs) was the shoot particularly de novo genes could be related to the fast growth
with 13 genes and the second one was the inflorescence with of woody bamboo shoots.
four genes. Moreover, the shoot-specific genes In general, we found that these de novo genes and or-
PH02Gene15427, PH02Gene17673, PH02Gene28800, and phan genes experienced gradual evolutionary processes
PH02Gene36478 were highly expressed with FPKM > 1,000 with their ages in terms of their exonintron structure,
at the stage of 1.07.0 m and had the mass spectrometry protein length, and expression tissue specificity. The fea-
(MS) proteomics peptides (supplementary tables 11 and 12, tures of gene length, exon number, evolutionary con-
Supplementary Material online). PH02Gene36478 (fig. 3B) is straint, and tissue-specific expression all showed clear
5
Jin et al. . doi:10.1093/molbev/msab288                                                                                               MBE

                                                                                                                                                      Downloaded from https://academic.oup.com/mbe/advance-article/doi/10.1093/molbev/msab288/6377341 by guest on 30 October 2021

FIG. 3. De novo gene birth of PS11 genes and their expression. (A) Origination process for the de novo gene PH02Gene41079. De novo creation of
ORF can be one “T ! G” substitute at 19 bp to remove the premature stop codon in the ancestor of woody bamboos. Its expression is detected in
two woody bamboo species. The sequence alignments of PH02Gene41079 were exhibited in supplementary figure 6, Supplementary Material
online. (B) Origination process for the de novo gene PH02Gene36478. One 8-bp deletion resolved frameshift and the following premature stop
codon. The noncoding ancestral sequence in Ol. latifolia acquired expression. The sequence alignments of PH02Gene38478 were exhibited in
supplementary figure 7, Supplementary Material online. The gap in the species represents the absence of homologous sequence from that species.
(C) Origination process for the de novo gene PH02Gene38072 via two-step process, as follows. 1) Two 1-bp frameshifts resolved the frameshift in Or.
sativa and premature stop codon. 2) One “T to A” substitution created start codon, and “T to C” substitution resolved the premature stop codon,
and one “T” insert resolved frameshift in R. distichophylla and Ol. latifolia. The sequence alignments of PH02Gene38072 were exhibited in
supplementary figure 8, Supplementary Material online. (D) Expression heatmap for 19 de novo genes. Black box highlighted shoot-biased
expression pattern. The expressions of the three exampled de novo genes were shown in bold.

6
New Genes in Bamboo Rapid Growth . doi:10.1093/molbev/msab288 MBE
A B
p-value < 2.2e-16 p-value < 2.2e-16
3 15
CDS length(× 1000 bp)
Exon number
2 10
1 5
Downloaded from https://academic.oup.com/mbe/advance-article/doi/10.1093/molbev/msab288/6377341 by guest on 30 October 2021
0 0
PS1 PS2 PS3 PS4 PS5 PS6 PS7 PS8 PS9 PS10 PS11 PS12 PS1 PS2 PS3 PS4 PS5 PS6 PS7 PS8 PS9 PS10 PS11 PS12
C D
3 p-value = 2.629e-09 1.00
Tissue specificity score (tau)
0.75
2
Ka/Ks
0.50
1
0.25
0 0.00 p-value < 2.2e-16
PS1 PS2 PS3 PS4 PS5 PS6 PS7 PS8 PS9 PS10 PS11 PS12 PS1 PS2 PS3 PS4 PS5 PS6 PS7 PS8 PS9 PS10 PS11 PS12
FIG. 4. Patterns of new genes in evolution, expression and gene structures. (A) Younger genes are shorter than older genes. (B) Younger genes have
fewer exons than older genes. (C) Evolutionary rates of young genes are higher than old genes. (D) Younger genes are more tissue specific
expression. A KruskalWallis rank sum test was used to determine significance.
age-dependent trends (P < 0.01 in the KruskalWallis of SEGs identified for shoots might be caused by the more
rank sum test) (fig. 4; supplementary table 13, samplings of this tissue with eight developmental stages than
Supplementary Material online). In contrast to old genes, those of the other six tissues with each just having one stage.
new genes tended to possess shorter CDS sequences (a To assess this possibility, we performed eight simulations for
median value of 303 bp for PS12 vs. 1,179 bp for PS1) (fig. identifying SEGs with each one only selecting one develop-
4A) and less exons (three exons of PS12 vs. five ones of PS1) mental stage of shoots (supplementary table 15,
(fig. 4B) and evolved with less evolutionary constraint (Ka/ Supplementary Material online). Similar results were obtained
Ks) (0.92 vs. 0.26) (fig. 4C). The new genes also showed when selecting the samples of shoots at 0.5 m (65.61% of the
higher expression specificity (0.83 vs. 0.47) (fig. 4D). total 6,305 SEGs identified in shoot) and at 1.0 m (64.43% of
These observations reveal well the stepwise evolution of 6,121 SEGs) height whereas there were still higher proportion
novel gene structures: New genes gradually recruited more of SEGs (20.3536.23%) identified in shoots for the remaining
exons, expanded their exon lengths, enhanced evolution- stages despite not significantly for all of them. Therefore, we
ary constraint, and acquired the ability of more broad can conclude that the shoots indeed have more tissue-
expression. specific expressed genes, not only for the 19 de novo genes
but also for all the genes in the genome, especially at the
Divergent Expression of WGD Duplicated Genes in stages of 0.5 and 1.0 m. The shoot SEGs were enriched in
Shoot functions involving the plant-type cell wall organization, bio-
As the observation of shoot-specific expression of de novo genesis and mitochondrial mRNA processing (supplementary
genes, we further examined the SEGs at the whole genome fig. 10, Supplementary Material online).
level across the P. edulis tissues, which may provide clues We also identified SEGs for rice in four tissues (supplemen-
about tissue-specific and gene-specific biological functions tary table 16, Supplementary Material online) for comparison
(Favery et al. 2001; Wagner and Lynch 2010; Borg et al. and found that the tissue having the most SEGs was the
2011). Totally, we identified 7,013 SEGs, including 574 in roots, inflorescence (54.45% of a total 3,242 SEGs) (supplementary
43 in later buds, 356 in leaves, 22 in rhizome tip, 194 in inflo- table 17, Supplementary Material online). This was common
rescence, 42 in shoot tips, and 5,782 in shoots (table 1; sup- for reproductive organs to have more tissue-specific genes as
plementary table 14, Supplementary Material online). A found in many species of animals and plants (Wu et al. 2014;
majority of 82.45% of detected SEGs was found in shoots Gossmann et al. 2016; Zhang et al. 2018; Fang et al. 2020), in
and concentrated in the stage of 0.5–1.0 m height with sharply contrast to the situation found in the woody bam-
4,227 out of 5,782 shoot-SEGs (fig. 5A). The large number boos. Moreover, the identified 5,782 shoot-SEGs above
7Jin et al. . doi:10.1093/molbev/msab288 MBE
Table 1. The Number of SEGs in Seven Phyllostachys edulis Tissues.
PS Root Lateral bud Leaf Inflore-scence Shoot tip Rhizome tip Shoot Total
PS1 163 10 143 65 10 3 1,389 1,783
PS2 135 11 88 48 15 3 1,793 2,093
PS3 81 9 71 23 3 4 609 800
PS4 120 10 47 45 8 7 1,049 1,286
PS5 16 2 0 0 1 1 138 158
PS6 36 1 0 0 1 4 389 431
PS7 6 0 0 0 0 0 43 49
Downloaded from https://academic.oup.com/mbe/advance-article/doi/10.1093/molbev/msab288/6377341 by guest on 30 October 2021
PS8 7 0 0 0 1 0 123 131
PS9 2 0 1 0 0 0 24 27
PS10 2 0 1 2 0 0 35 40
PS11 2 0 1 3 2 0 36 44
PS12 4 0 4 8 1 0 154 171
Total 574 43 356 194 42 22 5,782 7,013
included 5,557 old genes out of a total 49,314 (PS1PS9) and Evolution of New Genes by Coexpression with Old
225 new genes out of a total 1,622 (PS10PS12). The possi- Genes
bility of being specifically expressed in the shoots was slightly To acquire their new functional roles, new genes need to be
higher for new genes than for old genes (14.06% vs. 11.34%, v2 integrated into the gene interaction network, which can be
¼ 10.318, P ¼ 0.0013). inferred from gene expression data (Zhang et al. 2015). Using
In considering the WGD history of woody bamboos (Peng, the weighted gene coexpression network analysis for the
Lu, et al. 2013; Guo et al. 2019), we implemented the samples of shoots at eight different developmental stages
Dup_GenFinder pipeline (Qiao et al. 2019) to infer the origin and the other six tissues (Langfelder and Horvath 2008), we
of shoot-SEGs. We found that 3,083 genes (53.32% out of 5,782 estimated correlations between genes across transcriptome
shoot SEGs) were derived from the WGD events with paralogs samples and clusters genes with similar profiles into modules.
in the genome, and 28.09% of them had all copies whereas the We clustered 12,728 genes into 13 modules (black, blue,
remaining had only one copy specifically expressed. The WGD green, tan, pink, red, purple, yellow, turquoise, greenyellow,
genes were significantly enriched in the shoot-SEGs brown, magenta, and gray modules) ranging in size from 39 to
(P < 2.2e16 of Fisher’s exact test). Among them, 2,606 genes 4,041 genes (fig. 6A; supplementary table 19 and fig. 12,
could be attributed to the recent independent WGD event of Supplementary Material online). Among these modules, six
woody bamboos at 22 Ma (Peng, Lu, et al. 2013; Guo et al. of which (black, blue, green, tan, purple, and yellow modules)
2019) and the remaining 477 ones to the old q WGD event were found to be related to the shoots (supplementary figs 13
shared by the grass family (fig. 5B) (Ma et al. 2021). We further and 14, Supplementary Material online). These shoot-specific
investigated the evolution of gene expression for these WGD- networks included from 169 to 2,244 genes and were gener-
duplicated genes by assuming that the expression patterns in ally enriched for genes belonging to different synthetic and
the rice without recent WGD represented the ancestral state. catabolic pathways, including RNA biosynthetic and meta-
Based on the collinearity between the genomes of P. edulis and bolic process and response to stimulus at 0.2 m, chromatin
rice, 3,095 orthologous genes were identified in the rice, which organization at 0.5 m, transport and translational elongation
corresponded to shoot-biased WGDs. There were only 457 at 1.0 m, cell wall organization at 2.0 and 3.0 m, and biogenesis
tissue-specific genes whereas 2,638 genes were broadly from 5.0 to 7.0 m (supplementary fig. 15, Supplementary
expressed across the different tissues (fig. 5C). Moreover, 322 Material online).
of these 457 tissue-specific genes came from the inflorescence All the 13 modules except gray module harbored both old
tissues as expected. On the other hand, nearly all of the 3,087 genes and new genes (fig. 6A), whereas the five modules
paralogous genes to the shoot-SEGs within P. edulis were also (black, blue, green, purple, and yellow) with enrichment of
broadly expressed with only 49 of them being tissue-specific. WGD-duplicated genes with divergent expression patterns
For the 3,083 shoot-biased expression WGD duplicates, we were all shoot-specific (P value of the Fisher’s Exact Test <
only detected 10 shoot-SEGs with Ka/Ks value more than 1 0.01). Even the black module at the stages of 2.0 and 3.0 m in
((Ka/Ks 1) ¼ 10/3,083 ¼ 0.0032), suggesting that obtaining height was meanwhile enriched for de novo genes (P < 0.01
a duplicate pseudogene is an event with a significantly small in Fisher’s Exact Test). These results suggested that new genes
probability (supplementary fig. 11 and table 18, were coexpressed with a large number of old genes in the
Supplementary Material online). This suggests that most shoot, presumably recruited into the networks through
gene pairs were underlying purifying selection, therefore their WGD-duplicated genes showing shift of expression toward
translated products are not functionless. Together, these shoots. Taking the module enriched for de novo genes as an
results suggested that the divergence of gene expressions for example for more details, we found that PH02Gene28800 was
the WGD duplicated genes in woody bamboos were accom- one of the three de novo genes in the black module originat-
panied by one of duplicated copies being specifically expressed ing in the common ancestor of woody bamboos. According
in the shoot. to the weighted values connected to this gene, we selected 50
8New Genes in Bamboo Rapid Growth . doi:10.1093/molbev/msab288 MBE
A C 3095 genes
ROLB RT LE IN ST SH Old WGD LE IN SE SH
BOP clade
O. s
ativ
a log(FPKM)
log(FPKM)
10
5557 out of
5 New WGD 0
49314 old genes
0 Woody Bamboos -10
-5
P. edulis
-10
Downloaded from https://academic.oup.com/mbe/advance-article/doi/10.1093/molbev/msab288/6377341 by guest on 30 October 2021
Neo
fun
ctio
225 out of nliz
atio
n (2
e
Pi r
d
An re-
P t-
er d
5d
e
il
d o yo d
ag
1622 new genes
25
s
sp 25
st
th
606
En br 10
Po
st
m
+4
af
2m
5m
0m
3. m
5. m
0m
0m
0m
77
le
0
0 gen
Em
0.
0.
1.
2.
6.
7.
4
es)
3087 genes
B 3083 genes
ROLB RT LE IN ST SH ROLB RT LE IN ST SH
3 New WGD
log(FPKM)
2 5
Density
0
-5
1 Old WGD -10
0
0.0 0.1 0.2 0.3 0.4 0.5 0.6 0.7 0.8 0.9 1.0
1. m
0m
3. m
5. m
0m
0m
0m
1. m
0m
3. m
5. m
0m
0m
0m
2m
2m
Ks of WGD gene pairs
5
0
0
5
0
0
0.
2.
6.
7.
0.
2.
6.
7.
0.
0.
FIG. 5. Shoot SEGs and their evolutionary model. (A) SEGs of shoots in P. edulis. RO, root; LB, leaf; RT, rhizome tip; LB, lateral bud; IN, inflorescence;
ST, shoot tip; SH, shoot. (B) Ks distribution of shoot biased related WGD-pairs in P. edulis. (C) Evolution of expression pattern of SBW. SBW, shoot
biased WGDs.
genes to display the network (fig. 6B). Among these genes, ten process and hemicellulose metabolic process, both of which
genes were WGD-duplicated genes specifically expressed in were cell wall related (fig. 6D). The cell wall metabolism was
the shoot and the remaining 40 ones were evolutionarily involved in the fast growth of woody bamboo shoots (Cui et
conserved old genes. The functional enrichments of these al. 2012; He et al. 2013; Peng, Zhang, et al. 2013; Wang et al.
genes were cell wall organization or biogenesis (ten genes), 2019), further suggesting the important roles of the evolution
response to hormone (eight genes), glycosyl compound met- of coexpression for new genes and old genes in the emer-
abolic process (four genes), and regulation of growth (two gence of this unique trait of woody bamboos.
genes) (supplementary table 20, Supplementary Material on-
line). These pathways were all previously reported to be in- Discussion
volved in the fast growth of woody bamboo shoots (Paque et Evolutionary new genes have been seen as one of major
al. 2014; Li et al. 2018), underlying how the new genes to drivers in phenotypic evolution (Khalturin et al. 2009;
function in the fast growth of bamboo shoot by interacting Kaessmann 2010; Tautz and Domazet-Loso 2011; Chen et
with the existed genes. al. 2013). The fast growth of woody shoot and consequent
To further check whether the eight different developmen- tall stems in bamboos, a key innovation and distinguishing
tal stages of shoots have similar trends of coexpression for trait within the grass family (Song et al. 2011; Lima et al. 2012;
new and old genes, we clustered expression profiles of shoots Buckingham et al. 2014), provides an opportunity to explore
by Short Time Series Expression Miner, which was designed to the role of new genes in the morphological diversification of
analyze time series with three to eight points (Ernst and Bar- the grass species. A novel cell type called long parenchyma
Joseph 2006). In total, 13,001 genes were clustered in to 19 cells was even evolved in the woody bamboo shoot (He et al.
expression patterns (P < 0.05), and 12 of which were com- 2002; Gritsch and Murphy 2005; Wei et al. 2018). With def-
prised of both old and new ones (supplementary fig. 16, inite phenotypic innovations and recent WGD events (Guo et
Supplementary Material online), showing a general similar al. 2019), which provide major sources of new genes
coexpression pattern of new genes and old genes among (McLysaght et al. 2002; Long et al. 2003; Kellis et al. 2004;
different stages of shoots. Among them, Profile 61 harbored Edger et al. 2015; Clark and Donoghue 2018), the bamboos
7 new genes and 1,106 old genes (784 from PS1PS3 and 322 can be an ideal system to study the connection between
from PS4PS9) with overexpression at the 2.0 and 3.0 m genomic novelty and evolutionary innovation. Nevertheless,
stages (fig. 6C). Within the seven new genes of Profile 61, to date, a comprehensive investigation of the genomic basis
there were three de novo genes (PH02Gene15427, underlying the evolution of fast growth of woody shoot in
PH02Gene17673, and PH02Gene28800). GO function enrich- bamboos is still lacking, with existing studies mostly focusing
ments of Profile 61 were mainly involving the xylan metabolic on a few genes and their associated gene families (Peng, Lu, et
9Jin et al. . doi:10.1093/molbev/msab288 MBE
A B glyc
o
1 0.5 0 -0.5 met syl co
-1 abo m
Modules Old New De novo SBW PH02Gene40632 lic p pound
e EMP1 roce
on PH02Gene44012
black * * 480 12 3# 146 # orm
ss
t oh
blue * * * 2220 24 2 212 # e
ns PH02Gene31299 VAP27-1
po
green * 821 16 0 121 # res AMP1 PH02Gene24548 regulation of growth
BT1
tan * 167 2 0 11
PH02Gene31078 CDA1 ADK2
MYB61 HOG1 PH02Gene47866
PIN1 EFE bHLH
pink 473 2 0 6 ASPG1
PIP3 PH02Gene44483.t1
red 816 13 0 11 PORA
purple * 199 3 0 20 # PH02Gene282921 UXS3 SUS1 PH02Gene47897
CESA8 PH02Gene28800
yellow * 1125 5 0 88 #
CESA8 CESA6 carbohydrate
GXM3 BAG1
1 108 metabolic process
Downloaded from https://academic.oup.com/mbe/advance-article/doi/10.1093/molbev/msab288/6377341 by guest on 30 October 2021
turquoise 3994 47 UGD1 MC5
XTH30 ATL2
greenyellow 188 4 1 0 PH02Gene25401 GXM3 RKL1
TUA3 PGDH LBD11
IRX6 UGD1 BAG1
brown 1617 15 0 17
ce HCT PH02Gene00173.t1 nitrogen compound
magenta 441 5 0 8 or ll w
bi all metabolic process
og or ENODL17 FLA6
grey 39 0 0 0 en ga
es niz
Shoots is at PH02Gene16888.t1 PH02Gene07522
hi l t
d
re Letip
oo ce
0. tip
Sh en f
io
R tera o o
sc a
zo bu
n PH02Gene11671
0. m
1. m
2. m
0m
0m
6. m
7. m
0m
e
t
R
m
2
5
0
0
0
3.
5.
cellular component
La
flo
In
organization or biogenesis
De nove gene Old gene SBW
C D Top 10 of GO terms enrichment of profile 61
Profile 61 response to reactive oxygen species
20
xylan metabolic process Gene number
regulation of microtubule binding 1
10 cellular response to reactive oxygen species 3
log2(V(i/V(0)))
hemicellulose metabolic process
hydrogen peroxide-mediated -log10(Pvalue)
programmed cell death 2.8
0 polysaccharide metabolic process
adventitious root development 2.6
784 PS1-PS3 1106
322 PS4-PS9 Old genes protein autoprocessing
-10 7 New genes (3 de novo)
cytidine deamination
0.2m 0.5m 1.0m 2.0m 3.0m 5.0m 6.0m 7.0m 0.1 0.2 0.3 0.4 0.5
Shoots Rich factor
FIG. 6. Coexpression of new genes and old genes. (A) Gene coexpression network identified by WGCNA. Thirteen coexpression modules were
detected, including black, blue, green, tan, pink, red, purple, yellow, turquoise, greenyellow, brown, magenta, and gray modules. The “*” represent
modules correlated with shoots when the correlation value is more than 0.50 and P valueNew Genes in Bamboo Rapid Growth . doi:10.1093/molbev/msab288 MBE
significantly similar ancestral noncoding sequences and of de novo origin, the first case described in bamboos, and the
reconstructed the origination processes of these de novo majority of them are related to the evolution of woody bam-
genes. As expected, these genes are all specifically expressed boo shoot. On the other hand, the WGD duplicated genes are
in individual tissues as suggested for de novo genes previously also involved in this innovation of woody bamboos with rapid
(Levine et al. 2006; Toll-Riera et al. 2009; Schlotterer 2015). divergence of expression in the shoot for one copy, pointing
Interestingly, most of them and 13 genes were found to be to potential functional novelty (Taylor and Raes 2004; Braasch
expressed in the shoots at developmental stages from 0.5 to et al. 2016; Sandve et al. 2018). In all, the combination of new
2.0 m and the following tissue was the inflorescence but with genes and WGD duplicated genes forms the molecular basis
only four de novo genes expressed. Altogether, we can con- of the innovation of fast woody shoot growth in bamboos.
Downloaded from https://academic.oup.com/mbe/advance-article/doi/10.1093/molbev/msab288/6377341 by guest on 30 October 2021
clude that the evolution of woody bamboo shoot closely This extends our understanding of novel gene and function
correlated with genomic novelties from highly expressed or- formation in bamboos and will provide an important re-
phan genes (including de novo genes) to altered expression source for future studies of gene function.
patterns for WGD duplicated genes. Moreover, these events Furthermore, we demonstrated the gene interaction be-
mainly occur in the stages of 0.52.0 m, a key transition point tween new genes and old genes by the WGCNA analysis, and
for P. edulis from slow to fast growth (Xu et al. 2011; Song et al. many of the identified coexpression modules are enriched in
2016). As such, the development of woody bamboo shoot genes involving the process of cell wall metabolism, cell cycle
shows an “inverse hourglass” model for the evolutionary age regulation, and plant hormones network. All of these pro-
of the transcriptome with old genes expressed at early and cesses are closely related to the rapid growth of woody bam-
late stages. This is in contrast to the common hourglass boo shoot (Cui et al. 2012; He et al. 2013; Peng, Zhang, et al.
model as found firstly for embryogenesis (Domazet-Loso 2013; Wang et al. 2019). These results further validate the role
and Tautz 2010; Quint et al. 2012; Levin et al. 2016), and of new genes through recruitment into the existing genetic
afterwards many postembryonic phases of plant develop- networks in the evolution of woody bamboo shoot. This is
ment, with a phylotypic stage expressing the oldest transcrip- somewhat expected as previous studies have shown that new
tome set (Drost et al. 2016; Leiboff and Hake 2019; Trible and genes should be integrated into and reshape ancestral genetic
Kronauer 2021). The transition stage from slow to fast growth interaction network to acquire their corresponding biological
may reflect the most unique features of shoot and thus the functions (Zu et al. 2019). In future, more detailed analysis
morphological and molecular patterns are coupled in the and functional studies of identified new genes and their inter-
woody bamboos. acted genes are needed to comprehensively characterize the
The observation of shoot serving as a major source of roles of genomic novelties in the woody bamboo shoots.
genomic novelties in woody bamboos is intriguing. A theory
of “out-of-testis” for the emergence of new genes was firstly
proposed in animals (Levine et al. 2006; Vinckenbosch et al.
Materials and Methods
2006; Kaessmann 2010). Biased expression of new genes in RNA Extraction and Full-Length RNA Sequencing
male reproductive tissues has also been identified afterwards The samples (leaves and shoots) of Bo. amplexicaulis and Ol.
in the model plants of Arabidopsis and rice (Cui et al. 2015), as latifolia were collected from the same plant for genome se-
well as recently in nematodes (Rodelsperger et al. 2021). quencing in Guo et al. (2019). Two total RNA samples (leaves
Several hypotheses have been put forward to explain this and shoots) were extracted using the miRcute Plant miRNA
phenomenon and may be driven by a common evolutionary Isolation Kit (DP504) (TIANGEN BIOTECH Corporation,
force of male gametophyte competition (Cui et al. 2015; Beijing, China). Total RNA samples were treated with Dnase
Wang et al. 2016). However, in the woody bamboos, the shoot I to remove DNA contaminant. RNA quantity was deter-
rather than the reproductive tissues acts as an “innovation mined using Nanodrop, gel electrophoresis, and further by
incubator” for the evolution of new genes. A potential expla- the Agilent 2100 Bioanalyzer (Agilent, Santa Clara, CA). The
nation is that, as polyploid plants, the woody bamboos often first-strand cDNA was synthesized using the Clontech
reproduce vegetatively with the complex system of rhizomes SMARTer PCR cDNA synthesis Kit (Clontech). The library
and shoots playing an important role in propagation, and use was prepared according to the Isoform Sequencing (Iso-
sexual reproduction occasionally with long flowering cycles of Seq) protocol, as described by Pacific Biosciences (PacBio).
2060 years in general (Janzen 1976). A total of two single molecular real-time (SMRT) cells were
With an enrichment of genomic novelties in the growth of sequenced on the PacBio Sequel platform (Biomarker Tech,
woody bamboo shoot revealed, these novelties represent a Beijing, China). The cDNA library (16 kb) was constructed
mix of products of new genes as well as WGD duplicated and sequenced using the PacBio Sequel System. Two SMRT
genes undergoing divergent expression. Gene duplication cells generated 46.9 Gb raw data.
through WGD is a major source for generating new genes According to the standard protocol of ISO-seq (SMRT
and function (Conant and Wolfe 2008; Innan and Analysis 5.1.0), raw Polymerase reads that have full passes
Kondrashov 2010; Zhen et al. 2012; Sandve et al. 2018), but 1 and the predicted consensus accuracy >0.9 were selected
other process such as de novo formation can also generate (minPasses ¼ 1) (https://github.com/PacificBiosciences/
new genes (Zhang et al. 2019; Blevins et al. 2021). And our pbbioconda, last accessed October 1, 2020). Then, 941,750
identified new genes here are all resulted from other processes circular consensus sequences (CCSs) were classified into
rather than WGD duplication. In particular, there are 19 genes full-length (FL) and non-FL (NFL) CCS according to whether
11Jin et al. . doi:10.1093/molbev/msab288 MBE
included 50 /30 cDNA primers and poly (A) tail at the same phylostratum; T being the duration of the interval My in
time. At last, full-length nonchimeric (FLNC) reads were sub- the phylostratum. Based on the cluster results of
jected to isoform-level clustering by iterative isoform- OrthoMCL, gene copies of each cluster were classified into
clustering for error correction algorithm and herein similar one of the following three groups by its family size in the
sequences assigned to a cluster. Each cluster was identified as clustering according to Guo (2013): 1) A singleton is a single-
a uniform isoform. NFL cDNA reads were then applied to copy gene; 2) a two-gene family has two copies; and 3) a
polish each cluster to produce high-quality isoforms (accu- multigene family has 3 copies.
racy > 99%). The difference of 50 end was not considered
when collapsing redundant transcripts. The FLNC sequences
Downloaded from https://academic.oup.com/mbe/advance-article/doi/10.1093/molbev/msab288/6377341 by guest on 30 October 2021
were mapped into the genome by Gmap (–cross-species, – Gene Expression Quantification and Proteomic
allow-close-indels 0) (Wu and Watanabe 2005). Mapped Peptides Identification
reads were further collapsed by cDNA_Cupcake package We obtained published RNA-seq data for P. edulis from NCBI
(https://github.com/Magdoll/cDNA_Cupcake/wiki, last SRA databases (Gao et al. 2014; Zhao et al. 2016; Wang et al.
accessed June 15, 2021) with >85% alignment coverage 2017, 2019) (supplementary table 4, Supplementary Material
and 90% alignment identify. The nonredundant FLNC reads online). Briefly, we trimmed reads using the Trimmomatic
were listed in supplementary table 21, Supplementary (Bolger et al. 2014) after analysis in FASTQC (https://www.bio-
Material online and the raw data are available at the NCBI informatics.babraham.ac.uk/projects/fastqc/, last accessed July
SRA archive (PRJNA764002). 14, 2021), and then computed expression level for each gene
using RSEM v1.2.16 (Li and Dewey 2011) with Bowtie2 aligner
Phylostratigraphic Analysis of P. edulis and Bo. (Langmead and Salzberg 2012). Read counts of gene expression
amplexicaulis data were removed batch effect by the removeBatchEffect
Gene age was estimated using the genomic phylostratigraphic function in Limma package (Ritchie et al. 2015).
approach as described previously (Domazet-Loso et al. 2007). We also downloaded transcriptome data of D. sinicus, an-
Considering the polyploid nature of woody bamboos (P. other tropical woody bamboo species, under the accession of
edulis: 2n ¼ 4; Bo. amplexicaulis: 2n ¼ 6) (Zhao et al. PRJNA418355 (Chen et al. 2018). Because without reference
2018; Guo et al. 2019), the paralogous genes of P. edulis and genome of D. sinicus, the clean reads were assembled into
Bo. amplexicaulis were gathered into clusters using contigs using the program Trinity v2.4.0 (Grabherr et al.
OrthoMCL software (Li et al. 2003) with the parameter of I 2011). The transcript abundance was quantified using soft-
at 1.5, respectively (supplementary fig. 1, Supplementary ware RSEM v1.2.16 software (Li and Dewey 2011) with Bowtie2
Material online). Only the longest protein of each cluster aligner (Langmead and Salzberg 2012). The protein of D. sini-
was picked up as its representative. Combined representatives cus transcripts was predicted using TransDecoder (http://
of gene clusters with singleton (without paralogs), we gener- transdecoder.sourceforge.net/, last accessed July 30, 2021).
ated nonredundant queries for P. edulis and Bo. amplexicaulis, The available MS raw data of leaf and seeding (Yu et al.
respectively. Additionally, we download 69 genomes across 2019), and shoot (Tao et al. 2020) were download. MaxQuant
the Tree of Life to represent 12 evolutionary levels or phylos- 1.6.17.0 (Tyanova et al. 2016) was used to perform a database
trata (PS), starting from the origin of cellular organisms (PS1) search against the moso bamboo protein database to identify
and ending at the origin of P. edulis (PS12) (supplementary peptides.
table 1, Supplementary Material online).
To evaluate the impact of full-length transcriptome data
Transcriptome Index Calculation
on gene age analysis, we set up two reference data sets: 1) 69
TAI and TDI of each tissue/developmental stage were calcu-
genomes (data set 1); 2) 69 genomes combined with full-
lated via myTAI package (Drost et al. 2018). The TAI is a
length isoforms of Bo. amplexicaulis and Ol. latifolia (supple-
measure that reflects the evolutionary age of a transcriptome
mentary table 22, Supplementary Material online). The addi-
at a given ontogenetic stage, where higher values correspond
tion of full-length transcriptome data mainly affected the
to younger transcriptomes (Domazet-Loso and Tautz 2010).
number of young genes. Finally, we compared redundant
TAI value of a sample is defined as the weighted mean of
query sequences of P. edulis and Bo. amplexicaulis with other
phylostratum rank psi of gene i by the expression value eis in
68 genomes and full-length transcriptome data via BLASTp
the transcriptome of sample s,
and TBlastN algorithm with an e-value 104 threshold, and
Pn
then assigned all protein-coding genes into 12 phylostrata. i¼1 eis :psi
The methods and parameters were consistent with previous TAIs ¼ P n
i¼1 eis
studies (Domazet-Loso et al. 2007). According to phylostrati-
graphic method, if a putative homolog of one gene was first where n is the total number of genes in the analysis. High TAI
identified in one phylostratum, it was assumed as the age of indicates that the transcriptome is evolutionarily young,
that gene. If no BLAST hit was detected in other phylostata, whereas low TAI value suggests the transcriptome is evolu-
the corresponding protein was assigned to the youngest PS tionarily ancient.
(PS12). Gene cluster fixed rates were calculated according to The TDI is a weighted mean of Ka/Ks ratios of gene i by the
the formula, r ¼ N/T: r representing the number of clusters expression value eis in the transcriptome of samples (Quint
per My; N representing the number of clusters in the et al. 2012),
12New Genes in Bamboo Rapid Growth . doi:10.1093/molbev/msab288 MBE
Pn Kai P. edulis and Bo. amplexicaulis with runmode ¼ 2 for ML
i¼1 Ksi :eis
TDIs ¼ Pn pairwise comparison. To further test whether the x ratio of a
i¼1 eis model significantly deviated from neutral evolution (x ¼ 1),
we incorporated the neutral model, which estimates model
High TDI indicates that the transcriptome is more diver-
parameters by fixing x ¼ 1 (Yang 1997). The statistical sig-
gent, whereas low TDI value represents a more conserved
nificances between the estimated x and x ¼ 1 models were
transcriptome.
estimated by calculating twice the log-likelihood difference
Relative expression (RE) of genes for a given phylostratum
following a v2 distribution.
(ps) and developmental stage (s) was computed using meth-
To better understand whether the genes across different
Downloaded from https://academic.oup.com/mbe/advance-article/doi/10.1093/molbev/msab288/6377341 by guest on 30 October 2021
ods described by Domazet-Loso and Tautz (2010):
phylostrata possess various generic features, we analyzed four
f f min important genic characteristics. Using custom Perl scripts, we
REðpsÞs ¼ calculated protein length, intron number, and GC content at
f max f min the CDS level. The Ka/Ks ratio for P. edulis versus Bo. amplex-
where f is the average partial concentration of RNAs from icaulis was calculated using ParaAT v.2.0 (Zhang et al. 2012)
phylostratum for a given stage and f max , f min are the maximal and KAKS_Calculator v.2.0 (Zhang et al. 2006). We calculated
and minimal average partial concentration from phylostra- the tissue specificity score (tau) of a gene (Yanai et al. 2005;
tum across all considered stages, respectively. Kryuchkova-Mostacci and Robinson-Rechavi 2017) using the
roonysgalbi/tispec package in R package (https://rdrr.io/
EP of Highly Expressed Genes github/roonysgalbi/tispec, last accessed March 30, 2021).
In each tissue, we extracted the 1,000 highest expressed gene
of each tissue as the highly expression set (supplementary Identification Shoot Biased WGDs in P. edulis
table 8, Supplementary Material online). Gene age composi- We used R package “SEGtool” to identify SEGs in each tissue
tion of the highly expressed set was counted. The expression (default parameters, P valueYou can also read