A chromosome-level phased genome enabling allele-level studies in sweet orange: a case study on citrus Huanglongbing tolerance - Oxford Academic
←
→
Page content transcription
If your browser does not render page correctly, please read the page content below
Horticulture Research, 2023, 10: uhac247
                                                                                                                              https://doi.org/10.1093/hr/uhac247

Article
A chromosome-level phased genome enabling
allele-level studies in sweet orange: a case study on
citrus Huanglongbing tolerance

                                                                                                                                                                      Downloaded from https://academic.oup.com/hr/article/10/1/uhac247/6794931 by guest on 19 May 2023
Bo Wu      1 ,† ,   Qibin Yu2 ,† , Zhanao Deng3 , Yongping Duan4 , Feng Luo1 , * and Frederick G. Gmitter Jr.2, *

1 School of Computing, Clemson University, 100 McAdams Hall, Clemson, SC 29643, USA
2 Department  of Horticultural Sciences, Citrus Research and Education Center, University of Florida, IFAS, 700 Experiment Station Road, Lake Alfred, FL 33850, USA
3 Department of Environmental Horticulture, Gulf Coast Research and Education Center, University of Florida, IFAS, 14625 County Road 672, Wimauma, FL 33598,

USA
4 USDA-ARS, U.S. Horticultural Research Laboratory, 2001 South Rock Road, Fort Pierce, FL 34945, USA

*Corresponding authors. E-mail: luofeng@clemson.edu, fgmitter@ufl.edu
† These authors contributed equally to the manuscript as first authors.

Abstract
Sweet orange originated from the introgressive hybridizations of pummelo and mandarin resulting in a highly heterozygous genome.
How alleles from the two species cooperate in shaping sweet orange phenotypes under distinct circumstances is unknown. Here, we
assembled a chromosome-level phased diploid Valencia sweet orange (DVS) genome with over 99.999% base accuracy and 99.2% gene
annotation BUSCO completeness. DVS enables allele-level studies for sweet orange and other hybrids between pummelo and mandarin.
We first configured an allele-aware transcriptomic profiling pipeline and applied it to 740 sweet orange transcriptomes. On average,
32.5% of genes have a significantly biased allelic expression in the transcriptomes. Different cultivars, transgenic lineages, tissues,
development stages, and disease status all impacted allelic expressions and resulted in diversified allelic expression patterns in sweet
orange, but particularly citrus Huanglongbing (HLB) shifted the allelic expression of hundreds of genes in leaves and calyx abscission
zones. In addition, we detected allelic structural mutations in an HLB-tolerant mutant (T19) and a more sensitive mutant (T78) through
long-read sequencing. The irradiation-induced structural mutations mostly involved double-strand breaks, while most spontaneous
structural mutations were transposon insertions. In the mutants, most genes with significant allelic expression ratio alterations (≥1.5-
fold) were directly affected by those structural mutations. In T19, alleles located at a translocated segment terminal were upregulated,
including CsDnaJ, CsHSP17.4B, and CsCEBPZ. Their upregulation is inferred to keep phloem protein homeostasis under the stress from
HLB and enable subsequent stress responses observed in T19. DVS will advance allelic level studies in citrus.

Introduction                                                                                    Due to the difficulty of assembling a highly heterozygous
Sweet orange (Citrus sinensis L.) originated from complex                                    genome, the current best sweet orange genome assembly was
hybridization processes involving mandarins (Citrus reticulata                               from a di-haploid sweet orange (HSO) [1, 5]. With a haploid
Blanco) and pummelos [Citrus maxima (Burm.) Merr.] [1, 2].                                   reference genome, both somatic mutation calling and gene
Several other citrus cultivar groups also arose from interspecific                           expression quantification could be compromised in the highly
introgressive hybridization events [3], such as lemon (Citrus limon                          divergent genomic regions in sweet orange. Later efforts to
L.) and grapefruit (Citrus paradisi Macfad.). The primitive Citrus                           sequence diploid sweet oranges only generated haploid-sized
species contributing to the hybridizations generally diverged                                assemblies with inferior qualities [2, 5]. The mapping-based
between 3 and 8 million years ago and vary substantially in                                  phasing method partitioned the diploid sweet orange genome into
genomes and phenotypes [3, 4]. Interspecific and introgression                               325 phased blocks and failed to provide a reference-level genome
hybrids in citrus are phenotypically distinct from their parents.                            [5]. Here, by adjusting the assembly procedure according to the
How the allelic genes from diverged species cooperate in shaping                             intra-genomic allelic variance level, we successfully assembled a
the phenotypes of the hybrids under different conditions remains                             chromosome-level phased Valencia sweet orange (DVS) genome
largely unknown. Phased genome assemblies are fundamental                                    with significantly improved K-mer completeness, base accuracy,
in deciphering the allelic contributions to horticultural traits                             and gene annotation completeness compared to HSO v4 [5].
of sweet orange and other hybrids. Moreover, sweet orange is                                 DVS harbors a high allelic-variance level and enables allele-level
important for studying citrus horticultural traits among its                                 studies for hybrids between pummelo and mandarin.
diverse cultivars arising from somatic mutations [5, 6], making                                 The relative genetic uniformity of sweet orange cultivars and
a high-quality reference genome highly desirable.                                            their use in monoculture production make them vulnerable

Received: 18 August 2022; Accepted: 24 October 2022; Published: 3 November 2022; Corrected and Typeset: 1 January 2023
© The Author(s) 2023. Published by Oxford University Press on behalf of Nanjing Agricultural University. This is an Open Access article distributed under the
terms of the Creative Commons Attribution License (https://creativecommons.org/licenses/by/4.0/), which permits unrestricted reuse, distribution, and
reproduction in any medium, provided the original work is properly cited.
2   |   Horticulture Research, 2023, 10: uhac247

to disease epidemics. The citrus Huanglongbing (HLB) is a             the orthologous regions, there are approximately 254.8 Mb
devastating disease presumably caused by Candidatus Liberibacter      (84.7%) P/M, 37.5 Mb (12.5%) M/M, and 8.6 Mb (2.8%) P/P regions
asiaticus (CLas) [7], which is a phloem-limited bacterium. All        in DVS.
commercial sweet orange cultivars are susceptible to HLB, and            DVS_A and DVS_B share a 96.2% overall nucleotide similarity;
the selection of HLB tolerant/resistant germplasm has been            4 353 521 single-nucleotide variants (SNVs), 152 977 small indels
considered the ultimate solution to this devastating disease.         (
Wu et al. |   3

                                                                                                                                                          Downloaded from https://academic.oup.com/hr/article/10/1/uhac247/6794931 by guest on 19 May 2023

Figure 1. Characterization of the DVS genome and its intra-genomic variations. (A) Characteristics of the phased DVS assembly and whole-genome
variation distribution. I. Ideogram of the DVS genome. The unit of the tick labels is million base pairs (Mb). (II) The phased (light red) and unphased
region (black) in the assembly. (III) Distribution of the mandarin- (M, orange bands) and pummelo- (blue bands) origin chromosome regions. (IV) The
binary logarithm of the depth of uniquely mapped CLR reads across DVS in 50 kb windows. Neighboring windows are overlapped by 20 kb. The vertical
axis range from 0 to 16. (V) Histogram of the binary logarithm of ≤50 bp indel (purple) and SNV (green) counts in 100 kb non-overlapping continuous
windows. The vertical axis range from 0 to 12. Tandem duplications (VI) and insertions (VII) in DVS_A (DVS_B) with DVS_B (DVS_A) as the reference,
which could also be described as deletions in the other chromosome set. (VII) Inversions in DVS_B with DVS_A as the reference. The inner links show
all inter-chromosomal translocations between DVS_A and DVS_B, which have been colored the same as the corresponding DVS_B chromosomes.
(B) Seven large SVs on chr1A/B and chr9A/B. Rectangles with the same colors on chr1/9A and chr1/9B denote the orthologous blocks. The rectangles
reversed in direction are shown in the bottom row on chr1B and chr9B. Red, yellow, and green circles denote INVs, inter-chromosomal translocations,
and intra-chromosomal translocations, respectively.

   We carried out transcriptome profiling for 740 transcriptomes              the allelic expression quantity as the allelic expression ratios
from 38 studies (NCBI BioProjects in Supplementary Table 10)                  (proportions of the allelic reads in the corresponding gene
to learn their allelic expression patterns (AEPs). We normalized              reads) in AEP analysis (Supplementary File 1). A conservative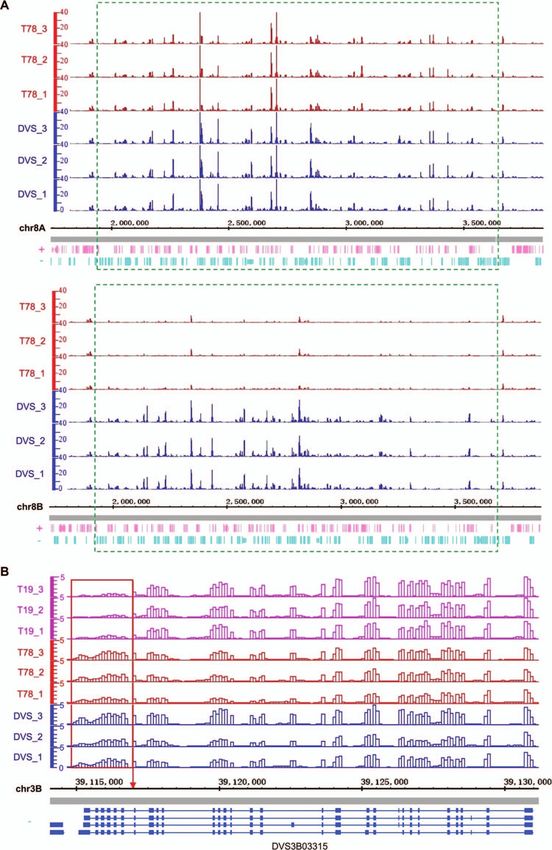
4   |   Horticulture Research, 2023, 10: uhac247

estimation shows that 32.5% ± 0.08% of genes have a signifi-            sequencing data, which was not reported in the original study
cantly biased allelic expression in sweet orange transcriptomes         [23]. Three acidless oranges [5] and two navel oranges [25] were
(Supplementary Fig. 7). We detected diversified AEPs in the             distinguished via fruit and juice sac AEPs, respectively.
transcriptomes that had significantly different allelic expression         AEP alterations were observed in most genetically engineered
ratios on tens to hundreds of genes. Multiple AEP clusters related      plants compared to the wild type. All six analyzed sweet orange
to source tissues/organs, cultivar types, different studies, and        transgenic lineages [26–28] with gene overexpression had differ-
intra-study experimental conditions were identified through             ent AEPs from the wild type (Supplementary Fig. 10). The observed
hierarchical clustering (Fig. 2A). Despite the complexity, the          AEP alterations could either be related to the manipulated genes
highest allelic expression correlations were observed among             or somatic mutations randomly induced by genetic engineering.
transcriptomes of the same tissues from the same cultivars              Two sweet orange lineages overexpressing CsGH3.1 and CsGH3.1 L
(Fig. 2A). We then investigated the impact of different factors on      [26] had distinct AEPs. The AEPs of sweet orange lineages OE-5 and
the AEPs separately using the studies with single- or two- factorial    OE-6 both overexpressing CsWRKY22 [28] were not significantly
designs.                                                                different, while the AEPs of OE-2 and OE-15 overexpressing CsLOB1
                                                                        (PRJNA670516) [27] were distinct by clustering. We observed allelic
Impact of tissues and development stages on                             expression ratio increases of 140 neighboring genes on chr7A

                                                                                                                                              Downloaded from https://academic.oup.com/hr/article/10/1/uhac247/6794931 by guest on 19 May 2023
allelic expression                                                      by 48.4 ± 13.7% only in OE-15 (Supplementary Fig. 10) resembling
Different sweet orange organs/tissues generally alter the allelic       AEP alterations induced by deletions detected in genomes of
expression ratios on hundreds of genes. In six sweet orange cul-        Zongcheng and T78 below. The AEPs of two sweet orange lineages
tivars [16], the AEPs of juice sac and fruit peel transcriptomes        (RI-D3 and RI-D4) with RNA interference of CsLOB1 [27] were not
were clustered into two large clades, with lower correlations           distinguished from the wild-type transcriptomes.
between different tissue types than among the same tissues
of different cultivars (Fig. 2C). Zaohong navel orange is a graft-      Impact of citrus Huanglongbing on sweet orange
chimera between navel orange and satsuma mandarin, with the             allelic expression patterns
L-1 histogenic layer being from satsuma, and L-2 and -3 from            HLB causes symptoms on both citrus leaves and fruit in the
navel orange [17]. As expected, AEP analysis shows that Zao-            field [7], and we found AEP alterations in different sweet orange
hong mainly expresses mandarin genes (DVS_A alleles) in the             tissues associated with HLB infection. Analysis of PRJNA394061
juice sacs (derived from L-1) but has similar AEPs with navel           [24] showed that healthy calyx abscission zones with HLB
orange in the fruit peels (of L-2 origin) (Fig. 2D). With PRJNA517400   had altered AEPs compared to the healthy tissues (Fig. 3A). In
[18], we observed distinct AEPs among epicarp, albedo, segment          HLB-affected calyx abscission zones with fruit retained and
membranes, and juice sacs of Fengjie 72–1 navel orange fruit at         dropped, we found 2612 and 3739 genes with significant allelic
six different development stages (Fig. 2D). Epicarps had the most       expression ratio alterations compared to the corresponding
distinct AEPs at all six stages, while segment membrane and juice       healthy tissues, both enriched in defense response, lipid metabolic
sac AEPs were the most similar.                                         process, and organic acid catabolic process (Supplementary
   Development is accompanied by an AEP shift in different sweet        Table 11).
orange tissues. We observed significant allelic expression ratio           We have not observed AEP alterations related to HLB in
alterations between balloon-stage and fully-open f lowers of Cara       leaves at 1 and 5 days post-inoculation (PRJNA645216) [29].
Cara navel orange [19] (Fig. 2D). The AEPs of fruit transcriptomes      In PRJNA417324 [30], the leaf AEPs of trees inoculated with
from distinct development stages were clustered separately for          CLas gradually diverged from the healthy controls from 8 WPI
Valencia sweet orange [20], Zaohong blood orange, and the 21st -        (weeks post-inoculation) to 46 WPI. The AEPs in the inoculated
century navel orange [21], respectively. We observed multi-step         trees start differing at 8 WPI when lower AEP correlations have
AEP transitions during Fengjie 72–1 navel orange (PRJNA517400)          been observed among the transcriptomes with HLB, implying a
[18] fruit development in epicarp, albedo, segment membranes,           putative unstable stage of the disease with diversified impacts on
and juice sacs (Supplementary Fig. 8). AEP transitions were also        different branches. At 26 WPI, the HLB AEPs are already clustered
observed in juice sacs of Cara Cara navel orange [22] and peels of      together in a clade. At 46 WPI, 1008 genes with significant allelic
two navel oranges [23]. Analysis of PRJNA394061 [24] shows that         expression ratio alterations (FDR < 0.10) are enriched in defense
fruit abscission induces AEP alterations in the calyx abscission        response, lipid metabolic process, sterol biosynthetic process, and
zones (Fig. 3A).                                                        carbohydrate catabolic process (Supplementary Table 12). These
                                                                        results indicate the impact of HLB on sweet orange AEP is a long-
Allelic expression patterns in distinct sweet                           term process.
orange lineages
Different sweet orange cultivars (mutants) resulted in distinct         Irradiation-induced Valencia sweet orange
AEPs in all analyzed datasets involving two or more cultivars           mutants
(mutants) in this study (Supplementary Fig. 9), though the num-         We took advantage of the allelic information of the DVS assembly
ber of genes with significant allelic expression ratio alteration       to probe the possible underlying molecular mechanisms in an
might vary. The juice sac or fruit peel AEPs from six sweet orange      HLB-tolerant sweet orange mutant. Most trees growing in the
cultivars [16] were clustered in consistence with the cultivar          same field trial location as the mutants were killed by HLB or
types (Fig. 2C). The three Valencia cultivars (Delta, Rohde Red,        removed because of severe decline caused by HLB. Only six trees
and Cutter) shared higher AEP correlations among each other             from two original selections, four from T19 and two from T78, are
than with the three cultivars from China. Late Lane navel orange        still growing in the grove. The four T19 trees included one with
and its brown f lavedo mutant Zong Cheng had distinct AEPs in           a lost tag (SF), which was proven identical to the other three T19
fruit peels at five different fruit development stages. We observed     trees by whole-genome sequencing, as described in the following
36.2 ± 9.5% allelic expression ratio decreases of 19 neighboring        section. Though similar Clas titers [31] were detected on T19, T78,
genes on chr3A in Zong Cheng and found a deletion in its genome         and DVS (Fig. 4A) indicating equivalent infections, the T19 trees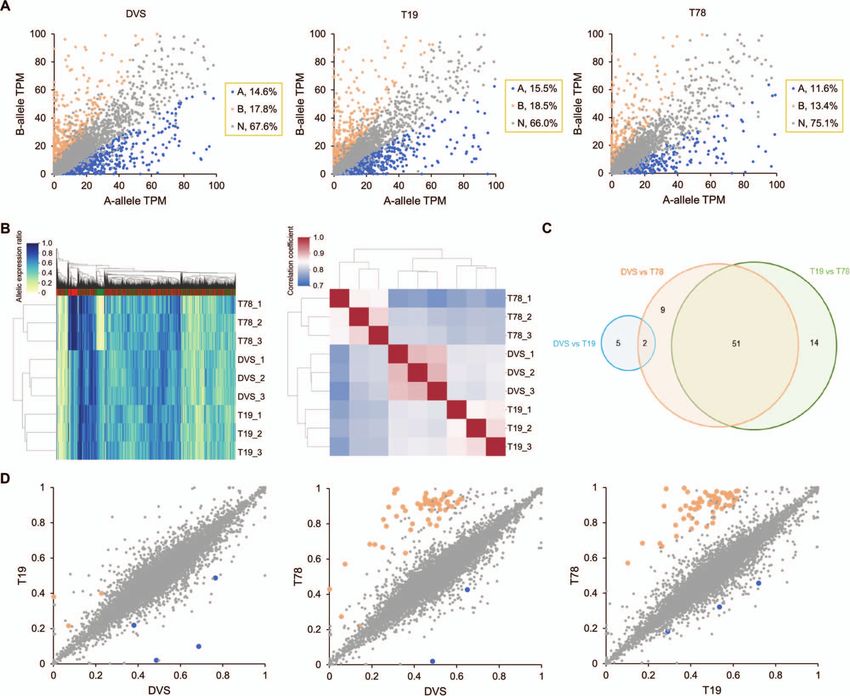
Wu et al. |    5

                                                                                                                                                           Downloaded from https://academic.oup.com/hr/article/10/1/uhac247/6794931 by guest on 19 May 2023

Figure 2. Allelic expression patterns (AEP) in sweet orange transcriptomes. (A) Hierarchical clustering based on AEP correlation coefficients (right)
among 677 sweet orange transcriptomes. Each row or column represents a transcriptome. The AEPs are the allelic expression ratio profiling results for
the transcriptomes, in which the expression ratios of each bi-allelic gene locus were quantified. Sixty-three transcriptomes were filtered from the 740
transcriptomes due to a low informative gene count. The colored bars on top of the heatmaps indicate alleles from DVS_A (red) and DVS_B (green). The
NCBI BioProject IDs, cultivar types, and tissue/organ of the RNA-seq data are shown in the left. (B) T-SNE (t-distributed stochastic neighbor embedding)
visualization of AEPs in different organs/tissues of Navel orange (left) and Valencia orange (right). tsne_1 and tsne_2 are the two features obtained
through dimension reduction by T-SNE. In panels (C) and (D), transcriptomes of three biological replicates were analyzed under each condition.
(C) Correlation heatmap and clustering of fruit peel and juice sac transcriptomes from six different sweet orange cultivars. Delta, Rohde Red, and
Cutter belong to the Valencia cultivar group, and the other three are China local cultivars. (D) AEP heat map and hierarchical clustering of
transcriptomes from three studies. Each row represents a transcriptome and each column represents a gene allele. Five hundred genes with the
highest allelic expression ratio variances among the analyzed transcriptomes were used in making the graphs. Zaohong navel orange is a graft
chimera of the LQ navel orange and Citrus unshiu Marc. In the middle panel, the transcriptomes were sampled at 220 days after f lowering from Fengjie
72–1 navel orange. In the right panel, transcriptomes of Cara Cara navel orange f lowers at two developmental stages were analyzed.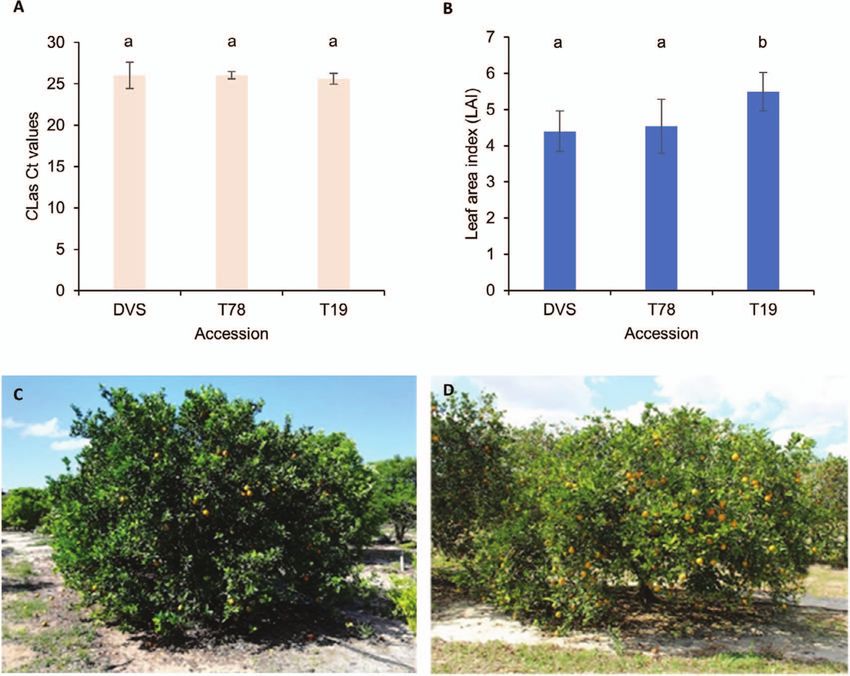
6   |   Horticulture Research, 2023, 10: uhac247

                                                                                                                                                     Downloaded from https://academic.oup.com/hr/article/10/1/uhac247/6794931 by guest on 19 May 2023
Figure 3. Citrus Huanglongbing- (HLB) induced allelic expression pattern alterations in sweet orange. Each row represents a transcriptome from the
corresponding NCBI BioProject in the heat maps. (A) Hierarchical clustering based on allelic expression patterns (AEPs, left) and AEP correlation
coefficients (right) among healthy and HLB-affected calyx abscission zones of Hamlin oranges. We used 1000 and 7500 genes with the highest allelic
expression ratio variance in making the left and right panels, respectively. “Drop” and “retain” denote the abscission status of the fruit of the
corresponding calyx abscission zones. (B) Correlation heatmap and clustering of leaf transcriptomes from healthy Washington navel orange seedlings
and those affected by HLB.

had significantly greater (p < 0.01) leaf area indexes than DVS and        Allelic expression alterations in the sweet orange
T78 (Fig. 4B). The four T19 trees are still healthy (Fig. 4C) and have     mutants
less severe symptoms than DVS (Fig. 4D) and the two T78 trees.             We carried out transcriptomic profiling for DVS, T19, and T78.
                                                                           In T19, 1726 alleles were significantly upregulated, and 1503
Somatic structural mutations in the sweet orange                           were downregulated compared to DVS and T78 (Supplementary
accessions                                                                 Table 16). In T78, 1054 upregulated and 1161 downregulated alle-
We obtained over 280× Pacbio continuous long reads for each                les were detected compared to DVS and T19 (Supplementary
of T19, SF, and T78. We have not detected any SVs between                  Table 17). For most alleles with significantly altered expression in
T19 and SF, and three somatic SVs (TRA7, TRA44, and INS16)                 T19 (67.4%) or T78 (73.8%), the expression of their alternate alleles
are shared by them (Supplementary Table 13), proving that                  was not significantly different. Significantly biased allelic expres-
SF was derived from the original T19 branch. TRA44 and                     sion (≥1.5-fold allelic difference) is observed in 32.4%, 34,0%,
TRA7 are both complex translocations involving inversion                   and 25.0% of the 10 737 tested genes in DVS, T19, and T78 tran-
and inter-chromosomal recombination (Supplementary Fig. 11).               scriptomes (Fig. 5A), including 1962 in common among them
The genic regions of four genes and the promoter region                    (Supplementary Table 18).
of another gene have been truncated by TRA7 and TRA44                         DVS, T78, and T19 transcriptomes had distinct AEPs (Fig. 5B).
(Supplementary Table 14). INS16 is a 5086 bp Mutator–like trans-           We detected significant allelic expression ratio alterations (≥1.5-
posable element (MULE) insertion in chr2A. Four lineage-specific           fold) among DVS, T19, and T78 on eighty-one genes (Fig. 5C, D and
mutations were identified in T78 (Supplementary Table 13                   Supplementary Table 19). Sixty-two of these genes were located
and Supplementary Fig. 11), including TRA22, a chromosomal                 in the 1.8 Mb deleted region of DEL58 (Supplementary Table 19).
recombination event between chr5B and chr1B; INV17, an                     The expression of the deleted alleles by DEL58 was almost
88 911 bp inversion on chr2B that truncated two genes; DEL58, a            eliminated (Fig. 6A), while their alternate alleles were mostly
1.8 Mb deletion on chr8B that has deleted 138 genes and truncated          (115/118) not significantly affected. The allelic expression
1 gene; DUP52, an 5617 bp tandem duplication on chr8A. TRA7,               ratio of DVS_A CsOPT9 interrupted by a 25 857 bp insertion
INV17, TRA22, TRA44, INS16, and DEL58 were verified through                (INS34 in Supplementary Table 19) in DVS has been reduced
PCR amplification (Supplementary Fig. 12). We also detected forty          to 0.1%, compared to the 38.1% in T19 and 43.0% in T78
SVs between DVS and both T19 and T78 that were inferred                    (Supplementary Table 19). A few alleles directly affected by
to be spontaneous mutations (Supplementary Table 15 and                    the somatic SVs had significantly different expressions in the
Supplementary Note 2).                                                     mutants, though no significant allelic expression ratio alteration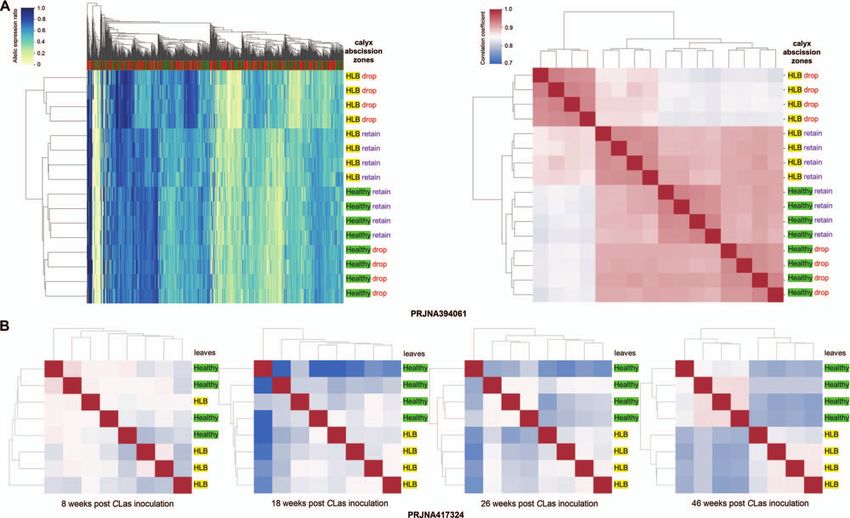
Wu et al. |   7

                                                                                                                                                            Downloaded from https://academic.oup.com/hr/article/10/1/uhac247/6794931 by guest on 19 May 2023
Figure 4. CLas titer and citrus Huanglongbing (HLB) symptoms on investigated Valencia sweet orange accessions. (A) CLas titers of the DVS, T78, and
T19 trees. The titer of CLas is represented by the Ct. values of qPCR tests using the 16S rRNA primers. (B) Leaf area indexes of the investigated trees.
The CLas titers and leaf area indexes were tested on 5 to 6 different sections of each tree for 2 DVS, 2 T78, and 4 T19 trees (including SF). One largest
and one smallest values of each tree were removed before calculating the mean Ct. and leaf area index values and the standard deviations (error bars
in panels A and B). The lower-case letters a and b on top of the bars denote statistically different (p < 0.05) groups. (C) and (D) Photos of an
HLB-affected T19 tree and an HLB-affected DVS tree taken in April 2019, respectively. Note the relative differences in tree size, canopy density, and
color of the foliage.

was detected (Supplementary Table 14). In T19, the expression of               sHSP had the largest number (44) of upregulated genes and
DVS7B01006 (encoding a GPI-anchored adhesin-like protein) that                 also the highest mean upregulation level (10.6-fold on average).
was truncated by TRA7 was significantly downregulated. The 3                  Moreover, ten enzyme-encoding genes involved in reducing
end of DVS_B CsXPO1 trimmed by TRA7 had significantly lower                    reactive oxidative species (ROS) were significantly upregulated
expression compared to DVS and T78, while the 5 region was not                in T19, including 7 CsAPX family members, CsCSD1, and 2 CsP2
significantly altered (Fig. 6B).                                               (Supplementary Table 16). Considering reducing ROS alone could
                                                                               relieve HLB symptoms [35], the widespread enhanced stress
The HLB-tolerance mechanism in T19                                             responses only observed in T19 should explain its high HLB
T19 had significantly enriched gene upregulation in responses                  tolerance (Supplementary Fig. 13).
to multiple stresses (including heat, osmotic, oxidative, and                     Somatic mutations are assumed to be the ultimate cause of
nutrition-level), energy metabolism (including mitochondrial                   the transcriptomic difference, thus we searched for the stress
metabolism and photosynthesis), ribosome biogenesis, and                       response-related genes affected by the SVs. One terminal of
translation activities compared to DVS and T78 (Supplementary                  the segment translocated by TRA7 is significantly (FDR = 0.015)
Table 20). Moreover, hairpin precursors (pre-) of three stresses               enriched in upregulated alleles (Fig. 7B). We found three HSP-
related microRNAs were differentially expressed in T19; pre-csi-               related genes in this region all upregulated in T19, including
MIR160b,c [32] were significantly upregulated, pre-csi-MIR398b                 an sHSP (sHSP17.4B), an HSP40 (CsDnaJ), and a CCAAT enhancer-
[33] and pre-csi-MIR396c [34] were significantly downregulated in              binding protein-encoding gene (CsCEBPZ) (Fig. 7B, C). HSPs are
T19 (Supplementary Table 21). We did not observe upregulation                  known to counter ROS and play important roles in plant stress
of immunity responses or responses to biotic stresses in                       responses [36, 37]. Considering the susceptible DVS and T78
T19. Ninety-two of all 274 expressed HSPs were significantly                   could not bring such stress responses, we hypothesize that
upregulated in T19 compared to DVS and T78 (Fig. 7A and                        the upregulation of the HSP-related genes enables the stress
Supplementary Table 22). HSP90s, HSP70s, HSP100s, and small                    responses in T19 by preventing the phloem protein homeostasis
HSPs (sHSPs) were enriched over 10-fold (FDR < 0.05) among                     from collapsing under stress burst from CLas multiplication
the upregulated genes (Supplementary Table 23). Among them,                    (Fig. 7C).
8 | Horticulture Research, 2023, 10: uhac247
Downloaded from https://academic.oup.com/hr/article/10/1/uhac247/6794931 by guest on 19 May 2023
Figure 5. Biased allelic expression and allelic expression ratio alteration in DVS, T19, and T78. (A) Allelic expression in DVS, T19, and T78
transcriptomes. Each dot represents a DVS bi-allelic gene locus. A-allele and B-allele denote the corresponding alleles of a gene in DVS_A and DVS_B.
The allelic expression quantity was normalized as transcripts per million (TPM). Genes with significantly biased allelic expression are colored blue
(mainly expressing A-allele) and light red (mainly expressing B-allele), respectively. (B) Hierarchical clustering of DVS, T19, and T78 based on their
allelic expression patterns. The transcriptomes in the left panel were clustered using one thousand genes with the highest allelic expression ratio
variance. The scale bars denote the corresponding colors of the allelic expression ratios in the left panel and Pearson correlation coefficient r in the
right panel. (C) The distribution of genes with significant allelic expression ratio alterations among DVS, T19, and T78. (D) Scatter plots showing the
corresponding A-allele expression ratios of genes among DVS, T19, and T78. Each dot represents a DVS gene. The axes denote the A-allele expression
ratios in the corresponding accessions, with 0 indicating 0% A-allele expression and 1 indicating 100% A-allele expression. Genes with significant
A-allele expression ratio increase and decrease in the horizontal axis accession compared to the vertical axis accession are colored blue and light red,
respectively.
Discussion As the lengths of sequencing reads improved [40], the high
We assembled a phased chromosome-level sweet orange genome intra-genomic heterozygosity, such as found in sweet orange,
with improved completeness, accuracy, and gene structure anno- could be utilized as an advantage in phased genome assembly.
tation compared to the recently updated HSO genome [5]. We We adapted the assembly parameters to the allelic difference
have found a high level of intra-genomic variance in DVS, with level of sweet orange and assembled most genomic regions
more than four-fold SNVs compared to previously reported using directly into two haploid contigs. Our method avoided mapping-
the next-generation sequencing method [1]. The abundant hem- based phasing in the highly heterozygous genomic regions and
izygous genes and high allelic variance level in DVS indicate has achieved a very low hamming error rate. Genetic maps
the genetic redundancy of sweet orange as a diploid has been [1, 2, 41] or the Hi-C technology [5, 42] have been utilized
discounted considerably. DVS enables allele-level mutation iden- in the scaffolding step of the citrus genome assembly. This
tification and gene expression quantification in sweet orange, and study shows that for genomes with diverged repeat units
will also facilitate allele-specific protein expression analysis [38] among long-tandem repeat regions, the long sequencing reads
and allele-specific genetic engineering [39]. Many citrus cultivars could have contained enough information for chromosome-
contain genetic materials from both pummelo and mandarin level scaffolding. CANU’s capacity to resolve high-similarity
[2, 3], making DVS a very important tool for genetic analyses repeats [43] is important for the successful application of our
within Citrus. method.Wu et al. | 9
Downloaded from https://academic.oup.com/hr/article/10/1/uhac247/6794931 by guest on 19 May 2023
Figure 6. Allelic expression alterations directly induced by structural mutations. In both (A) and (B), the genomic regions were split into 100 bp
continuous non-overlapping windows. The vertical axes show the normalized uniquely mapped RNA-seq read counts in each window using the
counts per million reads mapped (CPM) method. The horizontal axes denote the coordinates (bp) in the DVS genome. (A) Allelic expression in the
deleted region of DEL58 (bottom panel) and its allelic region (top panel) in DVS and T78. DEL58 is a 1.8 Mb deletion on chr8B only detected in T78. The
green dashed frames denote the deleted region (bottom panel) and its allelic region on chr8A (top panel). (B) Regional expression alteration of DVS_B
CsXPO1 (DVS3B03315) truncated by TRA7. Different transcript isoforms are shown at the bottom, with blue rectangles representing exons and lines
indicating introns. The red frame marks the truncated 3 region of CsXPO1 in T19, and the red arrow points to the chr3B:39117014 break endpoint
of TRA7.
The phased DVS assembly allows precisely resolving the the genomic composition and origin of sweet orange [1, 2]. Xu
genetic composition and origin of sweet orange. Two whole- et al. (2013) estimated the di-haploid sweet orange genome
genome sequencing-based studies had different inferences on with ∼1/4 pummelo and ∼ 3/4 mandarin genomic contributions10 | Horticulture Research, 2023, 10: uhac247
Downloaded from https://academic.oup.com/hr/article/10/1/uhac247/6794931 by guest on 19 May 2023
Figure 7. Transcriptomic alterations and molecular mechanisms related to the high citrus Huanglongbing (HLB) tolerance of T19. (A) Heat map
showing RNA-seq expression quantification of heat shock protein genes (HSPs). DESeq2 normalized RNA-seq read counts were utilized in making
panels A and B. Each column shows the z-scores of normalized read counts of an HSP in the nine transcriptomes. The hierarchical clustering
dendrograms were produced based on the Euclidean distances (Z-scores) among the transcriptomes (right) and the HSP genes (top). (B) Histogram
showing the normalized gene expression across the translocated segment (green dashed-frame) by TRA7. Only genes with an average read count of ≥3
per transcriptome are shown. Blue and red stars denote being significantly (FDR < 0.1) different in T19 from DVS and T78, respectively. The orange
frames indicate the seven genes with upregulated expression (p < 0.05) in T19 compared to both DVS and T78. (C) Hypothesized molecular
mechanisms for HSP-related HLB tolerance of T19. The multiplication of CLas inside citrus phloem cells causes the burst of multiple stresses. In the
susceptible sweet orange (left), the basal HSP levels are too low to deal with the stress-induced denatured proteins, resulting in the protein
homeostasis collapse which paralyzes phloem metabolism and disables stress-induced defense responses. In the tolerant mutant T19, the expression
of CsDnaJ (DVS7B01009 in panel B), CsHSP17.4B (DVS7B01013), and CsCEBPZ (DVS7B01014) are upregulated by the structural mutation TRA7, which
increases basal HSP level and keeps phloem protein homeostasis under the stress burst, allowing the induction of the stronger stress-induced
responses observed in T19 transcriptomes.
and inferred it to have originated as (P × M) × M. The genomic a mandarin which contained a small proportion of pummelo
composition of the diploid sweet orange identified in this study introgression (containing ∼2.8% pummelo nuclear DNA) should
is close to that found by Wu et al. (2014). The chloroplast and be its paternal parent.
mitochondrial DNA indicated that sweet orange has the pummelo This study has revealed a large number of AEPs but is still far
cytoplasm [44]. Accordingly, sweet orange most likely had either from the full scenery in sweet orange. Previously, the knowledge
a [(P × M) × P] × P or a (P × M) × P as its maternal parent, and of AEP diversity in sweet orange was mostly non-existent, sinceWu et al. | 11
allelic expression has rarely been studied [45, 46] due to the lack of but is endured by the T19 due to the upregulation of HSP-related
a high-quality phased reference genome. The diversified AEPs in genes induced by TRA7. The immunity responses including
different organs/tissues at different development stages possibly callose deposition and programmed cell death induced by CLas
explain why sweet orange has many specific characteristics differ- microbe-associated molecular patterns [65] are inferred to occur
ent from its parental species. The wide existence of allelic expres- after the stress-induced phloem necrosis in the susceptible
sion ratio alterations among sweet orange cultivars (mutants) is citrus (Supplementary Fig. 13). HSPs are molecular chaperones
not only related to somatic mutations. They also imply a high responsible for keeping cellular protein homeostasis under abiotic
abundance of cis variations [47] in the sweet orange genome. Due and biotic stresses [36, 37]. The three upregulated HSP-related
to the abundant cis variations, novel somatic mutations might genes putatively have enhanced the basal tolerance of denatured
induce a butterf ly effect on AEP, which partially explains why proteins in the T19 phloem. CsHSP17.4B encodes an sHSP that
sweet orange and other citrus inter-specific hybrids have a high binds denatured proteins and prevents protein aggregation in
frequency of bud sport selections. an ATP-independent manner [66]. CsDnaJ (HSP40) stimulates
Most irradiation-induced and spontaneous somatic SVs have the ATPase activity of HSP70 heat-shock proteins [67], and its
developed through different molecular mechanisms. Irradiation upregulation has potentially reduced the impact of lowered
could cause a wide variety of DNA lesions, among which double- ATP levels due to CLas consumption. CsCEBPZ encodes a CCAAT
Downloaded from https://academic.oup.com/hr/article/10/1/uhac247/6794931 by guest on 19 May 2023
strand breaks are the most relevant to structural mutations enhancer-binding protein, and CCAAT boxes are found in the
[48, 49]. In this study, five of the seven putative irradiation- promoters of many plant HSPs [68, 69]. Our study brings a new
induced SVs in T19 and T78 involved double-strand break repair hypothesis on HLB symptom development and indicates the basal
in the non-homologous end-joining manner [50]. TE activity HSP (particularly the ATP-independent sHSP) level might have
has been reported to be the primary source of spontaneous played a key role in the HLB tolerance of citrus.
SVs in a few plants [51, 52]. A few bud sports from sweet
orange and other citrus fruit types have been distinguished by
TE polymorphism [53–55]. In 114 sweet orange accessions, TE
Methods
insertions accounted for 40.1% of the large somatic insertions Plant materials
detected [5]. This study shows that the spontaneous SVs detected Valencia sweet orange buds were exposed to 50 Gy gamma irra-
are mainly (31/40) derived from the insertion of three MULEs diation, and more than 1200 trees were produced by budding
(Supplementary Table 15), indicating they might be hyperactive onto Volkamer lemon rootstock seedlings and planted in the
and have played an essential role in the formation of some sweet field in 1992, as part of a mutation breeding project. From these
orange cultivars. trees, 6 were identified as bearing nearly seedless fruit including
SVs have been reported to cause differential gene expressions T19, SF, and T78. These were subsequently repropagated onto
in a few species [56, 57]. The retrotransposon insertion in the Carrizo citrange rootstock and at least 2 of T78 and 3 of T19 were
promoter region caused the Ruby gene to be expressed under planted in the field near Lake Alfred, FL in the summer of 2000.
cold stress in blood sweet orange [6]. Diversified effects of SVs on They along with DVS have grown in the field under the same
gene expression have been observed in this study. The expression management conditions since then. DVS and OVS are different
of deleted alleles in T78 was generally eliminated as expected, Valencia orange trees, the former being the tree used to produce
and their alternate alleles’ expression was mostly unaffected. the genome assembly reported here, and the latter being the
The case for a truncated gene was more complicated, which budwood source to produce the irradiated Valencia population
could either be entirely downregulated or only have a 3 end from which T19, T78, and SF were selected. The SF tree was known
downregulation. Chromosomal rearrangements could affect the to be grafted from one of the original nearly seedless selections
expression of adjacent genes by causing changes in chromatin from the same experiment, but the identification tag was lost, so
topology, but their effects remain difficult to predict [58]. We its clonal identity was uncertain. HLB was first detected in this
found most chromosomal rearrangements in T19 and T78 had field location in 2008, and by 2010 virtually all trees were showing
no noticeable impact on the expression of adjacent genes except symptoms of disease. These specific individuals, although also
for TRA7. exhibiting HLB symptoms, were first noted for their obvious supe-
Multiple mechanisms have been associated with HLB rior performance and substantially better appearance compared
resistance/tolerance in citrus (Supplementary Fig. 13) [10, 11, with all other nearby trees of standard Valencia that were in
14, 35, 59–63]. The primary cause of HLB symptoms is the severe decline, as well as a wide range of other materials from
dysfunctional phloem induced by CLas infection [14, 64]. ROS the breeding program likewise in severe decline, in 2017. T19
accumulation has been reported to play an important role in trees have retained their tolerant phenotype, but T78 trees have
HLB symptom development, and Ma et al. (2022) inferred it to be gradually declined since first noted.
caused by chronic immune responses in the phloem tissue [35].
However, there is no clear proof that CLas could be recognized Measurement of leaf area index and CLas titer
by citrus within the phloem, and we did not observe different The leaf area index (LAI) was measured using AccuPAR LP-80
immunity responses between T19 and the susceptible accessions (Meter Group, Pullman, WA, USA) near solar noon in June 2021.
(DVS/T78). Moreover, the chronic accumulation of ROS cannot The external photosynthetic active irradiation (PAR) sensor was
explain the different stress responses between T19 and DVS/T78. placed in a nearby open area, and the LP-80 instrument PAR
Considering plant sieve elements are cells specialized for probe was placed under the canopy of each tested tree. The LP-80
transporting sugars throughout the plant which lack nuclei and computed LAI from the PAR readings and χ (leaf angle distribu-
have very few organelles, the metabolic wastes and ATP/nutrition tion parameter). The default χ parameter (χ = 1) was applied. On
consumptions from CLas multiplication should be able to cause a average, 6–7 measurements per tree were taken around each tree.
burst of stresses in the phloem (Fig. 7C). A reasonable explanation For CLas titer measurement, DNA was extracted from leaf
for the different stress responses between T19 and DVS/T78 is that midribs and petioles of each tree using the Plant DNeasy Mini
the stress burst paralyzes the phloem protein system of DVS/T78 Kit (Qiagen, Valencia, CA, USA) according to the manufacturer’s12 | Horticulture Research, 2023, 10: uhac247
instructions. qPCR quantification of the CLas titer using 16S rRNA CCL genome [2]. Using the CLR reads, three rounds of polishing
primers was carried out as described by Li et al. (2006). qPCR were carried out by pbmm2 and arrow in GenomicConsensus
was performed on an Agilent Mx3005P (Agilent Technology Inc, v2.3.3 (Pacific Biosciences, Menlo Park, USA). The phylogenetic
Waldbronn, Germany) real-time PCR system with the Brilliant III origin of the chromosomal regions and switch errors were inferred
Ultra-Fast QPCR Master Mix (Agilent Technology Inc, Waldbronn, using twenty mandarin and twenty pummelo whole-genome
Germany). NGS data sets (Supplementary Table 3) downloaded from the
NCBI database using the method described in Supplementary
DNA and RNA extraction Note 3.
For next-generation sequencing (NGS) and PacBio sequencing,
young leaves of DVS, T78, T19, and SF (PacBio sequencing only) Hamming error rate estimation
were collected from new f lushes in April 2018 and April 2019, The paternal and maternal parents of sweet orange are unknown,
respectively. We used the CTAB method [70] to extract genomic so we estimated the hamming error rate across the genome based
DNA for NGS. For PacBio sequencing, genomic DNA was isolated on its di-haploid offspring HSO [5]; 100 × sequencing reads were
using Nanobind Plant Nuclei Big DNA Kit (Circulomics Inc., Balti- simulated without sequencing error based on the HSO genome
more, MD, USA) following the manufacturer’s instructions. by wgsim (acquired on 06/15/2021 from https://github.com/lh3/
Downloaded from https://academic.oup.com/hr/article/10/1/uhac247/6794931 by guest on 19 May 2023
For RNA extraction, mature leaves were collected from three wgsim). The simulated reads were mapped to DVS using min-
different tree parts for DVS, T19, and T78 as replicates. In total, imap2 v2.17. The simulated reads uniquely mapped to DVS_A
nine RNA samples were extracted using TRIzol™ and RNA Purifi- (CA ) and DVS_B (CB ) were counted in 20 kb continuous windows
cation Kit following the manufacturer’s protocol (ThermoFisher, with 15 kb overlap across the HSO genome. The hamming error
Waltham, MA, USA). RNA was further purified using the TURBO rate was calculated as the minimum of CA and CB divided by
DNA-free™ kit (ThermoFisher, Waltham, MA, USA) to eliminate the sum of CA and CB in each window. HSO is from a di-haploid
genomic DNA. Both NanoDrop Spectrophotometer (NanoDrop offspring of sweet orange, thus the windows overlapped with
Technologies, Wilmington, DE, USA) and Agilent 2100 Bioanalyzer putative chromosomal recombination loci in HSO, identified with
(Agilent Technologies, Waldbronn, Germany) were used to assess surrounding windows switching from CA > CB to CB > CA or vice
the RNA quality and quantity. versa, were excluded from the calculation.
De novo assembly of DVS and the mutants Quality evaluation and comparison between DVS
Whole-genome PacBio continuous long reads (CLR) were obtained and HSO
for DVS, SF, T78, and T19 on the PacBio Sequel II system (Pacific HSO and DVS were aligned using minimap2 v2.17. The dot-plot
Biosciences, Menlo Park, USA). One-hundred-fold coverage of cor- was then drawn by D-GENIES v1.2.0 [77]. For assembly qual-
rected reads (N50 = 42.0 kb) was used. A minimum of 98.5% over- ity assessment, we obtained 26–30 × pair-end sequencing reads
lap identity was required in the assembly step to reduce col- (150 bp × 2) from Illumina HiSeq 2500 (Illumina, San Diego, CA,
lapsed assembly in heterozygous regions. We carried out de novo USA) for DVS, T19, and T78. The K-mer-based completeness and
assembly of DVS using MECAT2 [71] with four different minimum the error rates of the assemblies were assessed by Merqury v1.3
read overlap lengths (500 bp, 2 kb, 5 kb, and 10 kb). A 2 kb [78]. The core gene completeness test was carried out by BUSCO
minimum read overlap length was identified as optimal since v5.0.0 [79] using its eudicots_odb10.2019-11-20 database.
the assembly achieved the second-largest N50 and the largest For the mapping rate test, we downloaded twelve whole-
assembly size. The assemblies’ accumulative length and contig genome NGS data sets of different sweet orange cultivars
N50 were assessed using QUAST v5.1 [72]. De novo assembly of (Supplementary Table 25) from NCBI. They were aligned to DVS
the three mutants was carried out by MECAT2 using the optimal and HSO by BWA v0.7.17 with the default parameters. Then we
parameters observed for DVS (Supplementary Table 24). obtained the mapping rates using SAMtools v1.10.
We also carried out de novo assembly of DVS using CANU To analyze the sequencing depth homogeneity across the HSO
v2.1 [43] with the optimal settings (correctedErrorRate = 0.015, assembly, we downloaded its whole-genome PacBio continuous
minOverlapLength = 2000, genomeSize = 340 m, and corOutCov- long reads (SRR5838837) [5] from NCBI. The long reads of DVS and
erage = 100). CANU produced ∼26.6 Mb more sequences mainly HSO were mapped to them respectively by minimap2 v2.17. The
derived from repetitive regions. The contigs in the CANU assembly sequencing depths across the two assemblies were output using
were connected into pseudochromosomes through (1) phased BEDTools v.2.29.2.
assembly of the collapsed and expanded regions; (2) resolving the
repeat units in long tandem repeat regions (Supplementary Fig. 1). Intra-genomic variation detection and annotation
In the process, each contig in the CANU assembly was mapped We aligned DVS_B to DVS_A using minimap2 v2.17 and called
against the remaining contigs using minimap2 v2.17 [73] with the small variants using BCFtools v1.10 with the consensus
option -x asm20 to detect orthologous regions. The sequencing model [80]. Only regions with one-to-one unique alignments
depth across the assembly was output using BEDTools v2.29.2 [74] were used to call the variations. SNVs or indels within 10 bp
in 1 kb windows. The unphased regions and putatively collapsed distances of other indels were filtered. For SV detection, we
regions were subjected to phased assembly using pb-falcon carried out whole-genome alignment between DVS_A and DVS_B
v2.24 [75] with our bash script and configuration files (acces- using Mummer v4.0.0 [81], and the SVs were called by MUM&CO
sible from https://github.com/TheLuoFengLab/DVS-assembly- v2.4.2 [81]. The circular graph (Fig. 1A) showing the distribution
and-allele-aware-RNAseq-pipeline.git). We used the BLASTN of the variations was drawn using Circos v0.69–9 [82]. Genetic
algorithm in NCBI blast+ v2.5.0 [76] to align contig terminal variant annotation and functional effect prediction for the
segments for repeat unit identification. A circular mitochondrion small variants were predicted by SnpEff v5.0 [83], which defined
genome and a circular plastid genome were manually recovered the categories of high, moderate, low, and modifier impact
by aligning and connecting several contigs with high coverage. variants. Genes overlapping the SVs were analyzed with BEDTools
The chromosomes were named in concordance with the haploid v2.29.2.Wu et al. | 13
Annotation of the DVS genome Detection of somatic SVs in the
TEs were predicted in the DVS genome using both RepeatModeler radiation-induced mutants
v2.0.1 [84] / RepeatMasker v4.1.1 [85] and the Extensive de-novo Assembly and mapping-based strategies were combined in
TE Annotator (EDTA) v1.8.3 pipeline [86]. Unclassified TEs were detecting somatic structural variants. The assemblies of the
subjected to convolutional neural networks-based classification mutants were aligned to DVS, and candidate SVs were called
by DeepTE using the plant model [87]. by MUMMER v4.0.0. We obtained a set of false-positive SVs by
The DVS genome was soft-masked using RepeatMasker v4.1.1 aligning the four MECAT assemblies of DVS. In the mapping-based
and the non-redundant TE library from the EDTA pipeline. Ab initio method, the PacBio continuous long reads were mapped using
gene prediction and transcriptome data assembly-based methods Minimap v2.17, and the SVs were called using Sniff les v1.0.12 [100]
were applied in combination to annotate gene models in the with a requirement of at least ten zero-mode waveguides support.
genome. Eighty sweet orange transcriptomic RNA-seq data sets Then we compared the SVs from the two strategies. Maximum
(Supplementary Table 26) from multiple tissue types were down- margin distances of 50 bp for breakpoint ends of translocations,
loaded from NCBI and mapped to DVS using HISAT2 v2.2.1 [88] and 50 bp or 10% of the SV lengths (whichever smaller) for
for RNA-seq evidence. The UniProtKB/Swiss-Prot plant database deletions, insertions, tandem duplications, and inversions, were
Downloaded from https://academic.oup.com/hr/article/10/1/uhac247/6794931 by guest on 19 May 2023
(accessed on 10/13/2020) [89] was used to generate protein hints allowed for the SVs from the two strategies to be considered the
with GenomeThreader v1.7.3 [90]. Then GeneMark-EP+ v4.65 [91] same. SVs detected by both methods were subjected to further
and Augustus v3.4.0 [92] were trained based on the RNA-seq analysis. We designed primers for 6 SVs and carried out ordinary
and protein hints using BRAKER v2.1.5 [93]. For transcriptome PCR amplification for verification (Supplementary Table 27).
assembly-based annotation, RNA-seq reads uniquely mapped to
DVS_A or DVS_B were separated into two sets, with reads equally RNA-seq, miRNA-seq, and differential expression
mapped to DVS_A and DVS_B added to both sets. RNA-seq read analysis
assembly and transcript screening were then carried out for
Whole-transcriptome sequencing and microRNA sequencing
DVS_A and DVS_B respectively with Mikado v2.0 [94].
were carried out by BGI Genomics (Shenzhen, China). The
sequencing via Illumina HiSeq 4000 (Illumina, San Diego, CA, USA)
Annotation completeness comparison among produced >5 Gb clean pair-end (150 × 2) reads for each sample.
citrus assemblies The masked DVS in RNA-seq mapping rate tests was used
To compare the completeness of gene structure annotations, the as the reference in RNA-seq analysis. Salmon v1.4.0 [101] was
protein sequences encoded by the first transcript of all genes applied in read mapping and counting, with multi-mapped reads
were output for DVS, DVS_A, DVS_B, HSO [5], Clementine (Citrus assigned by the expectation–maximization algorithm. Read count
clementina Hort. ex Tan.) [2], box orange [Atlantia buxifolia (Poir.) normalization and differential expression tests were carried out
Oliv.], Ichang papeda (Citrus ichangensis Swingle), citron (Citrus by DESeq2 v1.30.1 [102]. Genes with significantly (FDR < 0.1) dif-
medica L.), pummelo [15], mandarin [4], kumquat (Citrus hindisii ferential expression at the allelic level were first detected in a
Champ. ex Benth.) [95], ZK (Citrus trifoliata L.) [41], and PTR (C. tri- pairwise manner among DVS, T19, and T78. Then those signif-
foliata) [42]. The protein sequences were tested against the eudicot icantly upregulated or downregulated genes compared to both
core gene set (eudicots_odb10.2019-11-20) by BUSCO v5.0.0 [79]. DVS and T78 (T19) were identified as differentially expressed
genes in T19 (T78). We carried out miRNA-seq analysis using the
RNA-seq mapping rate tests nf-core smRNASeq pipeline v1.1.0 [103].
The RNA-seq data mapping rate was compared with different We mapped all RNA-seq data to DVS using HISAT2 v2.2.1. The
citrus assemblies as the reference. A masked DVS version was uniquely mapped reads were counted in 100 bp continuous non-
generated by masking the allelic genes with14 | Horticulture Research, 2023, 10: uhac247
groups. Hierarchical clustering and t-SNE visualization on the 2. Wu GA, Prochnik S, Jenkins J et al. Sequencing of diverse man-
AEPs were carried out using python with the packages seaborn darin, pummelo and orange genomes reveals complex his-
v0.11.2 and scikit-learn v1.0.2. tory of admixture during citrus domestication. Nat Biotechnol.
2014;32:656–62.
qPCR quantification of gene expression 3. Wu GA, Terol J, Ibanez V et al. Genomics of the origin and
Twenty-three DEGs in T19 (Supplementary Tables 28 and 29) evolution of citrus. Nature. 2018;554:311–6.
identified by RNA-seq were selected for quantitative real-time 4. Wang L, He F, Huang Y et al. Genome of wild mandarin and
PCR (qPCR) verification. First-strand cDNA was synthesized domestication history of mandarin. Mol Plant. 2018;11:1024–37.
from 0.3 μg of total RNA using the Affinityscript qPCR cDNA 5. Wang L, Huang Y, Liu Z et al. Somatic variations led to the
Synthesis Kit (Agilent Technologies, Santa Clara, CA, US). qPCR selection of acidic and acidless orange cultivars. Nature Plants.
was performed using the Brilliant III Ultra-Fast SYBR Green QPCR 2021;7:954–65.
Master Mix (Agilent Technologies, Santa Clara, US) following its 6. Butelli E, Licciardello C, Zhang Y et al. Retrotransposons control
instructions. With 18S rRNA as the reference gene [106], the 2-Ct fruit-specific, cold-dependent accumulation of anthocyanins
Ct method [107] was applied to analyze the qRT-PCR results. in blood oranges. Plant Cell. 2012;24:1242–55.
Downloaded from https://academic.oup.com/hr/article/10/1/uhac247/6794931 by guest on 19 May 2023
7. Bové JM. Huanglongbing: a destructive, newly-emerging,
century-old disease of citrus. J Plant Pathol. 2006;88:7–37.
Acknowledgments
8. Folimonova SY, Robertson CJ, Garnsey SM et al. Examination of
This work was supported in part by the United States Department the responses of different genotypes of citrus to Huanglongbing
of Agriculture National Institute of Food and Agriculture (NIFA) (citrus greening) under different conditions. Phytopathology.
under Grant 2017-70016-26051 to F. L. and F. G., and the U.S. 2009;99:1346–54.
National Science Foundation (NSF) under Grant ABI-1759856 and 9. Wang Y, Zhou L, Yu X et al. Transcriptome profiling of Huang-
MTM2-2025541 to F.L. This research was partially supported by longbing (HLB) tolerant and susceptible citrus plants reveals
grants from the Citrus Research and Development Foundation the role of basal resistance in HLB tolerance. Front Plant Sci.
(CRDF 15-010, CRDF RMC 18-010, and CRDF RMC 18-011), and the 2016;7:933.
New Varieties Development and Management Corporation to F.G. 10. Wu B, Li N, Deng Z et al. Selection and evaluation of a thornless
and HLB-tolerant bud-sport of pummelo citrus with an empha-
sis on molecular mechanisms. Front Plant Sci. 2021;12:739108.
Author contributions
11. Yu Q, Chen C, Du D et al. Reprogramming of a defense signaling
F.G. and F.L. conceived and designed this project. F.G. and Q.B.Y. pathway in rough lemon and sweet orange is a critical element
observed and assessed the HLB tolerance of the plants. Q.B.Y of the early response to ’Candidatus Liberibacter asiaticus’.
carried out all the biological experiments. B.W. did all the bioin- Hortic Res. 2017;4:17063.
formatical and statistical analyses. B.W., Q.B.Y., F.G., and F.L. wrote 12. Miles GP, Stover E, Ramadugu C et al. Apparent tolerance
the paper. Z.D and Y.P.D evaluated the plant materials and the to Huanglongbing in citrus and citrus-related germplasm.
data analysis results. All authors have read and approved the final HortScience. 2017;52:31–9.
version of this paper. 13. Huang M, Roose ML, Yu Q et al. Construction of high-density
genetic maps and detection of QTLs associated with Huang-
longbing tolerance in citrus. Front Plant Sci. 2018;9:1694.
Data availability
14. Deng H, Achor D, Exteberria E et al. Phloem regeneration is
All sequencing data generated in this study (PacBio sequencing, a mechanism for Huanglongbing-tolerance of "Bearss" lemon
NGS sequencing, and RNA-seq data) have been deposited in the and "LB8-9" sugar belle® mandarin. Front Plant Sci. 2019;10:277.
National Center for Biotechnology Information (NCBI) under 15. Wang X, Xu Y, Zhang S et al. Genomic analyses of primitive,
BioProject ID PRJNA735893. The genome assembly and gene wild and cultivated citrus provide insights into asexual repro-
annotation of DVS have been submitted to NCBI under the duction. Nat Genet. 2017;49:765–72.
GenBank assembly accessions GCA_022201045.1 (DVS_A) and 16. Feng G, Ai X, Yi H et al. Genomic and transcriptomic analyses
GCA_022201065.1 (DVS_B). Data supporting the findings of this of Citrus sinensis varieties provide insights into Valencia orange
work are available within the paper and its Supplementary fruit mastication trait formation. Hortic Res. 2021;8:218.
Information files. The allelic expression patterns of 749 sweet 17. Zhang M, Deng X, Qin C et al. Characterization of a new natural
orange RNA-seq data sets (Supplementary File 1) can be periclinal navel–Satsuma chimera of citrus: ‘Zaohong’ navel
accessed from https://doi.org/10.6084/m9.figshare.19424699.v2. orange. J Am Soc Hortic Sci. 2007;132:374–80.
The scripts and configuration files used in the assembly processes 18. Feng G, Wu J, Yi H. Global tissue-specific transcriptome analysis
and the allele-aware RNAseq pipeline are accessible from https:// of Citrus sinensis fruit across six developmental stages. Scientific
github.com/TheLuoFengLab/DVS-assembly-and-allele-aware- Data. 2019;6:153.
RNAseq-pipeline.git. 19. Zhang H, Chen M, Wen H et al. Transcriptomic and
metabolomic analyses provide insight into the volatile
compounds of citrus leaves and flowers. BMC Plant Biol.
Conflict interests
2020;20:7.
The authors declare no competing interests. 20. Martinelli F, Uratsu SL, Albrecht U et al. Transcriptome profiling
of citrus fruit response to Huanglongbing disease. PLoS One.
2012;7:1–16.
References 21. Wang J-H, Liu J-J, Chen K-L et al. Comparative transcriptome
1. Xu Q, Chen L-L, Ruan X et al. The draft genome of sweet orange and proteome profiling of two Citrus sinensis cultivars during
(Citrus sinensis). Nat Genet. 2013;45:59–66. fruit development and ripening. BMC Genomics. 2017;18:984.You can also read