New findings regarding the ground air circulation by chimney effect in low-altitude permafrost susceptible porous screes Detunata Goală
←
→
Page content transcription
If your browser does not render page correctly, please read the page content below
New findings regarding the ground air circulation by chimney effect in
 low-altitude permafrost susceptible porous screes (Detunata Goală,
                       Romanian Carpathians)
Răzvan Popescu, Alfred Vespremeanu-Stroe, Mirela Vasile, Ilie Andrian, Sabina Calisevici, Bogdan Niculiță
                            Faculty of Geography, University of Bucharest

                                           Research project: PN-III-P1-1.1-PD-2019-1275
                                           Financed by Romanian Government (UEFISCDI)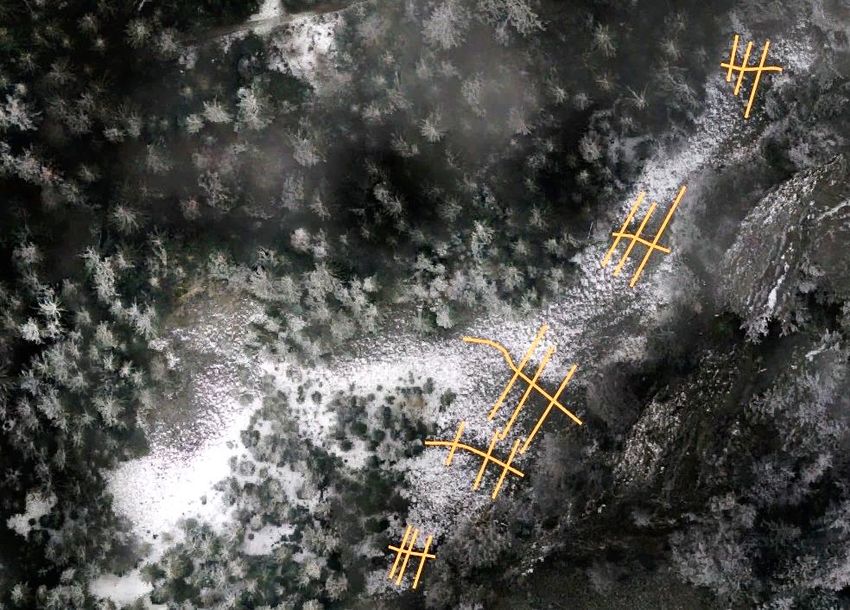
Objectives:

-    To analyze the relation between the morphometry of the
     deposit and the early winter warm air evacuation areas;

-    To discuss new geophysical investigations results (electrical
     resistivity tomography and seismic refraction tomography)
     performed in October 2020 in the coldest area of the scree;

-    To characterize the thermal and ground air circulation
     regime during February-April.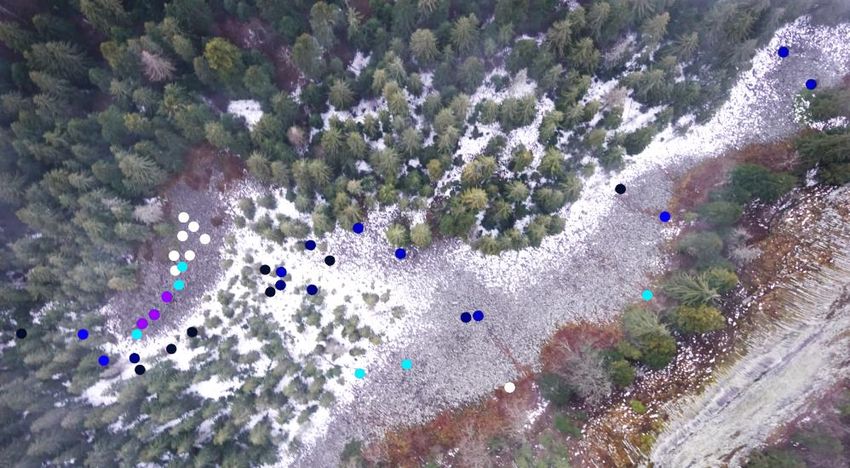
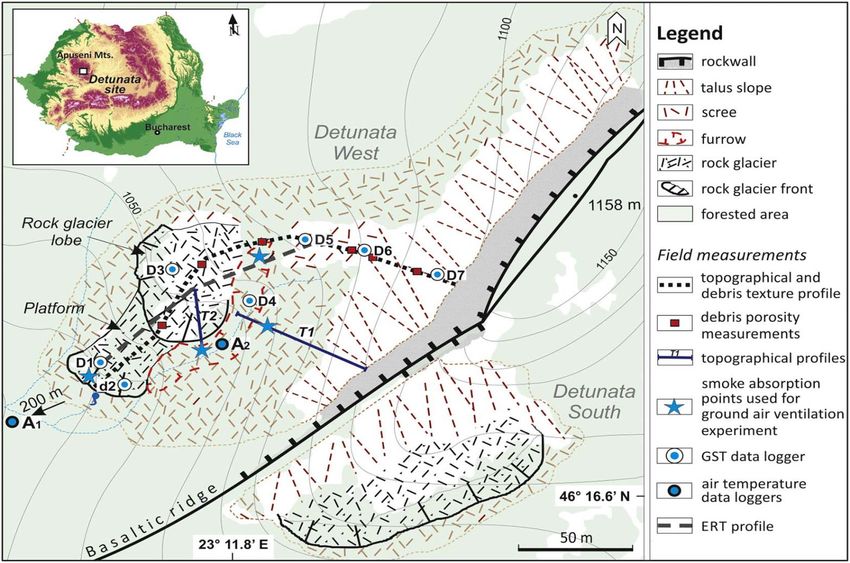
Study site

                                        • Basaltic andesite ridge with
                                          talus slope and probably
                                          rock glacier at the base;

                                        • Mean       annual        air
                                          temperature of 6-8°C;

                                        • Mean     annual      ground
                                          temperature is < 0 °C in the
                                          furrow caused by proven
                                          chimney effect;

Popescu et al., (2017). Geomorphology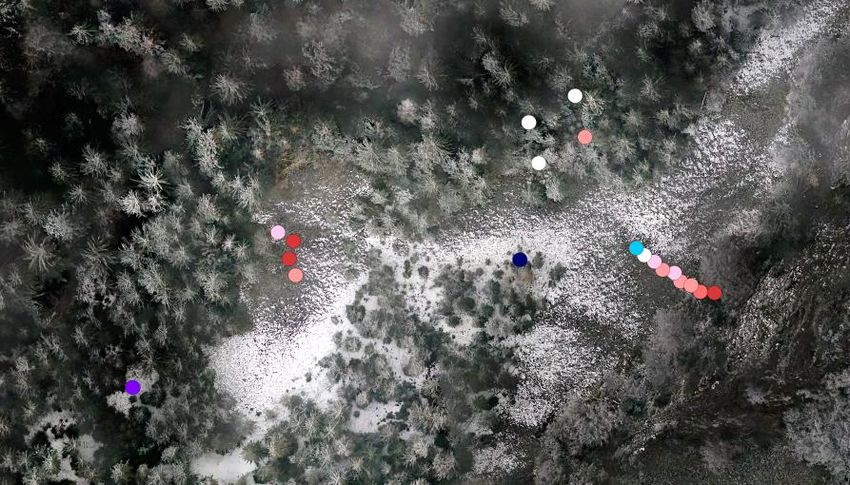
Aerial photographs (November-April) of rock glacier lobe (horizontal area) acting as a warm air
evacuation area during winter
29.11.2020, 16:25 30.11.2020, 11:53 30.11.2020, 16:54
Melting areas (29th) and lines (30th) at
the end of November 2020. Light
snowfall during the night between 29
and 30;
Melting zones in March (light snowfall
during previous night) or April
(unknown date of the most recent
previus snowfall) are related mostly to
solar radiation.
13.03.2021, 12:22 14.03.2021, 10:04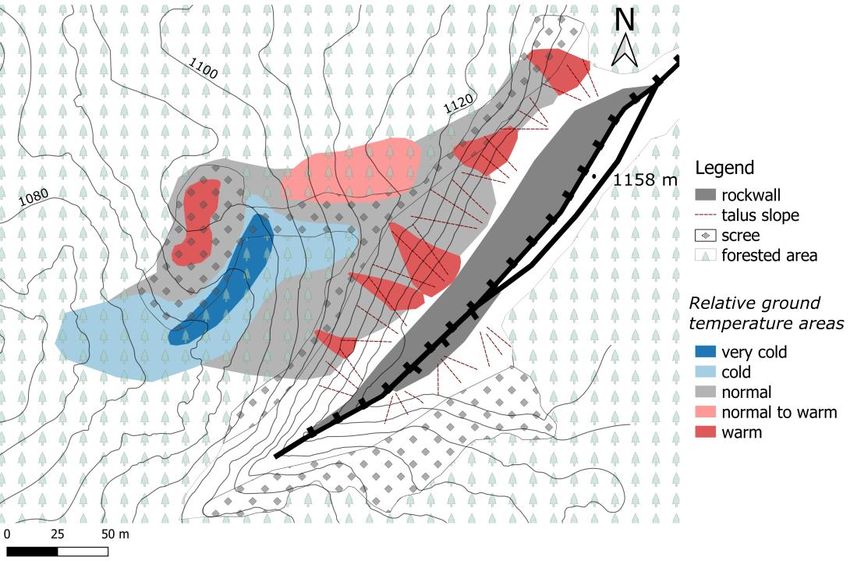
Aerial photographs (November-April) of talus slope (steep area)
29.11.2020, 16:39 30.11.2020, 11:57 30.11.2021, 16:58
Melting areas (lines or triangles with
base oriented uphill) form in
november 2020 after light snowfall
during previous night;
Melting zones in March (light snowfall
during previous night) or April
(unknown date of the most recent
previus snowfall) are related mostly to
solar radiation. That is in part because
“warm” air is not that warm any more.
14.03.2021, 10:06 19.04.2021,19:59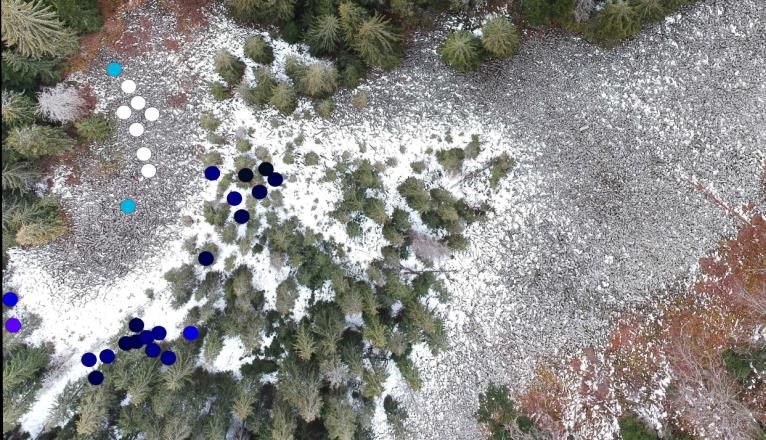
Itinerant measurements of ground temperature between gelifracts
N N
30 November - 1 December 2020 29 -31 January 2021
N N Thermal contrast between cold
and warm zones is pronounced
in early winter and fades
towards spring;
Their thermal regime is highly
dependent on air flow regime
and daily atmospheric
temperatures.
The early winter melting zones
from talus slope have an
13 March 2021 19-20 April2021 upwards thermal gradient.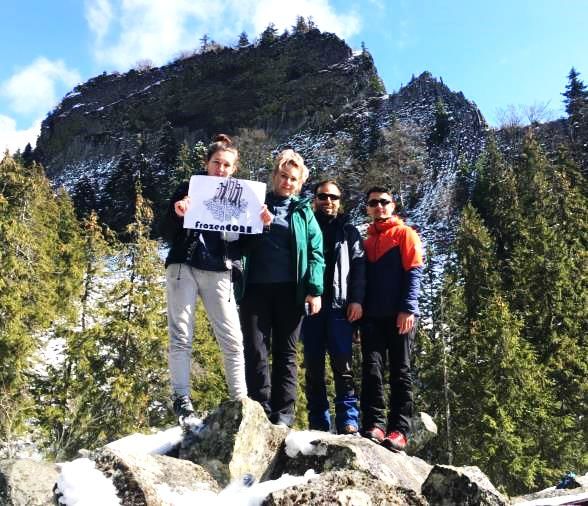
Distribution of thermal areas on the talus slope-rock glacier system during early winter using aerial survey
                                           and field thermal data

                         Rock glacier lobe

                                             Furrow

                   T logger

                       Anemometer and T logger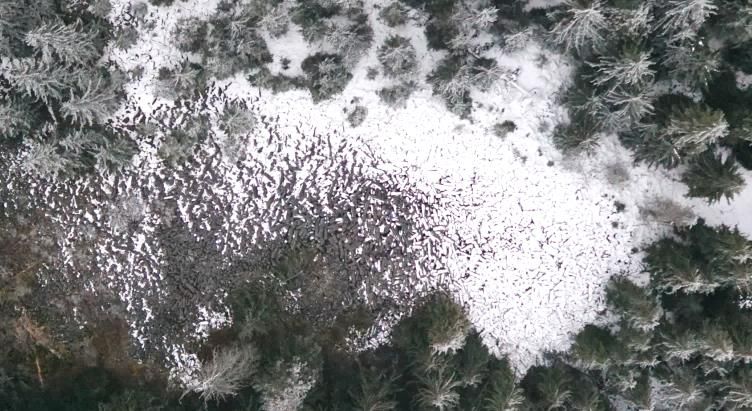
N

Numbering of early winter                                             Zone 1
melting zones and the
position of the transverse
profiles for plan curvature                                  Zone 2
evaluation.

                                                    Zone 3

                                           Zone 4

                                  Zone 5       Ortophoto: 29 November 2020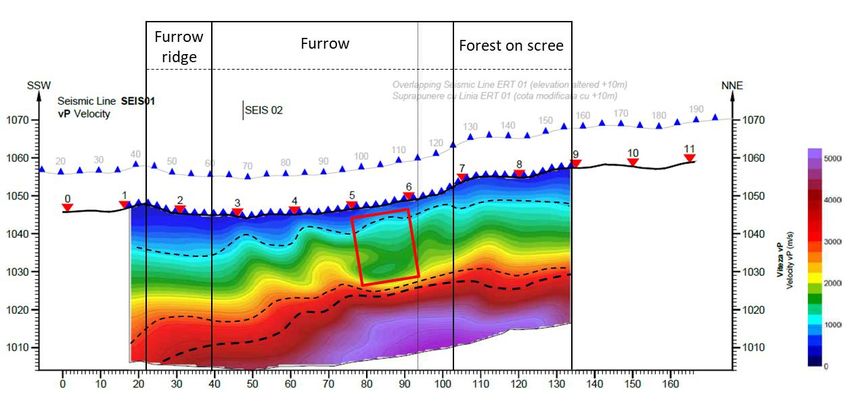
1 Zone 1 1
Zone 2
0.8 0.8
Altitude
0.6
0.6
0.4
0.4
0.2
0
Distance 0.2
0 0.5 1 0
Up Middle Low 0 0.5 1
1 1 1
Zone 3 Zone 4
0.8 0.8 0.8
Zone 5
0.6 0.6 0.6
0.4 0.4 0.4
0.2 0.2 0.2
0 0
0
0 0.5 1 0 0.5 1 0 0.5 1
1150
1140 Mean slope of
Zone 1 Zone longitudinal profile (°)
Altitude (m)
1130 1 30.9 All transverse profiles exept zone 5 are
Zone 2
2 35.9 convex and act as chymneys of warm air;
1120 Zone 3
3 27.6 Profile 5 is concave but has the largest slope
1110 Zone 5 4 35.0 value and the shortest length.
Zone 4
5 38.5
Distance (m)
1100
0 10 20 30 40
Seismic profile
(Seis01)

                                                                                      Low velocities (porous
                                                                                      scree?) down to 20 m

                                                          Higher velocities layer closer to the surface

          Scree stratigraphy in furrow (the maximum interest area)                       Profile performed in 15 October. Data below 20 m depth are less reliable
SEIS-1     Depths range    Thickness    P wave velocity    Interpretation
                                            (m/s)                                      P wave velocity in refraction seismic according to Draebing (2016):
               (m)         range (m)
                                                                                       -   Active layer: 500-900 m/s close to air (300 m/s);
Layer 1     0 - 2.5 ( 9)     2.5-9          0-900         Openwork scree               -   Rock glaciers permafrost: 3140 m/s;
                                                              layer                    -   Talus slope permafrost: 2700 m/s;
Layer 2     2.5 (9) – 20    16.5-24    900-2000 (3000)     Lower porosity              -   Ice core moraines: 3150 m/s;
                (30)                                          talus?                   -   Bedrock: >4000 m/s.
Layer 3     20 (30) – 25     1-10        3000-4000          Transition to
                (36)                                          bedrock?                 Stiegler et al., (2014) found 1700 m/s velocities at a low altitude permafrost
                                                                                       site but suggested that SRT is not very suitable for sounding such locations.
Layer 4    25 (36) – max                    >4000             Bedrock?
               depth
>17 kΩm
High resistivity cores
(50-560 kΩm) 10-13 mGround air circulation regime in February-April 2021
Outflow
Direction of air flow grouped around 0° (180-360 ° directions represented as -180...0 °) for outflow detection.
Inflow
Direction of air flow grouped around 180 ° for inflow detection.
Measured every 5 seconds and averaged and stored every 30 seconds with ultrasonic
anemometer (1405-PK-100 Gill instruments)Ground thermal
regimes in the
warm (rock glacier
lobe) and cold
(furrow) areas
along reference air
together with air
flow regime
(inflow-outflow
and speed)
Air outflow (occurring during warming atmospheric events) is more frequent than air inflow (during cold atmospheric events);
Air flow cessation/initiation thermal thresholds varies relative to the temperatures recorded in the previus days;
For inflow, all threshold are represented by negative temperatures, no outflow occurs in negative temperatures.Thank you!
Acknowledgements:
• Sebastian Radu Research project: PN-III-P1-1.1-PD-2019-1275
Financed by Romanian Government (UEFISCDI)
• Adriana Bărăngea
• Oliver and Alina Oniga
www.frozencore.unibuc.roYou can also read


