MI COVID response Data and modeling update - January 25, 2022 - State of ...
←
→
Page content transcription
If your browser does not render page correctly, please read the page content below
MI COVID response
Data and modeling update
January 25, 2022
Executive Summary
Current statistics and where we may be going
The Detroit MERC Region (Preparedness Regions 2N and 2S) are declining, but other regions are mixed
Coming off highest case numbers of entire pandemic: 30–39-year-olds currently have the highest case rate of any age group
Omicron reported in 60 counties in Michigan; Models suggest we are at or near peak for cases and hospitalizations
Preventing Death and Severe Outcomes
• Deaths rates have decreased over the last week for all age groups
• Cases in long term care facilities are decreasing, crucial to get LTC residents and staff up to date on vaccination
Protect Health Care Capacity
• COVID+ census in hospitals has declined statewide; Pediatric COVID+ census down slightly from recent pandemic high
• The peak number of hospitals in Michigan reporting critical staff shortages remains the highest during the pandemic (n=60)
• Federal support teams are deployed and will continue to support surges and hotspots in Michigan
Keep Vital Infrastructure Functioning
Community transmission is impacting schools
• Return to school following holiday break and spread of Omicron is seeing rapid growth in cases is several regions (e.g., Region 8)
Vaccination, Masking, Testing and Therapeutics are critical tools in our fight against the impact of COVID-19
Public health capacity is shifting to investigation and mitigation of COVID-19 outbreaks in priority settings like schools and long-term care facilities
Masks and respirators are effective at reducing transmission of SARS-CoV-2 when worn consistently and correctly
Global and National Trends

                                                                                                                            New cases of COVID-19, reported to CDC in Michigan,
                                                                                                                            Region 5, and the United States
                                                                                                                            7-day moving average of new cases per 100,000
                                                                                                                            300

                                                                                                                            250

                                                                                                                            200

                                                                                                                            150

                                                                                                                            100

                                                                                                                              50

                                                                                                                                0
                                                                                                                                    7/1           8/1             9/1            10/1        11/1        12/1       1/1
                                                                                                                                                         Michigan                Region 5           United States
   Globally, 351,985,355 cases and 5,598,284 deaths (Data* through 1/24)
   •    Globally, the highest number of cases ever reported on a single day on 1/19 (4.2 million); & cases in many countries are increasing exponentially with Omicron variant
   United States: 1.5% of Americans have been infected with COVID-19 in last week¶
   •    The U.S. is at High transmission level (1,511.4 cases/100,000 in last 7 days)
   Midwest states are increasing exponentially through January 20; early signs of decline since then
   •    Illinois and Ohio have the highest case rates in Midwest; California and Texas have highest case rates in U.S.
Source: * Johns Hopkins Coronavirus Resource Center; ¶ CDC COVID Data Tracker Weekly Review; † CDC COVID Data Tracker – CDC recently updated their methodology for reporting case rates

                                                                    Prevent Death and Severe                                                                                                Keep Vital Infrastructure
  Current Trends and Projections                                                                                              Protect Healthcare Capacity
                                                                           Outcomes                                                                                                               Functioning
Recent statewide trends
Statewide trends MERC Regional breakdown: Cases, hospitalization rate, and
positivity
Positivity: 7-day average positivity, %
7-day average Daily values Cases: 7-day average cases per million
20.0% Hosp. rate: 7-day average hospitalization rate, %
Deaths: 7-day average deaths per million
15.0%
Current: 31.2%
Positivity, % 10.0%
Positivity: 33.5%
Cases: 2,229.4
5.0% Hosp. rate: 15.0%
Deaths: 8.9
0.0%
11/2 11/16 11/30 12/14 12/28 1/11 1/25
1000
800
Positivity: 27.4%
600
Cases: 1,168.7
Daily cases 400 Hosp. rate: 15.5%
Deaths: 7.4
per million 200
Current: 1,471.3
0
11/2 11/16 11/30 12/14 12/28 1/11 1/25 Positivity: 36.0%
Positivity: 36.2%
Cases: 1,500.4
Cases: 1,670.5
Hosp. rate: 20.0%
Hosp. rate: 20.1%
Deaths: 5.0
Deaths: 7.2
20% Positivity: 33.3%
Cases: 1,854.6 Positivity: 28.7%
15%
Daily Current: 21.4%
Hosp. rate: 27.1%
Deaths: 9.3
Cases: 1,360.4
10% Hosp. rate: 21.6%
hospitalization Deaths: 7.5
5%
rate, % Positivity: 34.8%
Cases: 1,502.9
0% Positivity: 36.5%
Hosp. rate: 23.5% Cases: 1,681.5
11/2 11/16 11/30 12/14 12/28 1/11 1/25
Deaths: 7.8 Hosp. rate: 26.0%
Source: https://mistartmap.info/ Deaths: 5.7
Prevent Death and Severe Keep Vital Infrastructure
Current Trends and Projections Protect Healthcare Capacity 4
Outcomes Functioning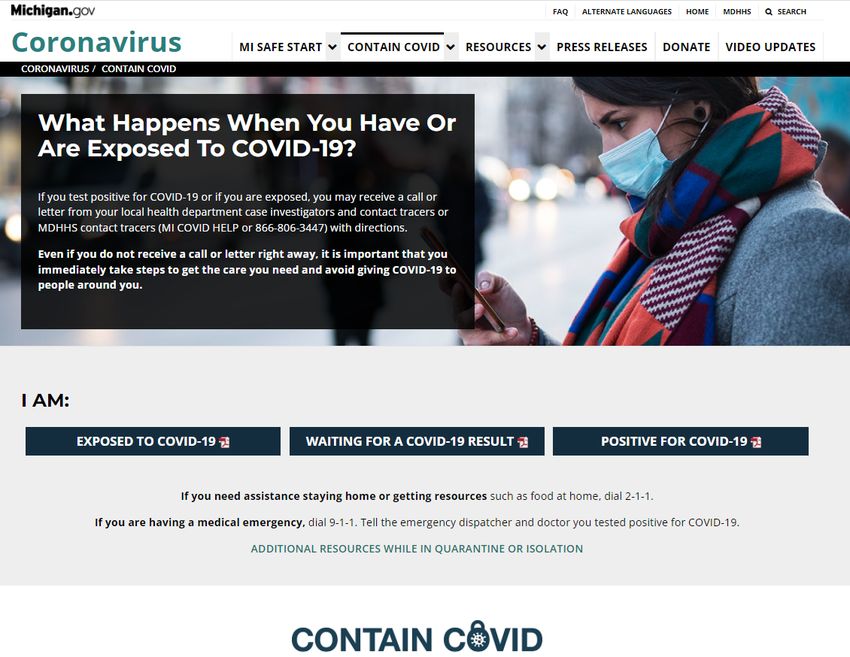
Case Rate Trends by Emergency Preparedness Region
  Daily new confirmed and probable cases per million by Region (7-day rolling average)
  2500                Region 1                   Region 3                  Region 7
                      Region 2N                  Region 5                  Region 8                                            Region 2N
                      Region 2S                  Region 6

  2000
                                                                                                                               Region 3

                                                                                                                                Region 6
  1500                                                                                                                           Region 8

  1000

     500

        0
            7/1                            8/1                              9/1         10/1           11/1             12/1                1/1

 •      Case rate trends for most preparedness regions plateaued the past week
 •      Regions 2N and 2S are declining whereas Region 8 (upper peninsula) is increasing
 •      Case rates are highest in Region 3, followed by Region 6, and then Regions 8, 2N, and 1
     Note: Case information sourced from MDHHS and reflects date of onset of symptoms
     Source: MDHHS – Michigan Disease Surveillance System

                                                                 Prevent Death and Severe                                        Keep Vital Infrastructure
Current Trends and Projections                                                                 Protect Healthcare Capacity                                   5
                                                                        Outcomes                                                       Functioning
Case Rate Trends by Emergency Preparedness Region
  Daily new confirmed and probable cases per million by Region (7-day rolling average)
                      Region 1                   Region 3                   Region 7
     2500             Region 2N                  Region 5                   Region 8
                      Region 2S                  Region 6
                                                                                                                                                                Region 2N
     2000

     1500                                                                                                                                                           Region 2S

                                                                                                                                                               Region 8
     1000

      500

          0
              3/1     4/1      5/1       6/1      7/1       8/1       9/1      10/1     11/1   12/1   1/1   2/1    3/1   4/1   5/1   6/1   7/1   8/1   9/1   10/1     11/1   12/1   1/1
 •      Case rate trends for most preparedness regions are plateaued the over the last week, with declining case rates in 2N and
        2S and increasing case rates in R8

     Note: Case information sourced from MDHHS and reflects date of onset of symptoms
     Source: MDHHS – Michigan Disease Surveillance System

                                                                  Prevent Death and Severe                                                              Keep Vital Infrastructure
Current Trends and Projections                                                                                    Protect Healthcare Capacity                                             6
                                                                         Outcomes                                                                             Functioning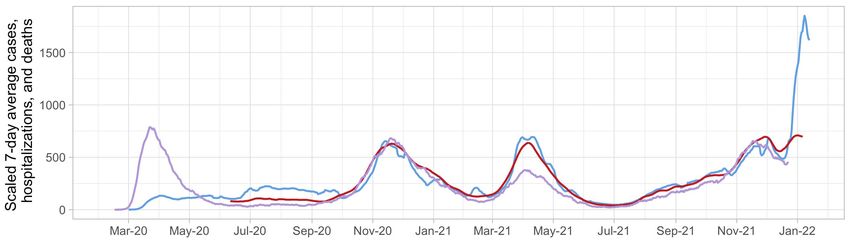
Recent trends: Case Rates                        Recent trends: % IP Hospitalization

   Detroit
   Region

                                                                                                                                   All charts
                                                                                                                                   represent
                                                                                                                                   data from
                                                                                                                                   10/17/21 –
                                                                                                                                    01/23/22
   Upper
   Peninsula
   Region

    •     Case rate trends for most MERC regions saw increases over the past week and are expected to increase
    •     Case rates for Detroit MERC Region are plateauing while case rates are increasing in other MERC Regions (through 1/7)
    •     Case rates are highest in Region 2N (1,798.3 cases/million)

Source: MI Start Map; MDOC excluded

                                           Prevent Death and Severe                                               Keep Vital Infrastructure
 Current Trends and Projections                                              Protect Healthcare Capacity                                      7
                                                  Outcomes                                                              Functioning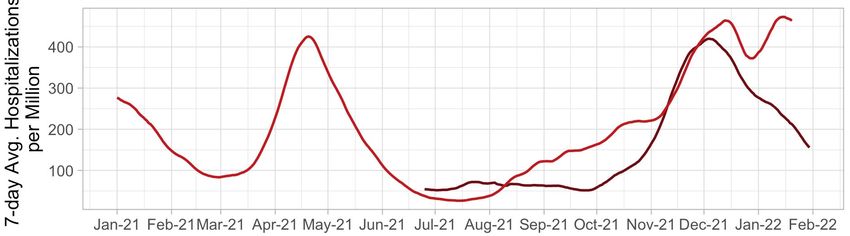
Recent trends: Case Rates                Recent trends: % IP Hospitalization

 Jackson
 Region

                                                                                                                 All charts
 Grand                                                                                                           represent
 Rapids                                                                                                          data from
 Region                                                                                                          10/17/21 –
                                                                                                                  01/23/22

 Kalamazoo
 Region

 Source: MI Start Map; MDOC excluded

                                       Prevent Death and Severe                                 Keep Vital Infrastructure
Current Trends and Projections                                    Protect Healthcare Capacity                               8
                                              Outcomes                                                Functioning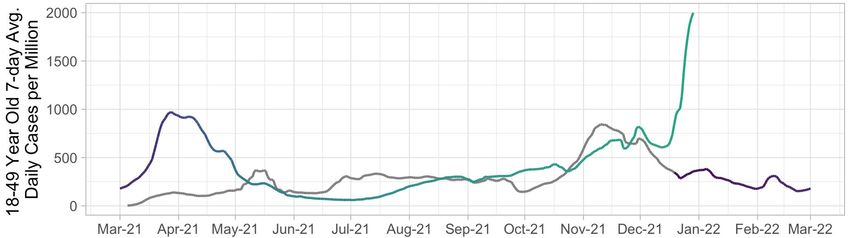
Recent trends: Case Rates                Recent trends: % IP Hospitalization

 Saginaw
 Region

                                                                                                                 All charts
 Lansing                                                                                                         represent
 Region                                                                                                          data from
                                                                                                                 10/17/21 –
                                                                                                                  01/23/22

 Traverse
 City Region

 Source: MI Start Map; MDOC excluded

                                       Prevent Death and Severe                                 Keep Vital Infrastructure
Current Trends and Projections                                    Protect Healthcare Capacity                               9
                                              Outcomes                                                Functioning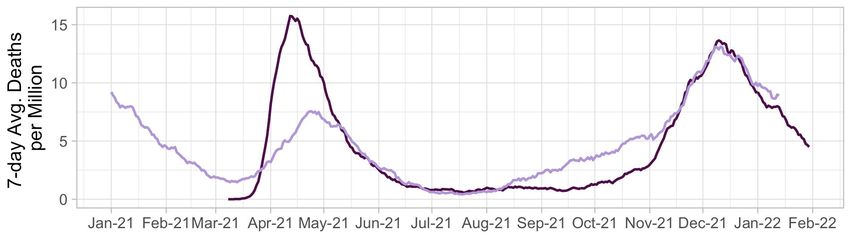
Case Rate Trends by Age Group
  Daily new confirmed and probable cases per million by age group (7-day rolling average)
                                                                                                                                                         20-29
     3000                    0-9                 30-39              60-69         Age     Rate         % change
                             10-19               40-49              70-79
                                                                                  0-9     1,326.1          -2%                                          30-39
                             20-29               50-59              80+
     2500
                                                                                  10-19   1,923.9          -11%                                      40-49
                                                                                  20-29   1,786.0          -34%
                                                                                                                                                      10-19
     2000
                                                                                  30-39   2,038.6          -19%
                                                                                  40-49   1,729.5          -20%
     1500
                                                                                  50-59   1,341.4          -23%
                                                                                  60-69    968.4           -14%
     1000
                                                                                  70-79    756.9           -11%
                                                                                  80+      700.5           -9%
      500

          0
              7/1                            8/1                              9/1                   10/1               11/1                 12/1                1/1

 •      Case rate trends for most age groups saw decreases increases over the past week
 •      Case rates by onset date for all age groups are between 700 and 2,040 cases per million (through 1/17)
 •      Case counts and case rates are highest for 30-99-year-olds this week
     Note: Case information sourced from MDHHS and reflects date of onset of symptoms
     Source: MDHHS – Michigan Disease Surveillance System

                                                                 Prevent Death and Severe                                                          Keep Vital Infrastructure
Current Trends and Projections                                                                                Protect Healthcare Capacity                                    10
                                                                        Outcomes                                                                         Functioning
Vaccine
Cases: 5-17 year olds
Year-over-year Omicron coverage
comparisons by Delta
age group Alpha
Year 2
• All age groups are Year 1 First wave
2020 Holiday wave
seeing their highest
case rates of the entire Cases: 18-49 year olds
pandemic Omicron
• Vaccine coverage is
Alpha
lower among younger
Delta
age groups compared
to middle and older Year 2
age groups Year 1 First wave 2020 Holiday wave
• Older age groups have Cases: 80+ year olds
higher vaccine
coverage and relatively
lower case rates in the
Omicron
second year of the First wave
pandemic 2020 Holiday wave
Source: MDSS and MCIR data. Note that the Year 2 Delta
vaccine age groups shown as colors in this plot
Year 1 Alpha
are 5-19, 20-49, and 75+.Case Rates by Reported Racial and Ethnic Group
Daily new confirmed and probable cases per million Daily new confirmed and probable cases per
(7 day rolling average) by race category million (7 day rolling average) by ethnicity category
American Indian/Alaska Native Black/African American Hispanic or Latino Not Hispanic or Latino
2000 Asian/Pacific Islander White 2000
Race Case Rate Race Case Rate
American Indian/ 1,142.0 Hispanic/Latino 1,093.7
1500 Alaskan Native 1500 Non-Hispanic 852.7
Asian/Pacific Islander 823.7
Black/African American 788.5
1000 White 901.0 1000
500 500
0 0
7/1 8/1 9/1 10/1 11/1 12/1 1/1 7/1 8/1 9/1 10/1 11/1 12/1 1/1
Updates since last week:
• Cases per million are decreasing for nearly all reported racial and ethnic groups and are highest for American Indian and Alaskan Native
• The difference between Hispanic/Latino and non-Hispanic is widening which may reflect differences in exposure settings
• In the past 30 days, 31% (↔) of race data and 41% (↓1%) ethnicity data was either missing or reported as unknown
Note: Case information sourced from MDHHS and reflects date of death of confirmed and probable cases.
Source: MDHHS – Michigan Disease Surveillance System
Prevent Death and Severe Keep Vital Infrastructure
Current Trends and Projections Protect Healthcare Capacity 12
Outcomes FunctioningIdentified COVID-19 Cases Caused by Variants of Concern (VOC) in
US and Michigan
SARS-CoV-2 Variants Circulating in the Variants of Concern in Michigan, Jan 24
United States, Jan 16 – Jan 22 (NOWCAST)
• CDC reclassifies variants as
epidemiology shifts
• Variants are downgraded when
there has been a significant and
sustained reduction in
Currently, CDC is reporting prevalence, or variant no longer
rapid increase in prevalence poses significant risk to public
of B.1.1.529 (i.e., Omicron) health
over past 8 weeks • Cumulative numbers of Delta
are no longer included in county
counts; solely counts of Omicron
cases are listed here
116 Omicron cases in Wayne County attributed to Detroit City
Variant MI Reported Cases # of Counties MDHHS VOC Sequenced Prev. ¶
B.1.617.2 (delta) 30,841 83 2.7%
Data last updated Jan 24, 2022
Source: MDSS B.1.1.529 (omicron) 1,541 60 97.3%
¶ Sequence specimens are from the most recent week by onset date which may change as more specimens are sent in
Prevent Death and Severe Keep Vital Infrastructure
Current Trends and Projections Protect Healthcare Capacity
Outcomes FunctioningCases 2020 2021
Omicron (B.1.1.529) Wave
Year-over-year
comparisons: Alpha (B.1.1.7) wave
cases and Delta (B.1.617.2) wave
hospitalizations
2020 Holiday wave
are higher than First wave
last year Hospitalizations 2020 2021 Omicron
Alpha
• Cases are showing a Delta
sharp increase 2020 Holiday
compared to last year wave
• Hospitalizations are
higher than last year Deaths 2020 2021
First wave
• Deaths are currently
slightly higher than Delta
last year 2020 Holiday
Alpha
wave
Source: MDSS and EM Resource dataCases, hospitalizations and deaths change together—but lagged by up to 3
weeks
• Because deaths lag cases, we will not be able to tell whether deaths will follow the case trends for another
week or so
• Hospitalizations appear to be following case trends thus far, although some signs of potentially fewer
hospitalizations per case in this wave
Cases per million
1.5x Hospitalizations per million – shifted 2 weeks
50x Deaths per million – shifted 3 weeks
Source: MDSS and EM Resource data
Prevent Death and Severe Keep Vital Infrastructure
Current Trends and Projections Protect Healthcare Capacity
Outcomes FunctioningWhere are we headed: models project further increases in cases,
hospitalizations, and deaths for Michigan
Weekly Cases Weekly Hospitalizations Weekly Deaths
• Updated Model Scenarios (Round 12)
• Suggest we are near or at peak levels
for all three metrics
• Deaths appear more consistent with Pessimistic
the more pessimistic scenarios so far
• Round 11 projections are similar, but
suggest potential for 1-2 additional
weeks to peak for hospitalizations and
deaths in the more pessimistic
scenarios
• All projections suggest that cases, Optimistic
hospitalizations and deaths will still
be high over the coming weeks, even
Sep 2021 Nov 2021 Jan 2021 Mar 2021 Sep 2021 Nov 2021 Jan 2021 Mar 2021 Sep 2021 Nov 2021 Jan 2021 Mar 2021
if declining
Source: COVID Modeling Scenario Hub. Uncertainty levels: 50%
Prevent Death and Severe Keep Vital Infrastructure
Current Trends and Projections Protect Healthcare Capacity
Outcomes FunctioningAverage and total new deaths, by age group
Daily COVID-19 deaths in confirmed and probable cases per million by age group (7 day rolling average)
200 0-19 40-49 70-79
20-29 50-59 80+
30-39 60-69 Statewide
150
100
50
0
3/1 4/1 5/1 6/1 7/1 8/1 9/1 10/1 11/1 12/1 1/1 2/1 3/1 4/1 5/1 6/1 7/1 8/1 9/1 10/1 11/1 12/1 1/1
• Deaths are a lagging indicator
• Through 1/17, the 7-day avg. death rate is 50 daily deaths per million people for those over the age of 80
• Deaths rates have decreased over the last week for most age groups
Note: Death information sourced from MDHHS and reflects date of death of confirmed and probable cases.
Source: MDHHS – Michigan Disease Surveillance System (MDSS)
Prevent Death and Severe Keep Vital Infrastructure
Current Trends and Projections Protect Healthcare Capacity 17
Outcomes Functioning30-day rolling average daily deaths per million people by race and
ethnicity
Average daily deaths per million people by race Average daily deaths per million people by ethnicity
15 American Indian/Alaska Native Black/African American 15 Hispanic or Latino Not Hispanic or Latino
Asian/Pacific Islander White
12 12
9 9
6 6
3 3
0 0
7/1 8/1 9/1 10/1 11/1 12/1 1/1 7/1 8/1 9/1 10/1 11/1 12/1 1/1
• Deaths are lagging indicator of other metrics
• Trends for daily average deaths are decreasing for all reported races and ethnicities
• Currently, Whites have the highest death rate (8.4 deaths/million)
Note: Death information sourced from MDHHS and reflects date of death of confirmed and probable cases.
Source: MDHHS – Michigan Disease Surveillance System
Prevent Death and Severe Keep Vital Infrastructure
Current Trends and Projections Protect Healthcare Capacity 18
Outcomes FunctioningReported Outbreaks within Long Term Care Facilities: Adult Foster Care,
Homes for the Aged, and Skilled Nursing Cases
Number of AFC/HFAs with 3 or more Confirmed Cases Number of SNFs with 3 or more Confirmed Cases
120 120
100 100
Number of Facilities
80 80
Number of Facilities
60 60
40 40
20 20
0 0
3/24 4/24 5/24 6/24 7/24 8/24 9/24 10/24 11/24 12/24 3/26 4/26 5/26 6/26 7/26 8/26 9/26 10/26 11/26 12/26 1/26
• The number of Long-Term Care Facilities reporting 3 or more cases within a single reporting period increased in both AFC/HFA (48, down
from 54 last week) and SNF (106, down from 111 last week) in most recent data
COVID-19 outbreaks within Long-Term Care Facilities are defined as three or more cases with an epidemiological linkage by place and time indicating a shared exposure outside of a household
(https://www.michigan.gov/coronavirus/0,9753,7-406-98163_98173_102057---,00.html and https://www.michigan.gov/coronavirus/0,9753,7-406-98163_98173-526911--,00.html)
The data is from w eekly reporting by facilities w ith bed occupancy of at least 13 beds.
Prevent Death and Severe Keep Vital Infrastructure
Current Trends and Projections Protect Healthcare Capacity 19
Outcomes FunctioningReported Cases within Long Term Care Facilities: Adult Foster Care, Homes
for the Aged, and Skilled Nursing Cases for Residents and Staff
STATE OF MICHIGAN WEEKLY TOTAL CONFIRMED COVID-19 CASES IN STATE OF MICHIGAN WEEKLY TOTAL CONFIRMED COVID-19 CASES IN SNF
AFC/HFA RESIDENTS AND STAFF RESIDENTS AND STAFF
03/24/2021 TO 01/19/2022 03/26/2021 TO 01/21/2022
1000 1800
900 1600
800 1400
Number of Cases
Number of Cases
700 1200
600
1000
500
800
400
600
300
400
200
100 200
0 0
3/24 4/23 5/23 6/22 7/22 8/21 9/20 10/20 11/19 12/19 1/18 3/26 4/26 5/26 6/26 7/26 8/26 9/26 10/26 11/26 12/26 1/26
Weekly Total Confirmed Cases Resident Weekly Total Confirm Cases Staff Weekly Total Confirmed Cases Resident Weekly Total Confirm Cases Staff
• Case counts in staff are coming down off of a peak (1,779 last week to 1,564 this week in SNFs) and 661 cases in AFC/HFA staff (868 last week)
• Case counts in LTCF continue to record more cases among staff than residents, but resident cases increasing sharply
The data is from w eekly reporting by facilities w ith bed occupancy of at least 13 beds.
Prevent Death and Severe Keep Vital Infrastructure
Current Trends and Projections Protect Healthcare Capacity 20
Outcomes FunctioningReported Staff Shortages within Skilled Nursing Facilities
SNF STAFFING SHORTAGE
& CASE COUNT (01/21/2022)
Proportion of SNFs reporting Staffing
50%
40%
Shortage
30%
20%
10%
0%
3/26 4/26 5/26 6/26 7/26 8/26 9/26 10/26 11/26 12/26 1/26
AIDE NURSE
• More Skilled Nursing Facilities (SNF) in Michigan are reporting staff shortages now than ever previously reported during the pandemic
• 42% of SNF report staffing shortages for aides
• 38% of SNF report staffing shortages for nurses
These data are from w eekly reporting by facilities w ith bed occupancy of at least 13 beds.
Prevent Death and Severe Keep Vital Infrastructure
Current Trends and Projections Protect Healthcare Capacity 21
Outcomes FunctioningCompleted vaccination among Skilled Nursing Cases for Residents and Staff
85.9% of SNF residents are fully vaccinated; 38 of 53 72.7% of SNF staff are fully vaccinated, 48 of 53 states/territories
states/territories 5.3% on SNF staff have initiated primary series
https://data.cms.gov/covid-19/covid-19-nursing-home-data
https://www.cdc.gov/nhsn/covid19/ltc-vaccination-dashboard.html
Prevent Death and Severe Keep Vital Infrastructure
Current Trends and Projections Protect Healthcare Capacity
Outcomes FunctioningAverage Hospital Admissions Are Increasing for all Age Groups
• Trends for daily average hospital admissions declined (-10%) since last week (vs. -1% prior week)
• Overall, many age groups saw declines or plateaus this week
• More than 70 daily hospital admissions was seen for each of the age groups of 50-59, 60-69, 70-79, and 80+
Source: CHECC & EM Resource
Prevent Death and Severe Keep Vital Infrastructure
Current Trends and Projections Protect Healthcare Capacity 23
Outcomes FunctioningHospital Admissions and Admission Rates by Age Group
Daily new hospital admission per million by age group (7 -day rolling average)
Age Average† daily Average† Daily One Week • Through Jan 24, there were an average of 500.7
Group number of hospital Hospital % Change (Δ #) hospital admissions per day due to COVID-19; a
admissions Admission Rate* decrease from last week (-10%, -53)
0-11 17.0 12.2 +0% (+0) • Most age groups saw plateaus or decreases this week
12-17 6.4 8.5 +5% (+Statewide Hospitalization Trends: Total COVID+ Census
Hospitalization Trends 3/1/2021 – 1/24/2022 The COVID+ census in hospitals has
Confirmed Positive & Persons Under Investigation (PUI) decreased 12% from last week.
4675
Confirmed Positive
Hospitalized COVID Positive Long Term
Trend (beginning March 2020)
4675
PUI
25Statewide Hospitalization Trends: Regional COVID+ Census
COVID+ hospital census has plateaued or decreased
Hospitalization Trends 7/1/2021 – 1/24/2022 in nearly all regions. Regions 6 and 7 are the only
Confirmed Positive by Region regions showing growth this week. Regions 2N and
2S, which drove the majority of the January
Region 1 increase, have a significant decreasing trend.
Region 2N
Region 2S
Region 3 Regions 2N, 2S, and 3 have greater than 400/Million
Region 5
Region 6 population hospitalized with COVID.
Region 7
Region 8 Region COVID+ Hospitalizations COVID+
(% Δ from last week) Hospitalizations /
MM
Region 1 359 (-6%) 332/M
Region 2N 965 (-23%) 436/M
Region 2S 1160 (-16%) 521/M
Region 3 531 (-5%) 468/M
Region 5 304 (-2%) 319/M
Region 6 520 (2%) 354/M
Region 7 121 (5%) 242/M
Region 8 74 (-4%) 238/M
26Statewide Hospitalization Trends: ICU COVID+ Census
The census of COVID+ patients in ICUs has
Hospitalization Trends 3/1/2021 – 1/24/2022
decreased by 6% from last week. Region 6 and 7 are
Confirmed Positive in ICUs
the only regions showing growth this week with
Region 7 showing 24% growth.
Regions 2S, 3 and 6 have ICU occupancy greater
than 85%. Regions 1, 2S, 3, and 6 have 30% or more
of adult ICU beds filled with COVID+ patients.
Region Adult COVID+ in Adult ICU % of Adult ICU
ICU (% Δ from Occupancy beds COVID+
last week)
Region 1 69 (0%) 82% 33%
Region 2N 148 (-17%) 77% 26%
Region 2S 220 (0%) 86% 32%
Confirmed
Region 3 97 (-16%) 90% 30%
Positive in ICU
Region 5 43 (-12%) 65% 24%
Region 6 104 (2%) 87% 39%
Region 7 36 (24%) 83% 26%
Region 8 16 (-6%) 75% 25%
27Statewide Hospitalization Trends: Pediatric COVID+ Census
Hospitalization Trends 1/1/2021 – 1/24/2022
Pediatric Hospitalizations, Confirmed
28CDC Report – Booster dose is highly effective against Omicron.
CDC study of 222,772
emergency department and
urgent care visits and 87,904
hospitalizations.
Vaccine effectiveness was most
protective against omicron
emergency dept, urgent care
visit, or hospitalization after 2
doses plus a booster dose.
Protection was lowest in people
eligible for a booster but who had
not received it yet.
Thompson MG, Natarajan K, Irving SA, et al. Effectiveness of a Third Dose of mRNA Vaccines Against COVID-19–Associated Emergency Department and Urgent Care Encounters and
Hospitalizations Among Adults During Periods of Delta and Omicron Variant Predominance — VISION Network, 10 States, August 2021–January 2022. MMWR Morb Mortal Wkly Rep. ePub: 21
January 2022. DOI: http://dx.doi.org/10.15585/mmwr.mm7104e3
Prevent Death and Severe Keep Vital Infrastructure
Current Trends and Projections Protect Healthcare Capacity
Outcomes FunctioningRates of laboratory-confirmed COVID-19 hospitalizations by
vaccination status: COVID-Net
Prevent Death and Severe Keep Vital Infrastructure
Current Trends and Projections Protect Healthcare Capacity 30
Outcomes FunctioningPreventing Severe Disease - Vaccine leads to better outcomes in
breakthrough hospitalizations
US study across 21 locations of 4,513 adults hospitalized with COVID-19 respiratory illness from March-August
2021. Vaccinated patients are less likely to require a ventilator or die during hospitalization.
Source: Tenforde et al. JAMA. 2021;326(20):2043-2054. doi:10.1001/jama.2021.19499
Prevent Death and Severe Keep Vital Infrastructure
Current Trends and Projections Protect Healthcare Capacity
Outcomes FunctioningMitigation important in preventing breakthrough infections
in individuals with chronic conditions
CDC analysis of data from 465 health systems. Severe
breakthrough infections most common in:
• Older than 65 years of age
• Those with chronic disease (liver, kidney, neurologic,
cardiac disease)
• Those with diabetes
No severe outcomes observed in those who received
monoclonal antibodies
Severe outcomes were more likely as the number of
risk factors increased
Important to use prevention tools in addition to
vaccination (masking, testing, distancing, etc.)
Yek et al. CDC MMWR. January 7, 2022 / 71(1);19-25 DOI: http://dx.doi.org/10.15585/mmwr.mm7101a4
Prevent Death and Severe Keep Vital Infrastructure
Current Trends and Projections Protect Healthcare Capacity
Outcomes FunctioningCumulative COVID-19 Cases by Vaccination Status, Michigan, 1/15/21–1/14/22
Fully Vaccinated People (5,405,380)
Cases Hospitalization Deaths
Percent of Cases In People Not Percent of Hospitalizations In People Percent of Deaths In People Not
Fully Vaccinated Not Fully Vaccinated Fully Vaccinated
(1,007,888 / 1,298,080) (24,506 / 28,844) (12,635 /15,198)
77.6% 85.0% 83.1%
1,007,888 24,506 12,635
Total Cases Not Fully Vaccinated Total Hospitalized Not Fully Vaccinated Total Deaths Not Fully Vaccinated
Total Breakthrough Cases Total Breakthrough Hospitalizations Total Breakthrough Deaths
290,192 4,338 2,563
5.37% 0.080% 0.047%
Percent of Fully Vaccinated People who Percent of Fully Vaccinated People Who Were Percent of Fully Vaccinated People Who Died of
Developed COVID-19 (290,192 / 5,405,380) Hospitalized for COVID-19 (4,338 / 5,405,380) COVID-19 (2,563 / 5,405,380)
22.4% 15.0% 16.9%
Percent of Cases Who Were Fully Vaccinated Percent of Hospitalizations Who Were Fully Percent of Deaths Who Were Fully Vaccinated
(290,192 / 1,298,080) Vaccinated (4,338 / 28,844) (2,563 / 15,198)
Total Cases: 1,298,080 Total Hospitalizations: 28,844 Total Deaths: 15,198
Michigan Disease Surveillance System may underestimate the frequency of COVID-19 hospitalizations:
- Case investigation and follow-up is more difficult for individuals who get hospitalized (e.g., they are too ill to speak to investigators, don’t answer their phone, or otherwise).
- These hospitalizations include individuals who are hospitalized for issues other than COVID19 (the same as breakthrough COVID-19).
- Individuals who get hospitalization will lag after infection and may occur after case investigation.
Prevent Death and Severe Keep Vital Infrastructure
Current Trends and Projections Protect Healthcare Capacity
Outcomes FunctioningNational Age-Standardized Rates of COVID-19 Cases and Deaths by `
Vaccination Status
Footnotes: Incidence rates were age-standardized using the 2000 U.S. Census standard population; and rates are not adjusted for time since vaccination, underlying conditions, or other demographic factors
besides age. Incidence rate ratios for the past one month were calculated by dividing the average weekly incidence rates among unvaccinated people by that among fully vaccinated people.
Prevent Death and Severe Keep Vital Infrastructure
Current Trends and Projections Protect Healthcare Capacity
Outcomes FunctioningMichigan Age-Standardized Rates of COVID-19 Cases and Deaths by `
Vaccination Status
In November, unvaccinated persons had:
3.6 X AND 10.9 X
Risk of Testing Positive for COVID-19 Risk of Dying from COVID-19
compared to fully vaccinated persons
Footnotes: Incidence rates were age-standardized using the 2000 U.S. Census standard population; and rates are not adjusted for time since vaccination, underlying conditions, or other demographic factors
besides age. Incidence rate ratios for the past one month were calculated by dividing the average weekly incidence rates among unvaccinated people by that among fully vaccinated people.
Prevent Death and Severe Keep Vital Infrastructure
Current Trends and Projections Protect Healthcare Capacity
Outcomes FunctioningNational Age-Standardized Rates of COVID-19 Cases and Deaths by `
Vaccination + Booster Status
Footnotes: Incidence rates were age-standardized using the 2000 U.S. Census standard population; and rates are not adjusted for time since vaccination, underlying conditions, or other demographic factors
besides age. Incidence rate ratios for the past one month were calculated by dividing the average weekly incidence rates among unvaccinated people by that among fully vaccinated people.
Prevent Death and Severe Keep Vital Infrastructure
Current Trends and Projections Protect Healthcare Capacity
Outcomes FunctioningMichigan Age-Standardized Rates of COVID-19 Cases and Deaths by `
Vaccination + Booster Status
In November, unvaccinated adults aged 18 years and older had:
11.7 X AND 59.2 X
Risk of Testing Positive for COVID-19 Risk of Dying from COVID-19
compared to fully vaccinated adults with booster doses
Footnotes: Incidence rates were age-standardized using the 2000 U.S. Census standard population; and rates are not adjusted for time since vaccination, underlying conditions, or other demographic factors
besides age. Incidence rate ratios for the past one month were calculated by dividing the average weekly incidence rates among unvaccinated people by that among fully vaccinated people.
Prevent Death and Severe Keep Vital Infrastructure
Current Trends and Projections Protect Healthcare Capacity
Outcomes FunctioningHospital, ICU, Ventilator Utilization, and Staffing Trends
Available hospital beds A C
Available ICU beds A
Occupied hospital beds Occupied ICU beds
B
• Utilization for hospitals, ICUs, and mechanical ventilators are mixed (Ventilators not shown)
• The number of available hospital and ICU beds is decreasing (shown in A)
• Compared to this time last year, we currently have 1,110 less staffed beds this year (5% decrease)
• Compared to this time last year, we currently have 250 fewer ICU staffed beds this year (9% decrease)
• At the start of the current Omicron surge, we have already peaked for COVID hospitalizations (shown in B) and near peak
for ICU; these numbers are expected to rise
• Sufficient staffing remains the most critically limited resource within healthcare, and is at a pandemic high (shown at C)
Source: EM Resource
Prevent Death and Severe Keep Vital Infrastructure
Current Trends and Projections Protect Healthcare Capacity
Outcomes FunctioningMichigan Strategy to Allocate Federal Staffing Resources
The regional strategy addresses:
COVID hotspots
Challenges with increased admissions • North Central has seen an elevated level of COVID
cases and hospitalizations.
Facilitating regional decompression and patient transfers
• DoD team allocated to Covenant Saginaw in R3
• Facilities provide for regional decompression
allowing for transfers of patients from outlying
areas to the appropriate level of care.
• The West side of the state saw the
highest initial COVID burden in the
current surge. • SE Michigan increased hospitalizations in the
current surge and is now experiencing the highest
• DoD teams allocated to Spectrum number of cases and positivity in the state.
and Mercy Muskegon in R6
• DoD team allocated to Beaumont Dearborn in
R2S
• DoD team allocated to Sparrow
• Disaster Medical Assistance Team (DMAT) assigned
• Team will arrive the first week of Feb.
to Henry Ford – Wyandotte in R2S
• Current requests fulfills a second facility in R1
• An additional DoD will backfill the DMAT Team
after their 14-day deployment is complete
Source: Emergency Preparedness and Response
Prevent Death and Severe Keep Vital Infrastructure
Current Trends and Projections Protect Healthcare Capacity 39
Outcomes FunctioningOmicron transmissibility
• Omicron transmissibility is higher than Delta and Alpha.
• Outbreaks more likely to link across populations.
• Secondary attack rate (the chance that an exposed person becomes positive) is
50% more for Omicron vs Delta – WHO technical brief
Prevent Death and Severe Keep Vital Infrastructure
Current Trends and Projections Protect Healthcare Capacity
Outcomes FunctioningIncreased transmissibility leads to spread
between communities
• •Sports outbreak impacted 67 people
across 3 high schools, one middle
school.
• •Spread connected to one daycare
• •Began after the introduction of the
alpha variant.
• •Reported by Detroit Free Press - A
look at the largest COVID-19 youth
Image: Detroit Free Press
sports outbreaks this year
Prevent Death and Severe Keep Vital Infrastructure
Current Trends and Projections Protect Healthcare Capacity
Outcomes FunctioningCOVID-19 surge and impact on workforce
8.7 million Americans weren't working in December or early January due to COVID-19 illness or caring for someone who
was infected.
5.3 million Americans were caring for children who were home from school or childcare.
Census Bureau's
Household Pulse
survey. Reported by New
York Times Graph Source - Twitter: @bencasselman
Prevent Death and Severe Keep Vital Infrastructure
Current Trends and Projections Protect Healthcare Capacity
Outcomes FunctioningVital Infrastructure: K-12 school clusters and outbreaks, week ending Jan 20
Number of reported outbreaks/clusters increased since last week (242 to 309), with increases in Pre K-Elementary (122 to 155), and High
Schools (73 to 96), and Middle/Jr High (46 to 57). Administration remained steady (at 1).
Number of Range of cases
Region Number of reported cases, # # Ongoing - Excluding New # New outbreaks per outbreak
Region 1 413 133 62 3-34
Region 2n 338 0 13 3-63
Region 2s 94 73 23 3-19
Region 3 2,809 246 116 3-108
Region 5 43 77 23 3-14
Region 6 60 45 22 3-13
Region 7 207 42 15 2-87
Region 8 177 188 35 3-54
Total 4,141 804 309 2-108
Number of Range of cases
Grade level Number of reported cases, # # Ongoing - Excluding New # New outbreaks per outbreak
Pre-school - elem. 1,451 366 155 3-62
Jr. high/middle school 824 207 57 3-74
High school 1,859 231 96 2-108
Administrative 70 1 7
Total 4,141 804 309 2-108
Many factors, including the lack of ability to conduct effective contact tracing in certain settings, may result in significant underreporting of outbreaks. This chart does not provide a complete picture of outbreaks in
Michigan and the absence of identified outbreaks in a particular setting in no way provides evidence that, in fact, that setting is not having outbreaks.
NOTE (10/4): MDHHS adopted the new CSTE school cluster and outbreak definition which impacts how transmissions within school-sponsored settings are reported to the health department
Source: LHD Weekly Sitreps
Prevent Death and Severe Keep Vital Infrastructure
Current Trends and Projections Protect Healthcare Capacity 43
Outcomes FunctioningCase rates in the school-aged (5-18y) population statewide and by district
• Case rates in 5–18-year-olds have recently increased more rapidly, becoming more similar to 19–50-year-olds
• Case rates are currently highest among high school (15-18) and middle school (12-14) aged populations, followed by elementary
school aged populations (5-11) 7-day avg. cases per
1000 enrolled population: 0-1 1-5 5-10 10-20 20-50 >50
Age groups
Age groups
Sources: MDSS case data as of 1/21/2022 (data through 1/14/22), line charts use statewide age group population, map uses ISD enrolled populations from EOG mask tracker data.Moving forward key public health strategies should include:
Reduced utility and feasibility of universal case
investigation and contact tracing for each COVID-19 1. Increasing number of people up to date with
case due to: vaccinations
1. Large number of asymptomatic and less severe 2. Strong messaging about effective mask wearing,
cases. especially during increased community transmission
2. Many infections are never identified by public 3. Targeting prevention strategies to the most vulnerable
health agencies. persons, populations, and settings
3. Highest risk of transmission occurs prior to 4. Testing as a risk mitigation strategy in congregate
symptom onset and during first few days of
symptomatic illness. residential settings and individual use to isolate
appropriately
4. Shorter incubation period of the Omicron variant
5. Outbreak investigations and targeted case
investigations to prevent or understand transmission in
It is appropriate for our public health agencies to high-risk settings
transition resources into more effective strategies to
lessen the impact of COVID-19 by focusing 6. Instituting and improving environmental measures to
surveillance and prevention efforts on the most reduce indoor aerosol transmission of pathogens
severe outcomes of COVID-19: hospitalizations and
deaths. It is time to empower the public to act when they suspect
Prevent Death and Severe COVID-19 infection. Keep Vital Infrastructure
Current Trends and Projections Protect Healthcare Capacity
Outcomes FunctioningCase Investigation and Contact Tracing
• Most cases and contacts are not being reached by public health
• Of 362,000+ cases reported from December 2021-early January 7, 2022:
• 4.4% had named contacts
• Of the named contacts only 26.7% were reached successfully
• Therefore, it is necessary for public to take on a larger role in understanding
what to do if feeling ill, testing positive (isolation and contact notification), or
if being notified as a contact (quarantine)
• Public Health capacity shifts to investigation and mitigation of COVID-19
outbreaks in priority settings like schools and long-term care facilities
• COVID-19 cases reported to MDHHS will be notified of their result and provided
information and education on COVID-19 infection
• Public can call the MDHHS COVID-19 Hotline at 888-535-6136 to discuss their
test result or get information on isolation/quarantine
Prevent Death and Severe Keep Vital Infrastructure
Current Trends and Projections Protect Healthcare Capacity
Outcomes FunctioningDaily Confirmed + Probable COVID Cases, Interview Attempts, and Interview Completion Volume
25000
20000
15000
10000
5000
0
1/5/2021
2/2/2021
3/2/2021
6/8/2021
7/6/2021
8/3/2021
1/4/2022
9/15/2020
9/29/2020
12/8/2020
1/19/2021
2/16/2021
3/16/2021
3/30/2021
4/13/2021
4/27/2021
5/11/2021
5/25/2021
6/22/2021
7/20/2021
8/17/2021
8/31/2021
9/14/2021
9/28/2021
11/9/2021
12/7/2021
10/13/2020
10/27/2020
11/10/2020
11/24/2020
12/22/2020
10/12/2021
10/26/2021
11/23/2021
12/21/2021
COVID Cases Interview Attempted Interview Completed
7-Day Average COVID Cases 7-Day Average Interviews Attempted 7-Day Average Interviews Completed
Prevent Death and Severe Keep Vital Infrastructure
Current Trends and Projections Protect Healthcare Capacity
Outcomes Functioning100.0% 25000
90.0%
% of Daily cases ever Attempted/Interviewed
80.0% 20000
70.0%
TOTAL Daily COVID Cases
60.0% 15000
50.0%
40.0% 10000
30.0%
20.0% 5000
10.0%
0.0% 0
Daily Total Cases % Interview Attempted (as of 01/07/2022)
7-Day Average % Interview Attempted (as of 01/07/2022) % Interview Completed (as of 01/07/2022)
7-Day Average % Interview Completed (as of 01/07/2022)
Prevent Death and Severe Keep Vital Infrastructure
Current Trends and Projections Protect Healthcare Capacity
Outcomes FunctioningPublic Guidance
• Updated Materials
• What to do if testing positive for COVID-19?
• What to do if waiting for test results?
• What to do if exposed to COVID-19?
• Best masking practices
• What to do after an at home test result?
• Coming Soon
• What does it mean to be up to date on vaccine
• Isolation and quarantine timeline/calendar
The public can call the MDHHS COVID-19 Hotline at 888-535-6136 to
discuss their test result or isolation/quarantine
Prevent Death and Severe Keep Vital Infrastructure
Current Trends and Projections Protect Healthcare Capacity
Outcomes FunctioningCase Investigation and Contact Tracing (December-January 7th)
Case Investigation and Contact Tracing Metrics Dec 2021 - Jan 2022
400000
350000
300000 Percentage of Cases Percentage of Contacts
250000
200000
150000
100000 20.1%
12.7% 100.0%
50000
4.4% 26.7%
0
Cases Cases with Cases Cases with Total Contacts Contacts with Contacts with
Interview Interviewed Contacts Elicited Documented Outreach Successful
Attempt Attempted Outreach
Prevent Death and Severe Keep Vital Infrastructure
Current Trends and Projections Protect Healthcare Capacity
Outcomes FunctioningSchools and Contact Tracing
• MDHHS K-12 guidance to have staff and students remain in the classroom if
exposed to COVID-19 is predicated on the ability to identify students and
staff exposed to COVID-19 in the school setting (i.e. contact tracing)
The change in public health
approach to case investigation
and contact tracing, in no way
modifies school reporting
requirements or the school’s
responsibility to notify exposed
persons/guardians of an
exposure to a communicable
disease in the school setting
Prevent Death and Severe Keep Vital Infrastructure
Current Trends and Projections Protect Healthcare Capacity
Outcomes FunctioningUpdates to the Contain COVID Webpage
The public can call the MDHHS COVID-19 Hotline at 888-535-
6136 to discuss their test result or isolation/quarantine
Prevent Death and Severe Keep Vital Infrastructure
Current Trends and Projections Protect Healthcare Capacity
Outcomes FunctioningTesting Framework
• Emphasis and maintenance of capacity to perform PCR
testing in traditional healthcare/laboratory settings
• MDHHS supported distribution of administered rapid
antigen tests to high priority settings (e.g. schools,
long term care, corrections, neighborhood and
community pop-up sites, etc.)
• MDHHS support for expanded distribution of At-Home
or Over-the-Counter (OTC) tests through select venues
(schools, community action agencies, libraries)
• Federal distribution of OTC Tests started January 18th :
https://www.covidtests.gov/
Prevent Death and Severe Keep Vital Infrastructure
Current Trends and Projections Protect Healthcare Capacity
Outcomes FunctioningCOVID-19 PCR Testing at an All-Time High
Prevent Death and Severe Keep Vital Infrastructure
Current Trends and Projections Protect Healthcare Capacity
Outcomes FunctioningCOVID-19 Test Type, Volume, and Positivity
Prevent Death and Severe Keep Vital Infrastructure
Current Trends and Projections Protect Healthcare Capacity
Outcomes FunctioningMDHHS Antigen Test Distirbution October 2020 - Present
1,200,000 7,000,000
Cumulative Tests Shipped
January 2021, largest number of antigen tests shipped
Monthly Tests Shipped
1,000,000 Data for January through 1/21/2021 6,000,000
800,000 5,000,000
4,000,000
600,000
3,000,000
400,000
2,000,000
200,000 1,000,000
0 0
Jul-21
Aug-21
Feb-21
Mar-21
Sep-21
Apr-21
May-21
Oct-21
Oct-20
Jan-21
Jan-22
Nov-21
Nov-20
Dec-21
Dec-20
Jun-21
Monthly Antigen Tests Distributed Cumulative Antigen Tests Distirbuted
*Excludes tests shipped for Spring 2021 School Sports Testing Mandate
Prevent Death and Severe Keep Vital Infrastructure
Current Trends and Projections Protect Healthcare Capacity
Outcomes FunctioningMDHHS Distribution of Antigen Tests
October 2020-Present Project/Facility/
Venue
Total Tests
Shipped
% of All Tests
Shipped
MDHHS Antigen Test Distribution October 2020 - Current
2.5% Long Term Care 1,881,420 26.4%
5.9%
5.4% 26.4% Schools 1,507,102 21.1%
9.5% Spring School
1,355,390 19.0%
Sports Mandate
10.4% MI Department
740,035 10.4%
of Corrections
21.1%
19.0% Local Health
674,665 9.5%
Departments
Long Term Care Schools Psych Hospitals 383,160 5.4%
Spring School Sports Mandate MI Department of Corrections MI Backpack
174,870 2.5%
Local Health Department Psych Hospitals Program
MI Backpack Program Other Other 418,850 5.9%
Other: FQHCs, Jails, Migrant Workers, Camps, Community Action Agencies,
Libraries, Shelters, Juvenile Justice Facilities TOTAL 7,135,492 100%
Prevent Death and Severe Keep Vital Infrastructure
Current Trends and Projections Protect Healthcare Capacity
Outcomes FunctioningTesting Resources in Michigan
Testing Options:
• Identify a testing location near you using the Solv website
• Identify an MDHHS supported Point of Entry/Welcome Center/Airport Testing site, or
Neighborhood or Community popup testing site
• MI Safe Schools Testing program – for schools to administer tests on site for students
and staff to ‘test to stay’
• Schools can order tests through the Mi Safer Schools: School Antigen COVID Test Ordering form
• MI Backpack Home Test Program – schools can sign up to be distributed ‘At Home’ or
‘Over-the-Counter’ Tests for students to take home for personal use
• Schools can express interest here: https://forms.office.com/g/is9FYDMRzn
• More to come as Michigan sustains and expands At Home Test distribution through
Michigan Libraries
• Order free at home tests through the federal government: https://www.covidtests.gov/
Prevent Death and Severe Keep Vital Infrastructure
Current Trends and Projections Protect Healthcare Capacity
Outcomes FunctioningVaccinations and Boosters
• Over 14.6 million COVID-19 vaccine doses have been administered in Michigan
• Over 6.5 million Michiganders have received at least one dose (65%)
• Nearly 5.8 million Michiganders have completed a primary series (58%)
• Over 2.75 million additional/booster doses have been administered in Michigan
• 47.5% of the fully vaccinated population has received a booster
• 71.4% of the fully vaccinated population 65 years of age or older has received a booster
Initiation and Completion Trends in
5–11-year-olds
https://covid.cdc.gov/covid-data-tracker/#vaccinations
https://www.michigan.gov/coronavirus/0,9753,7-406-98178_103214_103272-547150--,00.html
Prevent Death and Severe Keep Vital Infrastructure
Current Trends and Projections Protect Healthcare Capacity 60
Outcomes FunctioningTherapeutics
Antibodies AntiviralsVaccines Tests
Protect against Prevent spread
severe outcomes We encourage testing
Boosters are more before gatherings, with
important than ever, symptoms, and after
and available for exposure
individuals 12+ Protect Yourself,
Protect Your
Community
Masks, Distancing Treatment
& Ventilation Protect against
Prevent spread severe outcomes
Well-fitting, high-quality Oral antivirals and
masks in all indoor public monoclonal antibody
or crowded settings are infusions are available
more important than everYou can also read