Ethiopian Demography Excerpts from the topics listed in the content page of this online resource
←
→
Page content transcription
If your browser does not render page correctly, please read the page content below
Ethiopian Demography
 Excerpts from the topics
 listed in the content page
 of this online resource
  Citation : Aynalem Adugna
            Ethiopian Demography
  www.EthioDemographyAndHealth.Org
            Updated September 2017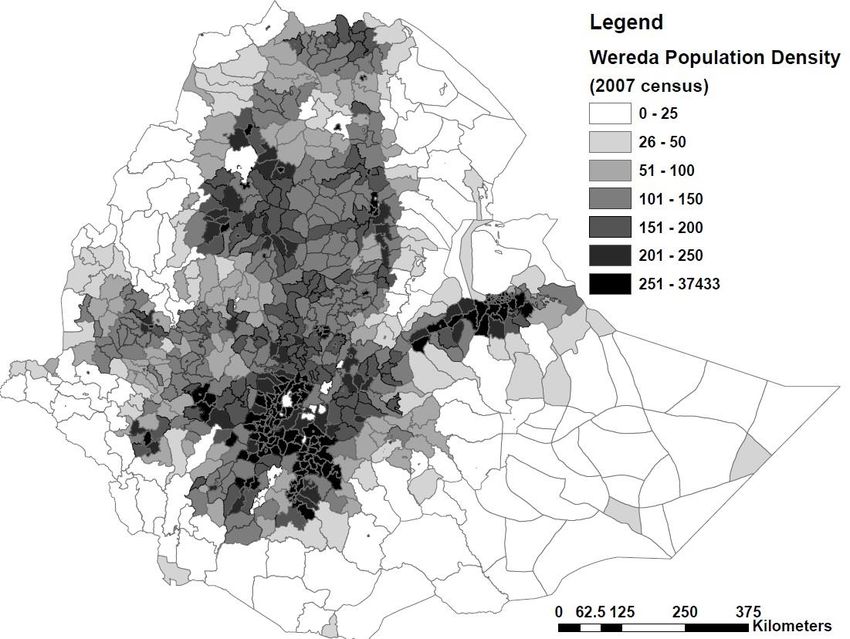
Objectives : WWW.EthioDemographyAndHealth.Org
This is an online equivalent of a “reader”. Single lines to whole
paragraphs of text are quoted/copied (with acknowledgement), as
needed, to provide a clydescope of materials and view points on
Ethiopia’s population and health. Much of the analysis is mine however,
as are most of the tables, graphs, and all but one of the population
density maps. The source codes below graphs and tables refer to the
sources of the raw data used. Topics are divided into sections, and are
presented as a single file.
I was a young graduate assistant in the Demographic Training and
Research Center (DTRC) when this work began - a couple of decades ago.
I remember my frustrations as a young aspiring teacher over inability to
access data or up-to-date analytical reports on Ethiopian population for
the ‘Ethiopian population’ chapter of AAU’s “Introduction to Ethiopian
geography” course. I decided to do something about it then and came-up
with a summary chapter addition on the population of Ethiopia, and
distributed copies to the staff of the geography department.
Twenty years later, I am engaged in the same endeavor but with a 21st
century bent. The same subject matter is addressed here with greater
detail and a promise of regular changes and constant updates reflecting
the latest additions to the knowledge of Ethiopian population - its
distribution, composition, and dynamics – and health. Aynalem Adugna.
Factors Determining the Demography of Ethiopia

                            NATURAL RESOURCES
                      PHYSICAL ENVIRONMENT
     PHYSIOGRAPHY, CIMATE                              ENVIRONMENTAL DAMAGE

                                    Economy

                         Moribund production techniques, low
                     productivity, subsistenceliving, low GDP, land
                     tenure, lack of investment, weak markets, etc.

Culture/tradition                Demography                           Education/politics

                    Long history of settlement, warsin medieval times,
                      border wars, civil conflicts in the 20th century,
                       political tensions, other ongoing grievances

                                        History
Population of Ethiopia : 2017 and Historical
110,000,000                                                                                    2.75%

                          2.71%                                                                2.70%
105,000,000                                                                      104,344,901
                                                                 101,853,268
                                                                                               2.65%
100,000,000                               99,390,750
                                                                                               2.60%

 95,000,000
                                                 2.57%
                                                                                               2.55%

 90,000,000                                                                                    2.50%
                   87,561,814                                           2.48%
                                                                                       2.45%   2.45%
 85,000,000
                                                                                               2.40%
 80,000,000
                                                                                               2.35%

 75,000,000                                                                                    2.30%
                     2010                   2015                   2016            2017
                                     Population            Yearly % Change

 Source : Based on: www.worldometers.info/world-population/ethiopia-population
Ethiopia Population Forecast
200,000,000                                                                                                                    3.0%
                                                                                                                 188,455,132

                                                                                                   176,663,351
180,000,000
                                                                                     164,270,263
                                                                                                                               2.5%
160,000,000                        2.4%                                151,430,963
                                                  2.2%
                                                         138,296,890
140,000,000
                                           125,043,752
                                                                2.0%                                                           2.0%

120,000,000                 111,971,051                                       1.8%
                                                                                            1.6%
100,000,000                                                                                               1.5%                 1.5%

 80,000,000
                                                                                                                        1.3%
                                                                                                                               1.0%
 60,000,000

 40,000,000
                                                                                                                               0.5%

 20,000,000

          0                                                                                                                    0.0%

                             2020           2025          2030          2035          2040          2045          2050
                                          Population             Yearly % Change

 Source : Based on: www.worldometers.info/world-population/ethiopia-population
Key Population Figures for 2016 o Live births : 3,345,891 o Deaths : 786,143 o Natural increase: 2,559,747 o 51,364,924 males as of 31 December 2016 o 51,840,300 females as of 31 December 2016
o The urban population was 19.9% in 2016 (approximately 20.8 million persons)
               o The rural population was 81.1% in 2016 (approximately 84.6 million persons)

                                     Ethiopia Population : Percent Urban
          25

                                                                                                                                 19.5       19.9
                                                                                                               18.6     19
          20                                                                                 17.7 18.2
                                                               16.9           17.3
                          15.9       16.1       16.5
               15.7
PERCENT

          15

          10

          5

          0
                  Y2005

                             Y2006

                                        Y2007

                                                       Y2008

                                                                      Y2009

                                                                                     Y2010

                                                                                               Y2011

                                                                                                       Y2012

                                                                                                                Y2013

                                                                                                                         Y2014

                                                                                                                                    Y2015

                                                                                                                                               Y2016
                                                                                YEAR
Note : Caution is called for when interpreting these numbers, as they are just estimates. The validity of these estimates has been decreasing since 2007 because the numbers above are projections based on the 2007 Population and Housing Census of Ethiopia
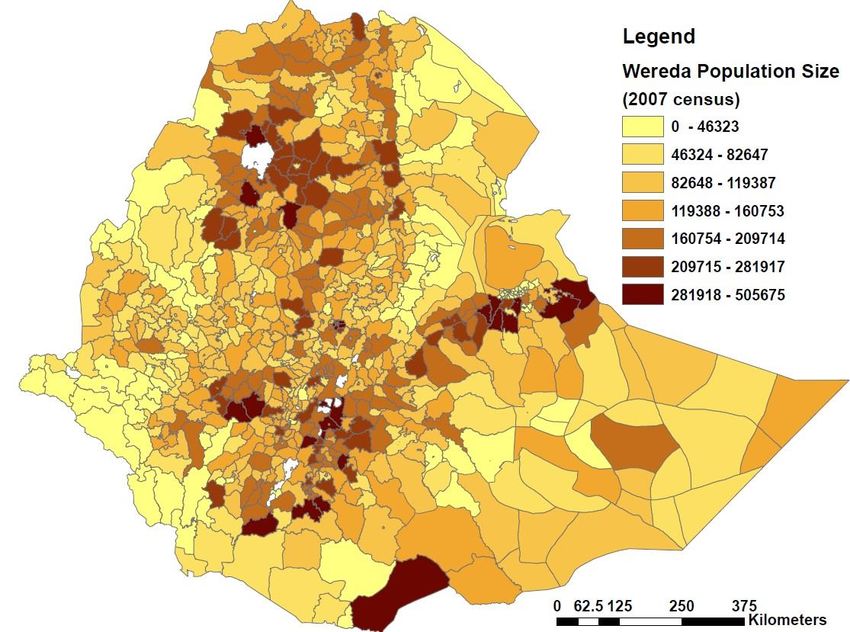
Population Distribution

80% of the country’s population inhabits only 37% of
the total land area, mostly in the highlands.

            Altitude plays a major role
“About 10% of the population lives … at an altitude of
over 2,600 meters above sea level, 39.2% lives between
2,200 meters and 2,600 meters above sea level, 28%
between 1,800 meters and 22,200 meters above sea
level… The lowlands are very sparsely populated mainly
because of malaria and other vector borne diseases.”
Source : Based on census 2007
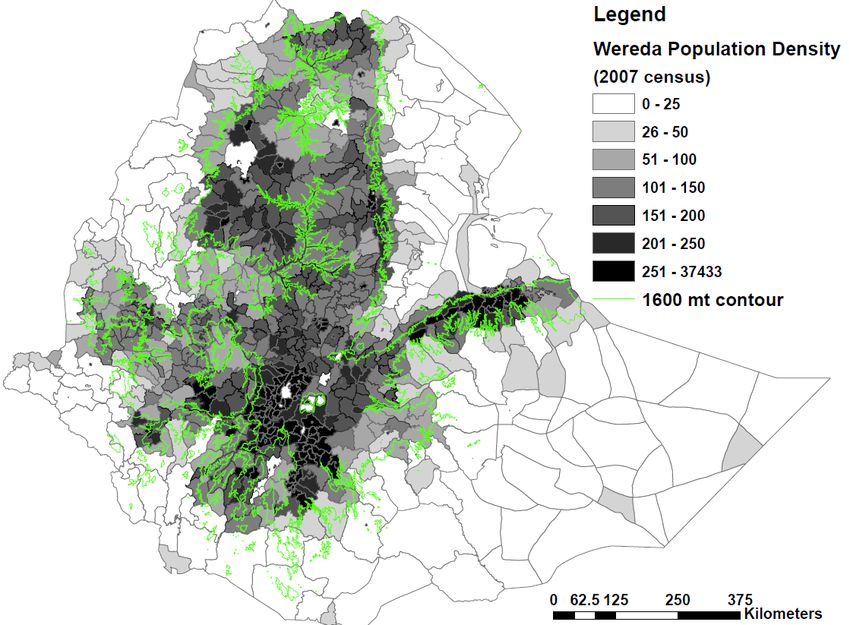
Source : Based on census 2007
What the slides
               showed

➢Much of the Ethiopian population lives in the
highlands
➢Densities are very low in the “Kolla” areas (low
elevations below 1500 meters)
➢Factors responsible for this pattern include,
climate, soil, physiography, and history
➢There has been an ongoing resettlement of
highland populations in the lower elevations of
western and southwestern Ethiopia.
Population History ➢Population size at the start of the 20th century was 12 million. ➢It reached 24 million (double) in 1960. ➢Accelerated growth from 1960 to present. ➢It then “….increased by more than two and a half times its 1960 size reaching 63.5 million in 2000”. ➢Now the second largest population in Africa, after Nigeria. ➢Projected to reach 106 million in 2020.
References for the above slides : Ch
Charles H. Teller.,Gebreselassie, and Assefa Hailemariam.
The lagging demographic and health transitions in rural
Ethiopia: Socio-economic, agro- ecological and health
service factors effecting fertility, mortality and nutrition
trends. Paper presented at Session 104, Population growth
and poverty linkages in Africa, Fifth African Population
Conference, Union of African Population Studies (UAPS),
Arusha, Tanzania, 10-14 December, 2007

Helmut Kloos, Assefa Hailemariam and Aynalem
Adugna. Population. in Yemane Berhane, Damen
Hailemariam and      Helmut Kloos.      Eds. The

Epidemiology and Ecology of Health and Disease in
Ethiopia. Shama Books. Addis Ababa. 2006.
Regional Population Percentage : 2017

      SNNPR, 20.4%
                                              Somali, 6.1%
                                                                                                                     Gambella, 0.5%
                                                       Tigray, 5.6%

                                                                  Dire Dawa, 0.5%
                                                           Addis Ababa, 3.6%
                                                                                                                               Harari, 0.3%
                                                            Afar, 1.9%
Amhara, 22.5%                                               Other, 2.3%

                                                                                                      Benishangul Gumuz,
                                                                                                             1.0%
                                      Oromiya, 37.7%

                Source of percentages : Federal Democratic Republic of Ethiopia Central Statistical Agency
                Population Projection of Ethiopia for All Regions At Wereda Level from 2014 – 2017, August 2013, Addis Ababa
Regional Population Size (2017 estimate)
Oromiya 39,312,507 Afar 2,008,468
Benishangul
Amhara 23,426,547 Gumuz 1,081,820
SNNPR 21,248,513 Dire Dawa 516,526
Somali 6,372,332 Gambella 483,272
Tigray 5,815,911 Harari 272,672
Addis Ababa 3,806,330What the slide
showed
➢Oromiya has the largest population size, and
Amhara is second
➢Of the primarily rural regions, Gambella has by far
the lowest population size.
➢Of the primarily urban regions, Addis Ababa has
the largest population (4% of the country’s total)
➢Even though SNNPR ranks third on total population
count population densities here are among the
highest in the country exceeding five hundred
persons per square kilometers in a number of
Weredas (see the density map above).Age Distribution
Age group % Age group %
0-4 15.9 35-39 5.4
5-9 14.4 40-44 4.3
10-14 12.4 45-49 3.4
15-19 10.3 50-54 2.8
20-24 9.4 55-59 2.2
25-29 8.1 60-64 1.7
30-34 6.7 65+ 2.8
Percent below Age 15 = 42.8What the slide
showed
➢Ethiopia has a very young age structure with more
than two in five of its citizens below age 15
➢This points to a huge growth potential down the road,
or even an explosive growth if unchecked, due to the
built-in momentum.
➢The momentum is evidenced by the very high
percentages of women in the various reproductive age
groups, or soon to be in the reproductive age groups.
➢Less than three percent of the population is in the 65+
age category reflecting the very young age structure as
well as high fertility and mortality in the past, which
now is keeping the age pyramid very wide at the bottom
and tapering quickly toward advanced ages.Demographic Indicators : 1970 - 2012 t
Population (thousands) 2012, total 91,728.8
Population (thousands) 2012, under 18 46,354.9
Population (thousands) 2012, under 5 14,094.5
Population annual growth rate (%), 1990-2012 2.9
Population annual growth rate (%), 2012-2030 2.3
Crude death rate, 1970 21.3
Crude death rate, 1990 18.2
Crude death rate, 2012 7.8
Crude birth rate, 1970 48.1
Crude birth rate, 1990 47.5
Crude birth rate, 2012 33.5
Life expectancy, 1970 42.9
Life expectancy, 1990 46.9
Life expectancy, 2012 63
Total fertility rate, 2012 4.6
Urbanized population (%), 2012 17.2
Source : UNICEF https://www.unicef.org/infobycountry/ethiopia_statistics.htmlDemographic Characteristics
Source
Demographic and Health Survey 2016
Central Statistical Agency Addis Ababa, Ethiopia
The DHS Program ICF
Rockville, Maryland, USA
July 2017MARRIAGE AND SEXUALITY Marriage Trends: Age at first marriage is rising dramatically for women and girls ▪ About one third of women born in the 1970s married before the age f 15; only one tenth of those born in the nineties are married ▪ Women marry about 6.6 years earlier than men on average ▪ The median age at first marriage is 17.1 years among women and 23.7 years among men age 25- 49 ▪ Eleven percent of currently married women report that their husband has multiple wives but the percentages vary from a high of 29% in Somali to 21% in Gambella and Benishangul Gumuz, to 1% in Amhara. ▪ “In Ethiopia the median age at first sexual intercourse among women age 25-49 is 16.6 years. One in four (24%) women have first sexual intercourse before age 15 and 62% before age 18. By age 20, 76% of women have had sexual intercourse.” Page 67
Age -specific fertility rate, ASFR by age group (per 1000 women), General Fertility Rate (GFR) and
                              Total Fertility Rate (TFR) and Crude Birth Rate (CBR) : Eth. DHS 2016

                            243
                230

                                214

                                           210
                    200

                                        190

                                                                                          177
                                                                                       156
                                                    153
                                                  138
                          120
              113

                                      112
      98

                                                                                      81
         80

                                                             80
                                                 77

                                                            69

                                                                                                 33.2
                                                                                                 31.8
                                                                                                23.9
                                                                     27
                                                                    22
    20

                                                           14

                                                                             5.2
                                                                             4.6
                                                                             2.3
    15-19     20-24       25-29       30-34      35-39     40-44   0
                                                                   45-49      TFR     GFR       CBR
                                                                            (15-49)

                                            Urban         Rural     Total
Trends in Age Specific Fertility Rate (2000 - 2016)
300
250
Number of births per thousand
200
150
100
50
0
15-19 20-24 25-29 30-34 35-39 40-44 45-49
2000 EDHS 2005 EDHS 2011 EDHS 2016 EDHSWhat the slide
showed
➢Ethiopia’s age-specific fertility rate is typical of a third world
nation with early onset in reproduction, and a continued high
fertility regime all the way to age 40.
➢Age specific rates peak at about age 30
➢There is a sharp contrast between urban and rural age- specific rates
with the later showing about half as many births to an individual
woman as in rural Ethiopia. The almost two-to-one age-specific
fertility gap is very large, and rarely seen in other countries of Sub-
Saharan Africa.
➢It is difficult to generalize, however, that this national picture
would be duplicated at regional levels with similarly large gaps in
fertility levels between urban and rural populations.Rural Age-Specific Fertility is Higher
than Urban Fertility by a Factor of:
Age Group Factor
15-19 4.9
20-24 2.0
25-29 2.0
30-34 1.9
35-39 2.0
40-44 5.7
45-49 No dataWhat the slide
showed
➢ When broken down by age group of women, the
2016 age-specific fertility rates in rural Ethiopia are
higher by a factor of 1.9 to 5.7 than urban age-
specific rates.
➢The highest differences are in the
younger and older reproductive age
groups, 15-19 and 40-44 respectively
➢The 2016 demographic and survey showed that
compared to previous surveys, the gap narrowed
slightly for the 15-19 age group and increased
moderately for the 40-44 age group.Fertility by Background Characteristics : DHS 2016
6.8
Mean number of children ever born to women age 40-49
4.3
8
Percentage of women age 15-49 currently pregnant
4.6
5.2
Total fertility rate
2.3
0 1 2 3 4 5 6 7 8 9
Rural UrbanTFR by Region and Educational Level : DHS 2017
8
7.2
7
6 5.5
5.7
5.4
5 4.7
4.4 4.4
4.1 4.2
4 3.7
3.5
3.1
3
2.2
1.9
2 1.8
1
0What the slide
showed
➢The highest average number of children born to an individual
Ethiopian woman was recorded in Oromiya (6.2 births per
woman), and the lowest in Addis Ababa (1.4 births per
woman)
➢Given the harsh physical environment, scarce resources, and
socio-economic as well as political difficulties, the second
place position for the Somali region (6 births per woman) is
difficult to understand. More thorough fertility studies can
shed light on underlying factors placing an up-ward pressure
on fertility in the region.
➢Overall, the numbers mark a decline in fertility in Ethiopia in
recent years, with the national average TFR (total number of
children born to a woman) now estimated to be 5.4Trends in Age Specific Fertility Rate
350
300
250
200
150
100
50
0
15-19 20-24 25-29 30-34 35-39
Number of years preceding survey 0-4 Number of years preceding survey 5--9
Number of years preceding survey 10--14 Number of years preceding survey 15-19What the slide
showed
➢The length of the bars represents the amount of fertility
decline among the five-year age cohort of women in Ethiopia
in the 15 years preceding the 2016 Demographic and Health
Survey.
➢The good news for those advocating restraints in population
growth in Ethiopia (myself included) is that fertility rates are
on a decline in ALL age groups from young to old.
➢It is especially reassuring to note the decline among the
beginner cohort (age 15 – 19). It appears that the
reproductive engine of the youngest age group of Ethiopian
females is not putting out as much power (as measured in
terms of numbers of births) as that of the 15-19-year-olds
before them. Same goes for the next higher age groups.Percent of Women Aged 45-49 in 2016 by the Number of Children
Ever Born
18
16.1
16
14.5
13.8
14
Percent of women aged 45-49
12 11.7
11
10.3
10
8.1
8
6
4.9
4.1
4
2.8 2.9
2
0
0 1 2 3 4 5 6 7 8 9 10 plus
Number of children ever born• Fertility has fallen by more than two children during the past three decades, from 6.9 children per woman to 4.6 in the 2016 Ethiopian Demographic and Health Survey • Fertility has declined in both rural and urban areas, in all regions, at all educational levels, and for all wealth quintiles
Percentage of women aged 45-49 at DHS 2016 by the
                           Number of Children Ever Born
          18
                                                                16.1
          16                                                                  14.5
                                                         13.8
          14
                                                                       11.7
          12                                        11
Percent

                                             10.3
          10
                                       8.1
           8
           6                     4.9
                           4.1
           4   2.8   2.9
           2
           0
               0     1     2     3     4      5     6     7      8      9     10+
                           Number of children ever born
What the slide
showed
➢Childlessness – whether biological or by choice – is very low
in Ethiopia; less than 2% of Ethiopian women who have
completed their reproduction or were about to do so at the
time of the survey, reported themselves as childless.
➢Three-quarters of Ethiopian women aged 45-50 at the time
of the survey have had 6 or more births, confirming the high
fertility history of the country’s demographic past.
➢Nearly 15% of women who have completed their
reproductive years have double-digit number of births – ten
or more.
➢Since the projected trend (based on current ASFR) suggests a
completed TFR of 4.6 for 100% of the women now starting
their reproductive life, the current percentages with five births
or more show just how high fertility has been in the past.Teenage pregnancy and childbirth : DHS 2016
30 27.7
25.1
25
19.6
20
14.7
15
Percent
13.2
11.2
10
4.4 4.9
5 3.5
2.6
1.6 2.1
0.6 1 0.9
0
Age 15 Age 16 Age 17 Age 18 Age 19
Have had a live birth at this age
Are pregnant with first child at this age
Percentage who have begun childbearing at this ageTeenage pregnancy and motherhood by region (DHS 2016) : Percentage of
women age 15-19 who have begun childbearing
Percent
ADDIS ABABA 3
AMHARA 8
SNNPR 11
TIGRAY 12
DIRE DAWA 13
BENISHANGUL-GUMUZ 14
GAMBELA 16
HARARI 17
OROMIYA 17
SOMALI 19
AFAR 23
0 5 10 15 20 25What the slide
showed
➢ Pregnancy and child-birth starts very early in Ethiopia
with a wide regional variation in percentage of
teenage girls who have began childbearing
➢ Afar has the highest percentage (23%) and Addis
Ababa has the lowest (2%)
➢ Rural teenage are three times more likely to have begun
childbearing than their urban peers
➢ Teenage childbearing decreases with increasing
education with percentages decreasing from 28%
among those with no education to 12% among those
with primary education and 3% among those with more
than secondary education.➢ “Teenagers in rural areas are three times more likely to have
begun childbearing than their urban peers: 15% of rural
teenagers have had a live birth or are pregnant, as compared
with 5% of urban teenagers.”
➢
➢ “By region, teenage childbearing is highest in Affar (23%)
and Somali (19%) and lowest in Addis Ababa (3%) and
Amhara (8%)”
➢
➢ “Teenage childbearing decreases with increasing education.
The percentage of teenagers who have begun childbearing
rises from 3% among those with more than a secondary
education to 12% among those with a primary education and
28% among those with no education.”
➢ “Teenage childbearing is less common in the wealthiest
households: 6% of women age 15-19 from the highest
wealth quintile have begun childbearing, as compared
with 24% of those from the lowest quintile.”
➢ Page 86Birth Interval, DHS 2016 : Months since preceding Birth
by Age Group of Women
50
40
30
20
10
0
15-19 20-29 30-39 40-49
Age
Duration (months) Months since preceding birth 7--17
Short birth intervals, especially those below 24 months, place mothers and their newborns
at increased health risk. The median birth interval in Ethiopia is 34.5 months which means
that half of non-first births occur within 3 years after the first birth. Nearly a third of all births
(32%) occur within 24-35 months of the previous birth, and just over a fifth (21%) occur
within at least 3 years after the previous birth. Page 79Family Planning DHS 2016
▪   Modern contraceptive use: Modern contraceptive use by currently
    married Ethiopian women has steadily increased over the last 15 years,
    jumping from 6% of women using modern contraceptive method in 2000
    to 35% in 2016.
▪   Methods used: By method, the largest growth has been in injectables
    use, which expanded from use by 3% of women in 2000 to 23% in
    2016, followed by growth in implant use, from less than 1% of women
    using in 2000 to 8% in 2016.
▪   Sources of modern methods: The most popular sources of modern
    contraception are public sector sources (84%); only 14% get their
    modern methods from private sector sources.
▪   Unmet need for family planning: Twenty-two percent of currently
    married women have an unmet need for family planning
▪   Percentage of demand for family planning satisfied: Overall, about 6
    in 10 currently married women age 15- 49 have their demand for family
    planning satisfied.

▪   DHS 2016, direct quote, page 103
Knowledge of a Family Planning Method: All women (DHS 2016)
Lactational amenorrhoea method (LAM) 29.3
Standard days method (SDM) 10.6
Emergency contraception 19.5
Female condom 21.7
Male condom 66.2
Method
Implants 74.3
Injectables 96.2
IUD 45.6
Pill 87.2
Male sterilisation 11.5
Female sterilisation 34.2
Any modern method 98.3
Any method 98.3
0 20 40 60 80 100 120
PercentWhat the slide
showed
➢Injectables and the pill are the most widely used
birth control methods in Ethiopia.
➢More than four in five women who used any
modern method used these two methods (each)
➢At 46% the condom is the third most widely used
method of birth control in the country.Current Use of Contraceptives by Region : DHS 2016
60
55.9
50 47.3
39.9
40 36.3
34.9
Percent
29.5 30.3
30 28.5 28.6
20
11.6
10
1.5
0
Region▪ Current use of modern contraception for married women is
lower in rural areas (32%) than in urban areas (50%).
▪ Regionally, currently married women Addis Ababa have the
highest use of modern contraception (50%) and Amhara
women are second (47%). Currently married women in Somali
have the lowest use of modern contraception (1%), followed by
Affar (12%).
▪ Education has a big role : modern contraceptive use among
currently married women increases with educational
achievement from 31% for women with no education to 51%
for women with secondary education or higher.
▪ And wealth makes a big difference as use of modern
contraception rises sharply with wealth, ranging from 20% for
women in the lowest wealth quintile to 47% for women in the
highest wealth quintile
▪ Page 105Current Use of Contraceptives by Age (all women) : DHS 2016
45
41
40 38.8
37.3
35.9
34.7
35 33.4
31.9
30
Percent
25
20 19.3
15
10
5
0
15-19 20-24 25-29 30-34 35-39 40-44 45-49 Total
AgeWhat the slide
showed
➢The low percentage of women in the 45 – 49 age group using any
method of contraception reflects the recency of adoption of the
technique by the 20% or so Ethiopian women in this age group
who are now using birth control methods. It is worth noting that
the percentage is higher in this DHS than in previous ones for this
age group and for all other age groups.
➢The rate for youngest age group (15-19) has shown a significant rise
from previous DHS reflecting greater propensities to engage in
sexual activity in recent years coupled with greater awareness of
and access to contraceptives.Exposure to Media Messages and Family Planning
Decision Making: DHS 2016
o The most often cited source of information on family
planning messages reported by women and men age 15-
49 in the few months prior to DHS 2016 is community
event or conversation (38% and 37%, respectively)
o Another main reported by 24% of women and 33% of
men is radio. Television is mentioned by 18% of women
and 23% for men
o Printed materials including newspapers, magazines, and
pamphlets, posters, or, leaflets are cited as sources of
family planning messages were reported by 5-6% of
womenMedia and decision making….contd. Women’s exposure to family planning messages through new technologies, such as mobile phones is limited; two percent and three percent respectively. Overall, 46% of women and 40% of men age 15-49 have no exposure to family planning messages through any of these above mass media means.” On decision making about family planning, 73% of currently married women age 15-49 who are using a family planning method reported that the decision to use it was made jointly with their husband For 22% of the women the decision was made mainly by themselves, and for 5% the husband was mainly responsible for the decision. “Among currently married women age 15- 49 who are not using a family planning method, 58% made the decision not to use family planning jointly with their husband, 30% decided themselves, and for 10% the husband decided.”
Percent of Women 15-49 Using Any Contraceptive Method
                          by Region : DHS 2016

           Somali       1.5

            Affar                  11.6

Benishangul-Gumuz                              28.5

         Oromiya                               28.6

           Harari                               29.5

        Dire Dawa                                   30.3

         Gambela                                           34.9

           Tigray                                           36.3

           SNNPR                                                   39.9

          Amhara                                                          47.3

      Addis Ababa                                                                55.9

                    0         10          20   30             40           50      60
What the slide
showed
➢The adoption of family planning in urban Ethiopia has gained
momentum in recent years. This is reflected by the 46.7%
adoption rate. The rate in rural Ethiopia is a dismal 10% but a
significant improvement from the late 1980s when it was one to
two percent.
➢Of they primarily rural regions, Amhara has the highest
contraceptive prevalence (47.3%) followed by SNNPR (39.0%)
and Tigray (36.3). Somali has the lowest rate (1.5%).
➢Given that they are urban places, it appears that the cities of
Dire Dawa and Harari are performing below their potential
even though they have made marked progress since the last
DHS.Wealth quintile Education
What the
                slide showed

➢As is the case elsewhere in Africa, Asia, and Latin America,
the educational level of an individual woman is the single
most important determinant of contraceptive use in
Ethiopia
➢ Compared to a woman with no education, completing
just a primary level education provides tangible advantages
to an individual woman in terms of desire to use
contraception, seeking information about it, knowing where
to go to access services, and eventual use

➢Completing a high school provides a nearly two-to-one
advantage as measure by differences in percentage
prevalence

➢Wealth is also a very important determinant. The rate for
women in the highest wealth quintile is more than twice
that for women in the lowest wealth quintile
Percent Discontinuation of Contraceptive Discontinuation
Within 5 Years Before the 2016 DHS by Method
Other
Marital disolution
Infrequent sex/husband away
Up to God/fatalistic
Inconvenient to use
Lack of access/too far
Health concerns/side effects
Wanted a more effective method
Husband disapproved
Wanted to become pregnant
0 5 10 15 20 25 30 35 40 45 50
Male condom 1.4 Implants 0.8 Injectables 1.6 IUD 0.5 Pill 7
Contraceptive discontinuation
More than one-third of all contraceptive users (35%) discontinued use within 12 months in the 5
years preceding the survey more the most common reasons being the desire to become pregnant
(42%) and method-related health concerns or side effects (18%). Page 107Percentage of Women who Have Two or Three Children and
Want No More, By Residence, Region, and Education : DHS 2016
60
54.6
50.6
50 47.3
44.5
41.5
40 38.5 37.9
36.8
33.3 34.1 32.2
29.4 28.8
30
25.7 24.9
20.7 20.3
20
12.7
10
3.7
0
Two children Three childrenWhat the slide
showed
➢Only half of the women in Addis Ababa who have had 3
births want more children. The other half don’t. A
comparable group is women with above secondary
education. Gambella tops the primarily rural regions with
44.5%
➢In Somali, 96%of such women want more children; 83
percent in Afar. The urban-rural difference is also worth
noting
➢ “In Ethiopia, 2% of currently married women age 45-49
have never given birth. Since voluntary childlessness is rare,
this is often viewed as a measure of primary sterility”. P79Percentage of Women who do not Want and More Births by
Current Number of Living Children : DHS 2016
Urban men Urban women Rural men Rural women
80
70
60
50
Percent
40
30
20
10
0
0 1 2 3 4 5 6+
Number of living childrenPercent
What the slides
                  showed

➢Half of rural women with 6+ children still want more; two
thirds of urban women don’t
However, there is a strong spatial component . The fifty-
fifty split (national level) fails to hold at regional levels. For
example, 96% of Somali women (urban and rural combined)
with 6+ births births want more; 93% in Afar.

➢The overall percentage of women who want no more
children regardless of the current number of living children is
highest (>40%) in Oromiya and SNNPR, and for women with
no education
➢ It is not surprising that the percentage of women who
want no more children is lower in the urban regions of Addis
Ababa, Dire Dawa, Harari than in Oromiya and SNNPR, as
the birth rates are low and these women would like to make
Percentage of Women and Men 15-49 by the Ideal
Number of Children : DHS 2016
Men Women
6+
Ideal number of children
5
4
3
2
1
0
0 5 10 15 20 25 30 35
Percent▪ The modal ideal numbers of children for both men
and women are four and six (see above slide)
▪ The male-female difference in the ideal family size is
insignificant (see above slide)
▪ “Mean ideal number of children decreases as
women’s level of education increases. Women with
no education want 5.2 children, while those with
more than a secondary education want 3.6 children.”
▪ “Mean ideal number of children also decreases with
increasing wealth. Women in the lowest wealth
quintile prefer 5.5 children, while women in the
highest quintile prefer 3.9 children.”
▪ Page 93Proximate Determinants
of Fertility
Marriage➢ Current marital status: Sixty-five percent of women and 56% of
men in Ethiopia are currently in a union.
➢ Polygyny: Eleven percent of currently married women report
that their husband has multiple wives.
➢ Age at first marriage: Marriage is nearly universal in Ethiopia,
although women marry about 6.6 years earlier than men on
average. Median age at first marriage is 17.1 years among
women and 23.7 years among men age 25- 49.
➢ Sexual initiation: The median age at first sexual intercourse is
0.5 years earlier than the median age at first marriage for women
and 2.5 years earlier for men; this indicates that both women and
men engage in sex before marriage.
➢ Trends: Age at first marriage has dramatically changed for
women and girls. More than 30% of women born in the seventies
married before age 15, while for those born in the nineties, this
indicator is around 10 percent.
➢ Direct quote, DHS 2016 page 65Percentage of Women 15-49 by Marital Status
DHS 2016
Never married Married Living together
Divorced Separated Widowed
100
90
16.8
80
70
Percent
60 59.9
63.9
50 79.7
86
82.1 81.3
40 77.1
30
20
10
0
15-19 20-24 25-29 30-34 35-39 40-44 45-49 Total 15-49
AgePercentage of Men 15-49 by Marital Status
DHS 2016
Never married Married
Living together Divorced
100 1
90
23
80
70 52.1
Percent
60 58.1
50 78.9 86.3 89.5 92.1
40
30
20
10
0
15-19 20-24 25-29 30-34 35-39 40-44 45-49 Total
15-49
AgeWhat the slides
showed
➢Nearly 17% of girls and young women marry while still
in their teen years and close to two-thirds marry before
age 25.
➢Men’s proportions in the “married” group do not
takes off until the age group 25-29.
➢The male-female age difference at marriage suggests
that men in the 25-34 age group are marrying the age
groups 20-24 and 25-30 (a five to ten year age gap).
➢The percentage of married women decreases after the
age group 30-34 as divorce and separation rates spike and
women, especially those married to much older males,
become widows. Widowhood is rare for men; they
simply remaryPolygyny
Percentage of Women whose Husbands have at least one other Wife,
by Age group and Urban-Rural Residence , 2005
17.6
17
16.1
13 12.9
9.4
7.4
6.3
4
15-19 20-24 25-29 30-34 35-39 40-44 45-49 Urban RuralWhat the slide
showed
➢Husbands begin to take second or third wives at
appreciable rates when the first wife reaches age
30.
➢Sociological studies can reveal whether this is
done partly at the urging of the first wife, who may
have 5 or more children by now, to lessen the
crushing burden of child-rearing, carring for the
entire family, and farming duties.
➢There is a significant urban-rural difference in
polygyny.Percent
What the slide
               showed

➢More than a quarter of husbands in Somali and
one in five in Gambella, Benishangul Gumuz, and
Afar have two or more wives; more than a fifth in
Afar.

 ➢The Amhara region is the most monogamous
region in Ethiopia. However, given the reported
high divorce rates in the region, one is tempted to
ask whether or not this is a case of serial
monogamy whereby couples marry, divorce or
separate, marry another, divorce again…e.t.c.
▪ Polygyny ….contd.
▪ Age is a factor : In general, older women are much more
likely than younger women to have co-wives with
percentages ranging from 4% among those age 15-19 to
18% among those age 45-49
▪
Rural-urban residence : Rural women are more likely to
report having co-wives (12%) than urban women (5%)
▪ Education matters : “Women with no education are much
more likely to have co-wives (14%) than women who have
attended school (7% or less)”Percentage of Women who Married at Exact Age
Fifteen or Twenty by Current Age : DHS 2016
Percentage first married by exact age: Fifteen
Percentage first married by exact age: Twenty
90
80
70
60
Percent
50
40 31.9
27.3 26.8 29.1
30
20.5
20 14.1
10 5.7
0
15-19 20-24 25-29 30-34 35-39 40-44 45-49
Current ageWhat the slide
showed
➢The age at marriage has been increasing
sharply in Ethiopia as shown by the
precipitous decline in the percentage of
women marrying at age 15 from the older
cohorts (40- 44/45-49) to the younger
cohort (25-29/30-34), and even more
sharply among the youngest cohorts (20-
24 and 15-19)“o Marriage marks the point in a woman’s life when
sexual activity and childbearing becomes socially
acceptable. However, there appears to be a widening
gap between age at marriage and age at first sexual
intercourse.
o Among women age 25-49, the median age at first
intercourse is 0.5 years younger than the median age at
first marriage (16.6 years versus 17.1 years) (DHS, 2016).
o This indicates that many women engage in sexual activity
before marriage.
o In other words, women may be exposed to the risk of
pregnancy and childbearing at an even earlier age than is
indicated by the median age at first marriage.Infant and Child Mortality
Demographic and Health
Survey, DHS 216“One of the targets of the millennium development goal is a two-third reduction in infant and child mortality by 2015, to be achieved through upgrading the proportion of births attended by skilled health personnel, increasing immunization against the six vaccine preventable diseases, and upgrading the status of women through education and enhancing their participation in the labour force.”
KEY FINDINGS, DHS 2016
▪ Current levels: For the 5-year period preceding the survey, the under-5
  mortality rate is 67 deaths per 1,000 live births, and the infant mortality
  rate is 48 deaths per 1,000 live births. This means that 1 in 15 children
  in Ethiopia dies before reaching age 5, and 7 in 10 of the deaths occur
   during infancy.

▪ Trends: Childhood mortality has declined substantially since 2000.
   However, the change in neonatal mortality is not as significant as the
   change in post-neonatal and child mortality.
▪ Regional differences: Regions show large variations in childhood
  mortality. Under-5 mortality ranges from a low of 39 deaths per 1,000
  live births in Addis Ababa to a high of 125 deaths per 1,000 live births in
  Affar.
▪ High-risk fertility behaviour: Seventy-seven percent of currently
  married women have the potential for a high-risk birth. Sixty-two percent
  of births have high mortality risks that are avoidable; 38% fall into a
  single high-risk category and 24% are in a multiple high-risk category.
  Only 24% of births are not in any high-risk category.
                                       Direct quote : DHS 2016 page 123
DEFINITION
o Neonatal mortality: The probability of dying
within the first month of life
o Post neonatal mortality: The probability of
dying between one month and the first birthday
(computed as the difference between infant and
neonatal mortality)
o Infant mortality: The probability of dying
between birth and the first birthday
o Child mortality: The probability of dying
between the first and the fifth birthday
o Under-5 mortality: The probability of dying
between birth and the fifth birthday
Direct quote : DHS 2016 page 124Deaths Per Thousand Live Births in the 5- Year
Period Before the Survey
DHS2000 DHS2005 DHS2011 DHS2016
180
166
Rate per thousand
160
140
120 123
100 97
88
80 77
60
67
59
40
48 49
3937
29
20
0
Under five mortality Infant mortality Neonatal morntality
CategoryWhat the slides
showed
o Under-5 mortality declined from 166 deaths per
1,000 live births in 2000 to 67 deaths per 1,000
live births in 2016 . This represents a 60
percent decrease in under-5 mortality in16
years
o Infant mortality declined from 97 deaths per
1,000 live births in 2000 to 48 deaths per 1,000
live births in 2016 - about 50 percent reduction
in the last 16 years.
o Neonatal mortality declined from 49 deaths per
1,000 live births in 2000 to 29 deaths per 1,000
births in 2016, a 41 percent reduction over the
past 16 years.Mortality of Children Under Five by
Age of Mothers at Birth : DHS 2016
100 Age of Mothers at Birth
90Neonatal (NN) and Post-neonatal (PNN) Mortality by
Region : DHS 2016
50 Neonatal mortality (NN) Post- neonatal mortality (PNN)
45 42
40
Number of deaths per
35 31
thousand births
30
30 26 26
25 23
21
23
20
20
15
10
10 8
5
0
RegionInfant Mortality, Child Mortality and Under-five Mortality
by Region : DHS 2016
140
Infant mortality (1q0) Child mortality (4q1) Under-5 mortality (5q0)
120
100
Number of deaths per
81
80
thousand births
65 67 67 67
60 62
60 56 57
43
40
28
20
0
RegionMortality rate by Educational Level of Mothers
and Urban Rural Residence : DHS 2016
Urban Rural No education Primary education Secondary education
100
90
Number of deaths per
80
thousand births
70
60
50
40
30
20
10
0
Neonatal mortality Post- neonatal Infant mortality Child mortality Under-5 mortality
(NN) mortality (PNN) (1q0) (4q1) (5q0)
CategoryWhat the slides
showed
o Mortality among Ethiopia’s children is higher in rural areas than in
urban areas. For example under-5 mortality is much higher in rural
areas than in urban areas - 83 versus 66 deaths per 1,000 live births
o By region mortality among children is highest in Afar,
Benishangul Gumuz, and Somali and lowest in Addis Ababa. For
example under-5 mortality rate is highest in Affar (125 deaths
per 1,000 live births) and lowest in Addis Ababa (39 deaths per
1,000 live births)
o Mortality among Ethiopian children declines with increases in the
mother’s education. For example, Infant mortality decreases from 64
deaths per 1,000 live births among children whose mothers have no
education to 35 deaths per 1,000 live births among children whose
mothers have more than secondary educationMortality under Age 5 by Sex of the Child : DHS 2016
Female Male
Under-5 mortality (5q0)
Child mortality (4q1)
Category
Infant mortality (1q0)
Post- neonatal mortality (PNN)1
Neonatal mortality (NN)
0 20 40 60 80 100
Number of deaths per thousand birthsMortality Under Age Five by Birth Order : DHS 2016
120 Birth order
1 2--3 4--6 7+
Number of deaths per thousand births
100
80
60
40
20
0
Neonatal mortality Post- neonatal Infant mortality Child mortality Under-5 mortality
(NN) mortality (PNN)1 (1q0) (4q1) (5q0)
CategoryMortality of Children Under Five
by Birth Interval (Years) : DHS 2016
Birth Interval in Years
120What the slides
showed
o The probability of a child dying in infancy is much greater
among children born to mothers who are too young
(under age 18) or too old (over age 34)
o Children born after a short birth interval (less than 24
months after the preceding birth), and children born to
mothers of high parity (more than three children).
o The risk is elevated when a child is born to a mother who
has a combination of these risk characteristics.
o Boys are more likely to die in childhood than girls
DHS 2016 Page 123What the slides
showed
……contd.
o Shorter birth intervals are associated with higher mortality. For example,
the under-5 mortality rate for children born less than 2 years after the
preceding birth is more than twice that of children born 4 or more years
after their preceding sibling (114 deaths per 1,000 live births compared
with 55 deaths per 1,000 live births).
o This is also true of infant mortality rate which is 92 deaths per 1,000 live
births for a birth interval less than2 years and 44 deaths per 1,000 live
births for children born 4 or more years after the preceding birth
o Additionally, Children reported to be small or very small at birth are more
likely to die than children reported to be average or larger at birth. For
example, infant mortality for children who were reported to be small or
very small at birth is 56 deaths per 1,000 live births compared with 43
deaths per 1,000 live births for children who were reported to be average
or larger at birth.
DHS 2016 Page 125Perinatal mortality
Definition : Perinatal mortality rate
“Perinatal deaths comprise stillbirths
(pregnancy loss that occurs after 7 months of
gestation) and early neonatal deaths (deaths
of live births within the first 7 days of life).
The perinatal mortality rate is calculated as
the number of perinatal deaths per 1,000
pregnancies of 7 or more months’ duration.”
Direct quote : DHS 2016 page 126Perinatal Mortality Rate by Age Group of Women
Still births and early neonatal deaths per 1000 pregnancies
DHS 2016
Number of stillbirths Number of early neonatal deaths Perinatal mortality rate
120
100
80
60
40
20
0Perinatal Mortality by Region : DHS 2016
Still births and early neonatal deaths per 1000 pregnancies
Number of stillbirths Number of early neonatal deaths Perinatal mortality rate
120
100
80
60
40
20
0
RegionPerinatal Mortality by Previous Birth Interval
in Months : 2016
Perinatal mortality rate Number of early neonatal deaths Number of stillbirths
39+
Birth interval in months
27-38
15-26Perinatal Mortality by Education and Urban-Rural
Residence of Mothers : DHS 2016
Still births and early neonatal deaths per 1000 pregnancies
250
Number of stillbirths Number of early neonatal deaths Perinatal mortality rate
200
150
100
50
0
No Primary Secondary More than Urban Rural
education secondary
Educational status and residenceWhat the slides
showed
o Perinatal mortality increases with mother’s age at birth, from 28 deaths per 1,000
pregnancies for women age 20-29 to 63 deaths per 1,000 pregnancies for women age 40-
49. This shows that perinatal mortality among children born to women age 40-49 is more
than twice as high as for women age 20- 29
o
o The perinatal mortality rate is relatively high for first pregnancies (33 deaths per 1,000
pregnancies) and among women with a pregnancy interval of less than 15 months (45
deaths per 1,000 pregnancies).
o
o The perinatal mortality rate is higher in urban than in rural areas (42 versus 32 deaths
per 1,000 pregnancies, respectively).
o The perinatal mortality rate is highest in Somali (50 deaths per 1,000 pregnancies) and
lowest in Affar and SNNPR (26 deaths per 1,000 pregnancies for each region).
o The perinatal mortality rate is highest among pregnancies to women with more than
secondary education (52 deaths per 1,000 pregnancies) compared with pregnancies to
women with no education
Direct quote : DHS 2016 page 126You can also read