LONG - Team Members: Grace Ee Jordon Woon Sean Pan Serene Koh Justin Kuan - NTU-IIC
←
→
Page content transcription
If your browser does not render page correctly, please read the page content below
LONG
Current price: USD497.98
   (as of 19 Jan 2021)

  12-month price target:
USD600.00 (20.49% upside)

                    Team Members:
                           • Grace Ee
                       • Jordon Woon
                           • Sean Pan
                         • Serene Koh
                         • Justin Kuan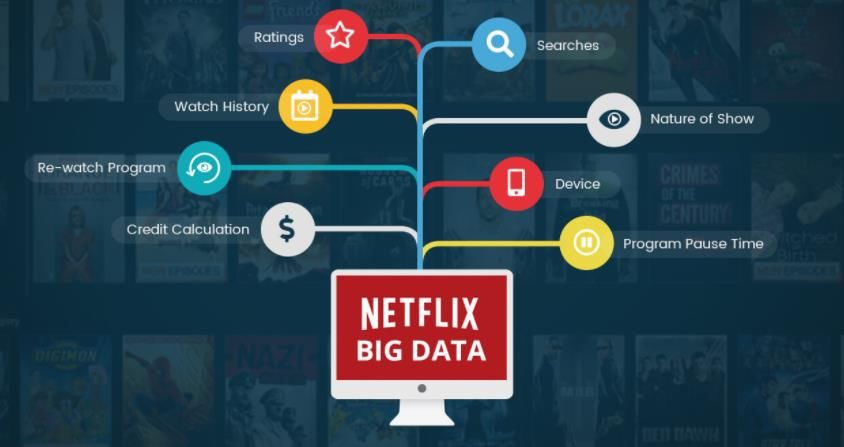
Company Overview
                        Business Description                                                                       Key Historical Financials
                                                                                                                                                           36.90%           38.30%
  •   Founded in 1997, headquartered in Los Gatos, California                          25000                                                                                          40%
                                                                                                     32.30%                                                                           35%
                                                                                                                                          31.30%
  •   Provider of subscription streaming entertainment service                         20000                          29.10%
                                                                                                                                                                            20156.4
                                                                                                                                                                                      30%
  •   Acquires, licenses and produces content, including original programing                                                                               15794.3
                                                                                       15000                                                                                          25%
  •   Allows members to watch a variety of television (TV) series,                                                                        11692.7
                                                                                                                                                                                      20%
      documentaries and feature films across a wide variety of genres and                                              8830.7
                                                                                       10000                                                                                          15%
      languages                                                                                       6779.5
                                                                                                                                                                            12.90%    10%
  •   Provides members the ability to receive streaming content through a host         5000                                                                10.70%
      of Internet-connected screens, including TVs, digital video players,                                                                 7.80%                                      5%
                                                                                                      5.40%            5.00%
      television set-top boxes, and mobile devices                                        0                                                                                           0%
                                                                                                       2015               2016              2017               2018          2019
  •   Has approximately 195 million paid members in 190 countries
                                                                                                          Revenue (in Millions USD)             Gross Margin          EBITDA Margin

                           Product Offerings                                                                        Geographical Presence
                                                          Basic   Standard   Premium

      DVD By-Mail
                                Monthly cost* (United     $8.99    $13.99    $17.99               Netflix Revenue Growth by Region
  1   Membership Services
                                States Dollar)
                                                                                       3000
                                Number of screens you      1         2          4
                                can watch on at the                                    2500
                                same time                                              2000
                                                                                       1500
      Production of             Number of phones or        1         2          4
  2   Content                   tablets you can
                                have downloads on
                                                                                       1000
                                                                                        500
                                                                                          0
                                Unlimited movies and TV    ✓         ✓         ✓
                                shows                                                           Q1 - Q2 - Q3 - Q4 - Q1 - Q2 - Q3 - Q4 - Q1 - Q2 -
                                                                                                2018 2018 2018 2018 2019 2019 2019 2019 2020 2020
      Streaming Content         Watch on your laptop,      ✓         ✓         ✓
  3   Membership Services
                                TV, phone and tablet                                           United States and Canada          Europe, Middle East, and Africa
                                HD available                         ✓         ✓               Latin America                     Asia-Pacific
                                Ultra HD available                             ✓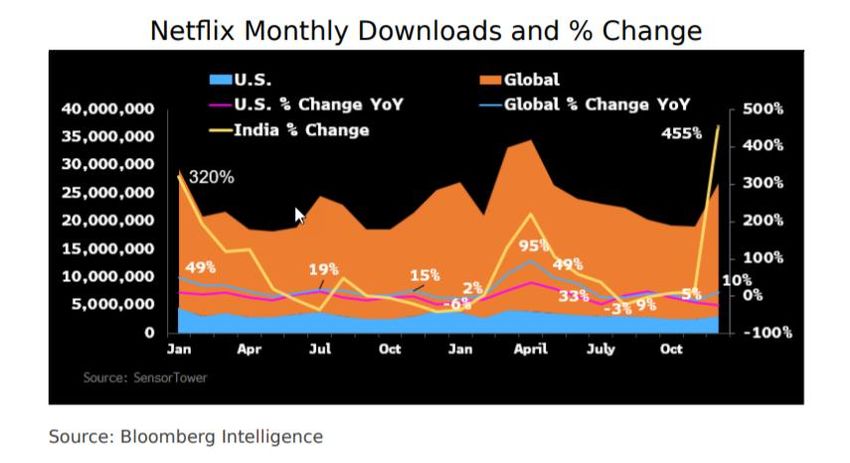
Historical Share Price Performance

 583.00
                                                                                                                       3      60.00mm                    As at 19 Jan 2021
 533.00
                                                                                                                              50.00mm                    Share Price             497.98
 483.00

                                                                                                                              40.00mm
                                                                                                                                                         Shares Outstanding      441.8M
 433.00
                    1
Share Price

 383.00
                                                                                 2                                                                       Market Capitalization   225.49B
                                                                                                                              30.00mm

 333.00
                                                                                                                                                         Enterprise Value        233.15B
                                                                                                                              20.00mm
 283.00

                                                                                                                              10.00mm
 233.00                                                                                                                                                  Stock Price History

                                                                                                                                    Transaction Volume
 183.00                                                                                                                       0                          52-week High            556.55

                                                                                                                                                         52-week Low             298.84

                                                          Netflix, Inc.Axis Title
                                                                       (NasdaqGS:NFLX) - Volume

              S/N       Date                                                Event                                            Price (USD)                         EV/EBITDA                P/E

              1     Jul 24 2018   Netflix establishes its first European production hub in Madrid                              357.32                              111.15x           263.27x

                                  Netflix reported results for 2019 Q3 – it beat on earnings but slightly missed analysts’
              2     Oct 16 2019
                                  expectations for revenue
                                                                                                                               286.28                              47.09x            101.81x

              3     Aug 26 2020   Tiktok reportedly approached Netflix in plan for Netflix to acquire its US operations        547.53                              62.89x            132.39x
Industry Overview
               Netflix’s Main Competitors                                              Key Market Trends
        Video-on-demand Subscribers Globally (in millions)                • Growth in video-on-demand market size from USD
                                                                            53.96 billion (2019) to USD 159.62 billion (2027)
                     30                                                   • Estimated to exhibit a CAGR of 14.8%

                     30.4                                                 • Rising adoption of mobile devices and smartphones
                                                                            have led to expansion of customer base
                                                                          • Improvement of user-experience of VOD due to
                                      134                                   smartphone applications and high-speed Internet

                                        150                               • Growing penetration of 5G broadband influencing
                                                                            growth of VOD market
                                                195                       • Potential deals with operators

             North America to Lead Market                                Asia-Pacific is the highest growth region
    North America                 • Presence of key market        Asia-Pacific region is likely to expected to have the highest growth
   Video on Demand                  players such as Netflix,
      Market Size                                                                                                • Stricter lockdown
                                    Amazon, Alphabet, HBO,
                                                                                                                   regulations
                                    Roku etc.
                                                                                                                 • Change in
     USD                           • Highest future CAGR                                                           demand on OTT
                                   • Internet-based video                                                          platforms
     19.7                            services are growing                                                        • VOD providers
                                                                                                                   partnering with
                                     segment, represent 63% of
    billion                          total television revenues
                                   • Massive growth opportunity
                                                                                                                   movie producers
                                                                                                                   to release movies
Overview of Investment Thesis
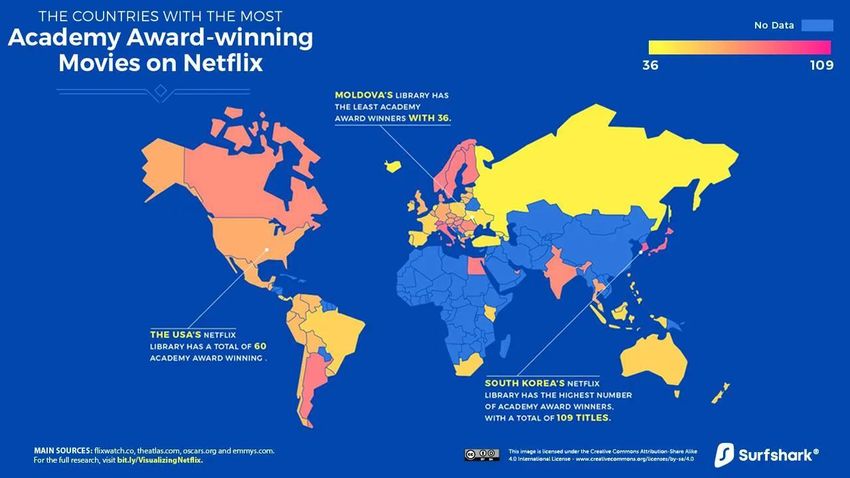
India's Golden Age of Streaming Services
Netflix’s full throttle on expansion Content is King with Japanese style animation, "anime".
Expansion to Africa
Varied Offerings to Reflect Diverse Global Perspectives
Netflix’s distinct competitive advantages Emphasis on Original Content Despite Pandemic Restrictions
cements its position as a market leader
High Quality and Quantity of Original Content
Highly Accurate Predictive Proprietary Algorithm
Renewed lockdown across Europe, Netflix’s greatest market
Short-term and long-term secular tailwinds
Uncertainty around the COVID-19 vaccine progress
intact
Rapid advent of 5G takes OTT media viewing to new heights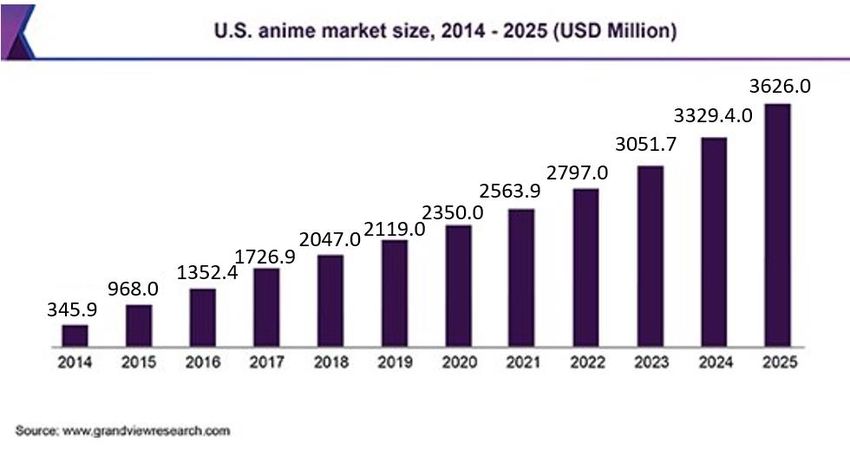
Thesis 1: Full Throttle on Expansion
                                                      India's Golden Age of Streaming Services
• Netflix spent $400 million in developing original content as well as
  licensing other content for the Indian market between 2019 and 2020.

• Strategic alliance with Jio to give free mobile-only subscription to
  postpaid plans starting at 199 rupees per month as well as free
  subscription to basic plans for Jio’s fixed broadband service to cater to the
  mass market of India.

• Industry revenues from streaming in India are set to jump from $500
  million in 2018 to as much as $5 billion in 2023.

• India Stream Fest Brings 455% December Surge

• Content investments not fully portrayed in India. Increased original
  content budget has yet to show up on the service.

• Licensing deals maturing in the near period.

• This framework suggests meaningful upside even relative to the post Q4
  run up in the stock price. Netflix is likely to account for its undisclosed
  potential upsides from the India market in the next two quarters.
Thesis 1: Full Throttle on Expansion
                                          Content is King with Japanese style animation, "anime".
• Increased viewership of more than 50% on 2019.

• Anime titles appeared in top ten lists in almost 100 countries so
  far this year.

• Netflix is exclusively streaming, producing, and making anime.

• Netflix aligns anime themes to the UCAN market, they tend to
  choose fantasy, science fiction, violence.

• The popularity of "engineered" anime into Netflix
  will potentially attract more subscribers in the UCAN, which
  would increase Paid Net Additions.

• This is accompanied by the global anime market is expected to
  grow at a compound annual growth rate of 9.1% from 2020 to
  2025 to reach USD 36.26 billion by 2025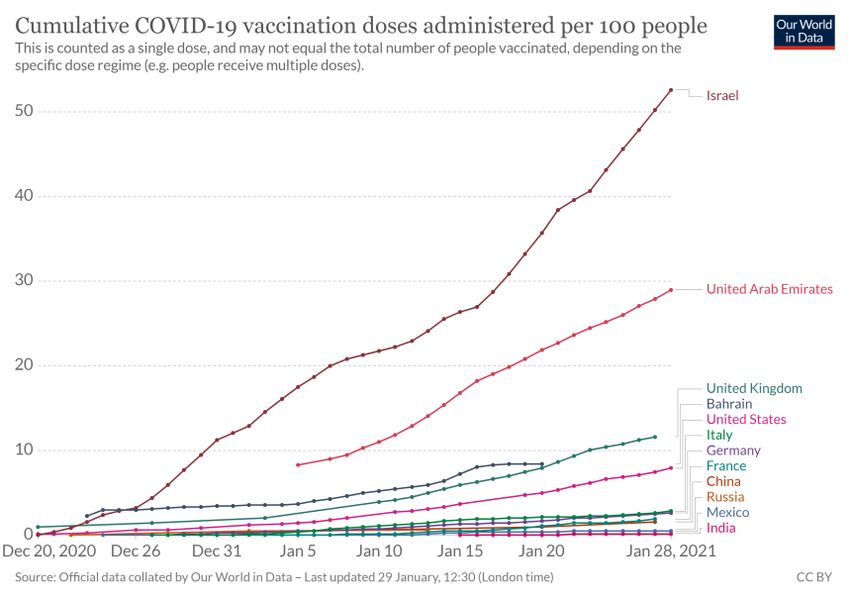
Thesis 1: Full Throttle on Expansion
                                                                                 Expansion to Africa
• Expansion to Africa:
• Kenya's E&M market is set to see growth at a 10.3% CAGR over the next five years,
  reaching nearly US$3.0 billion in 2023.
      a. Empowering African content makers and creative to tell their stories
      i. The narrative is shifted to a potential margin expansion with a heavy focus on
          local content.

       ii. Local content can account for over 90% of viewership for the mass market
           segments.

       iii. Has the power to influence cross-culturally

       b. Strategic Alliance with Telecoms:
       i. Overcome challenges including slow and expensive internet and the lack of
           proper payments infrastructure in the 55-nation continent. (By add subscription
           bills to post-paid sim cards, allow pre-downloaded streaming through wifi)

• Netflix is well positioned to capitalize on a rapidly changing global market where
  demand for diverse content is greater than ever before.

• Abundance of a “Rich cultural bed” on the continent waiting to be explored

• Africa subscribers will be attracted by the flexibility and the content that Netflix is able
  to provide. Similarly, global subscribers would have greater exposure to African content.

• The ramped up local content, alongside the strategic tie-ups with telecoms
  in West Africa would likely persuade more Africans to partake in Netflix
  Subscription services, which will in turn increase the Net Paid additions.
Thesis 2: Netflix Competitive Advantages
                                              Varied Offerings to Reflect Diverse Global Perspectives
                                                                                                        Region                   Shows Movies
         •   Netflix's content effectively reflects global perspectives                                 United States              1326 4339
             and stories. 63% of young people felt that its content                                     American Samoa             1078 4573
             more accurately reflects daily life compared to content                                    Puerto Rico                1073 3807
                                                                                                        Martinique                  803 3736
             from other streaming platforms                                                             French Guiana               803 3710
                                                                                                        Guadeloupe                  769 3731
         •   As Netflix expands internationally, it recognises an                                       Aruba                       712 3389
                                                                                                        Benin (Dahomey)             462 3171
             increasingly diverse global audience featuring a larger                                    Montserrat                  661 2967
             range of races, ages, and sexual orientations                                              British Virgin Islands      666 2940
                                                                                                        Canada                      629 2942
                                                                                                        Brazil                      562 2951
         •   Netflix also appeals to local viewers’ palettes by offering a
             different list of shows to different viewers depending on
             their geographical location, targeting demographics by
             catering to local tastes and preferences

Sources: Comparitech, Investopedia, David Deal, Varsity, PC,
Deadline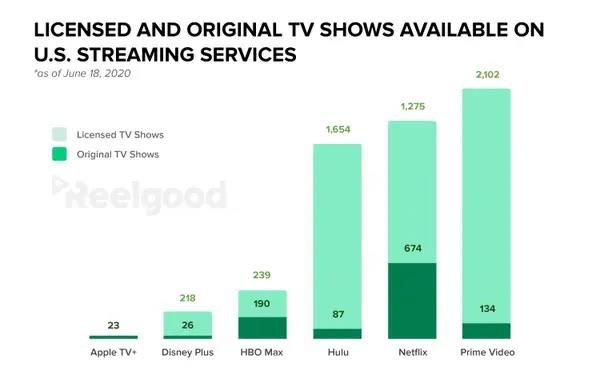
Thesis 2: Netflix Competitive Advantages
                                         Emphasis on Original Content Despite Pandemic Restrictions

         •   Netflix's growth can be attributed to its
             commitment to the creation of original content known
             as "Netflix Originals", spending over US$17 billion
             in 2020. However, this proved to be challenging for
             both Netflix and its rivals amidst the pandemic

         •   Despite this, Netflix’s originals roster has been
             relatively unaffected by production shutdowns with 50
             titles completed since the beginning of Covid-19.

         •   Netflix can carry on productions due to its set of
             meticulously crafted safety protocols, especially for
             intimate scenes, investing up to 20% more for
             production costs to carry on production. While this
             pushes production cost, the availability of new content
             is believed to accelerate growth and retention of
             subscribers

Sources: Varsity, Bloomberg, Hollywood Reporter, What’s on Netflix,
Financial Times
Thesis 2: Netflix Competitive Advantages
High Quality and Quantity of Original Content
• Netflix leads its rivals in original TV shows by a wide
margin in both quantity and quality. Netflix has 674
original TV shows, beating other major rivals like Hulu
(87) and Amazon Prime Video (134).
• This investment has also resulted in a transformation
from being a mere video streaming provider to the
premier content creator. Netflix has smashed past its
closest competitor, HBO, in terms of Emmy
Nominations in 2020 – picking up 160 compared to
HBO's 107
• Netflix has also dominated viewership from the
average person, producing 12 of the 30 most-watched
streaming video on demand (SVOD) released movies in
the U.S
Sources: Fortune, Deadline, Observer, Business Insider, ReelGoodThesis 2: Netflix Competitive Advantages
Highly Accurate Predictive Proprietary Algorithm
• Netflix uses machine learning and algorithms to help
break viewers’ preconceived notions and find shows
that they might not have initially chosen. To do this, it
looks at nuanced threads within the content, rather
than relying on broad genres to make its predictions,
distinguishing it from other streaming services
• Netflix's personalised recommendation engine
has been valued at over US$1 billion a year arising
from cost savings and customer retention, with a churn
rate of only 3.1%, the lowest amongst its major
competitors
• More than 80% of the TV shows people watch on
Netflix are discovered through the
platform’s recommendation system, further
demonstrating its accuracy in its predictive function.
Sources: Varsity, Business Insider, Bloomberg IntelligenceThesis 3: Short-term and Long-term Secular Tailwinds Intact
Renewed lockdowns in Europe suggests a possible replication of impressive historical streaming and subscription growth
• With new lockdowns re-imposed in Europe due to the spread of a new variant
of virus, this indicates a bullish outlook for Netflix in Q1 2021 given that it is a
market leader controlling over 53% of the SVOD market in Europe
• Impact of COVID-19 early 2020 has been strongly positive for SVOD demand,
with Netflix adding a record 37 million new subscribers during the year (31%
increase from 2019) despite a price hike of 29% introduced in Oct’20 →
similar growth witnessed in 2020 likely to continue in 2021
• While such growth also encompasses a pressing need for more exclusive
2019 Budgets / Releases By Studio ($M)
content to keep new subscribers satiated, Netflix already has 500+ titles
6,000 60
currently in post-production and has ambitious plans to release at least one 5,000
Netflix far surpasses its competitors
5,000 55 50
in producing more films
new original film every week in 2021
4,000 40
• Even in 2019, Netflix has been charging hard into original films, releasing 3,000 30
1,983
almost 2.5-3x the annual output of a major studio, with more than 55 2,000 20 20
17 17
1,041 890 15
movies. In 2020, Netflix has undoubtedly been more aggressive than ever, 1,000 10
773
9
750 625 606 9 10
taking advantage of the pandemic-induced movie-going standstill by buying - -
Netflix Disney Warner Universal Fox (20th Sony Lionsgate Paramount
multiple film titles Bros Century) Columbia
Estimated Studio Budget ($M) Number of Films
Sources: Bloomberg Intelligence, Netflix annual reportThesis 3: Short-term and Long-term Secular Tailwinds Intact
Uncertainty of vaccine progress adds to continued growth of subscribers
• New variants of COVID-19 from the UK that could possibly have a higher
death rate than the other variants, resulting in possible delay in vaccine
approval
• Lower efficacy rate of current COVID-19 vaccine towards newer strains
(Novavax vaccine: 95.6% for original variant vs 85.6% for new variant)
• Vaccine shortages, low willingness for vaccination amidst worries of
vaccine safety and efficacy against new variants could deter the rate at
which COVID-19 will be brought under control
• Increasing duration of lockdowns and prolonged work-from-home
arrangements
• With the probability of limited COVID-19 containment in 2021, this will
result in continued uptake of streaming services by customers, leading to
prolonged, optimistic revenue growth for Netflix as witnessed in 2020
Sources: Our World in Data, McKinseyThesis 3: Short-term and Long-term Secular Tailwinds Intact
Rapid advent of 5G takes OTT media viewing to new heights, benefitting Netflix as a key content provider
• Currently, 5G networks are still in their infancy and we believe that the rise 5G speeds far exceed 4G speeds
of 5G adoption will enable OTT platforms to draw in more viewers and get a
(for major network services providers)
Download Speed Comprison (in Mbps)
bigger slice of the pie 75.6
70 71
• With lower latency and 10x faster download speeds, 5G can transform the 67.1
53.3
user experience with VR and AR applications, powering seamless,
37.1
immersive experiences within subscribers’ favourite shows 32.5
36.3
• Apart from easing access to customers with a broadband connection, the
push for 5G could open up streaming options to at least 24 million
consumers who are not currently able to access high-quality streaming AT&T Sprint T-Mobile Verizon
services (Pew Centre, 2018) 5G Speed 4G Speed
• By utilising state-of-the-art technologies, such as VR and 8K, Netflix will be
able to offer a better-quality streaming service with increased content Increased 5G Partnerships Between
quality, improved customer satisfaction, allowing it to stay ahead in the Streaming Giants & Tech Players
streaming wars Emerging 5G adoption of content providers suggests how 5G
will likewise increasingly become a core focus for Netflix &
continue to expand its partnerships.Financial Analysis – Increasing Return on Equity
Return on Equity (%)
35.0%
Higher Return On Investor Equity YoY
29.5% 30.6% 30.1% 29.5%
29.1% 28.5%
30.0% 27.5%
• There has been an increasing return on
25.0%
17.9%
equity from FY16A to FY19A with ROE
20.0%
increasing at a decreasing rate.
15.0%
10.0% 7.6%
• While we note a trend of increasing net
5.0%
profit margin, there is a trend of
0.0%
FY16A FY17A FY18A FY19A FY20E FY21E FY22E FY23E FY24E decreasing asset turnover and hence the
increase in ROE is at a decreasing rate.
Historicals Projection
Financial Analysis FY16A FY17A FY18A FY19A FY20E FY21E FY22E FY23E FY24E • The decreasing asset turnover implies a
decreasing efficiency in the company’s
Dupont Analysis
assets to generate sales which could be
Gross Margin (%) 29.1% 31.3% 36.9% 38.3% 41.6% 43.3% 45.0% 46.8% 48.5%
reflective of the increasing competition in
Operating Margin (%) 4.3% 7.2% 10.2% 12.9% 14.6% 16.1% 18.1% 19.7% 21.4% the entertainment industry.
Net Profit Margin (%) 2.1% 4.8% 7.7% 9.3% 9.7% 10.7% 12.0% 12.9% 13.9%
Asset Turnover (x) 0.742x 0.717x 0.702x 0.672x 0.675x 0.668x 0.642x 0.604x 0.561x
Financial Leverage (x) 4.852x 5.206x 5.100x 4.676x 4.347x 4.141x 3.970x 3.854x 3.800x
Return on Equity (%) 7.6% 17.9% 27.5% 29.1% 28.5% 29.5% 30.6% 30.1% 29.5%Financial Analysis – Decreasing Liquidity Concerns but Increasing Solvency Concerns
Quick Ratio (x) Debt/Equity (x)
7.000x
Decreasing Liquidity Concerns
6.519x 2.500x
6.000x 2.350x
• Quick ratio has been increasing
2.188x
2.260x
from FY16A to FY19A which implies
4.789x 2.000x 2.128x
5.000x
1.978x 1.947x
2.046x Netflix’s increasing ability to pay off
1.814x
its short-term liabilities.
4.000x
3.421x
1.500x
3.000x • This means that Netflix has lower
2.240x chances of immediate default risk
1.255x
2.000x
1.418x 1.000x
concerns from not paying off its
1.000x 0.732x
short-term liabilities
0.516x 0.585x
0.320x
0.000x 0.500x
FY16A FY17A FY18A FY19A FY20E FY21E FY22E FY23E FY24E FY16A FY17A FY18A FY19A FY20E FY21E FY22E FY23E FY24E Increasing Solvency Concerns
Historicals Projection
• Debt/Equity ratio has been
Financial Analysis FY16A FY17A FY18A FY19A FY20E FY21E FY22E FY23E FY24E
increasing from FY16A to FY19A
Liquidity Indicators
which implies Netflix’s increasing
Current Ratio (x) 1.247x 1.403x 1.494x 0.901x 1.583x 2.472x 3.662x 5.065x 6.834x
risk of defaulting on its long-term
Quick Ratio (x) 0.320x 0.516x 0.585x 0.732x 1.418x 2.240x 3.421x 4.789x 6.519x
liabilities.
Solvency Indicators
Debt/Equity (x) 1.255x 1.814x 1.978x 1.947x 2.046x 2.128x 2.188x 2.260x 2.350xDiscounted Cash Flow – Target Price: $613.81
Revenue Drivers Historicals Projection
in thousands of USD FY15A FY16A FY17A FY18A FY19A FY20E FY21E FY22E FY23E FY24E
Revenue Growth
Revenue
• Three revenue streams up
Domestic Streaming Segment 4,180,339 5,077,307 6,153,025 7,646,647 9,243,005 11,676,425 14,846,115 18,211,878 22,664,882 27,434,714 till FY18A.
Dom Stream % YOY Growth 21.46% 21.19% 24.27% 20.88% 26.33% 27.15% 22.67% 24.45% 21.05%
• Growth in Global Streaming
Dom Stream as % of Total Revenue 61.66% 57.50% 52.62% 48.41% 45.86% 45.00% 45.30% 44.50% 44.65% 43.75%
International Streaming Segment 1,953,435 3,211,095 5,089,191 7,782,105 10,616,225 14,011,710 17,697,355 22,509,062 27,918,668 35,116,433
Int Stream % YOY Growth 64.38% 58.49% 52.91% 36.42% 31.98% 26.30% 27.19% 24.03% 25.78% Paid Memberships
Int Stream as % of Total Revenue 28.81% 36.36% 43.52% 49.27% 52.67% 54.00% 54.00% 55.00% 55.00% 56.00% forecasted to increase
Domestic DVD Segment 645,737 542,267 450,497 365,589 297,217 259,476 229,410 204,628 177,664 156,770
annually at an increasing
Dom DVD % YOY Growth -16.02% -16.92% -18.85% -18.70% -12.70% -11.59% -10.80% -13.18% -11.76%
Dom DVD as % of Total Revenue 9.52% 6.14% 3.85% 2.31% 1.47% 1.00% 0.70% 0.50% 0.35% 0.25%
rate and surpass 300m in
Total Revenue 6,779,511 8,830,669 11,692,713 15,794,341 20,156,447 25,947,611 32,772,880 40,925,568 50,761,214 62,707,917 FY23E.
Total Revenue % YOY Growth 30.26% 32.41% 35.08% 27.62% 28.73% 26.30% 24.88% 24.03% 23.54%
• Average Revenue Per Paying
Global streaming paid members at end of
period (in thousands) 70,839 89,090 110,644 139,259 167,090 200,090 235,090 273,090 315,090 362,090 Membership forecasted to
Global streaming paid net membership
increase at a constant rate
additions (in thousands) 16,363 18,251 21,554 28,615 27,831 33,000 35,000 38,000 42,000 47,000
of 7.50% annually.
Net membership additions as a percentage of
total paid members 23.10% 20.49% 19.48% 20.55% 16.66% 16.49% 14.89% 13.91% 13.33% 12.98%
Average Revenue Per Paying Membership $ 95.70 $ 99.12 $ 105.68 $ 113.42 $ 120.63 $ 129.68 $ 139.41 $ 149.86 $ 161.10 $ 173.18
Average Monthly Revenue Per Paying
Membership $ 7.98 $ 8.26 $ 8.81 $ 9.45 $ 10.05 $ 10.81 $ 11.62 $ 12.49 $ 13.43 $ 14.43
Average Monthly Revenue Per Paying
Membership % YOY Growth 3.57% 6.62% 7.32% 6.36% 7.50% 7.50% 7.50% 7.50% 7.50%Discounted Cash Flow – Target Price: $601.26
Levered Market Cap Unlevered Weighed Average Cost of Capital (WACC)
Comparable Company Name Ticker Beta (USD) Total Debt Tax rate Beta
Amazon.com, Inc. NasdaqGS:AMZN 1.20 2,221,511.9 (77,535.00) -17.75% 1.15
• Comparable companies were chosen
Apple Inc. NasdaqGS:AAPL 1.28 1,596,923.5 (122,278.00) -16.86% 1.17
on the basis of providing media
DISH Network Corporation NasdaqGS:DISH 2.00 323,515.6 (14,282.30) -41.27% 1.88
Comcast Corporation NasdaqGS:CMCS.A 1.00 235,812.2 (111,989.00) -31.47% 0.62
entertainment.
The Walt Disney Company NYSE:DIS 1.20 50,662.2 (62,323.00) 24.41% 0.62
AMC Entertainment Holdings, Inc. NYSE:AMC 2.50 454.4 (10,352.90) 0.91% 0.11 • Beta was obtained from Yahoo
Unlevered Beta 0.98 Finance which were levered beta
Netflix, Inc. NasdaqGS:NFLX 0.92
values
Netflix, Inc. NasdaqGS:NFLX 1.05 225,492.2 16,203.5 9.47% 0.98
Cost of Debt 4.24%
Risk Free Rate 1.84%
Adjusting close on 19 Jan 21
for 30 Year Treasury
• 30-years US treasury bond rate as
Equity Risk Premium 3.20% Chosen between 3% to 10%
risk-free, estimated at 1.84%
Cost of Equity using comparables derived beta 5.20%
Cost of Equity using historical beta 4.62% • Cost of Equity using comparable
WACC 4.57% Using historical beta Cost of Equity companies derived levered beta is
5.20% whereas Cost of Equity using
Netflix’s historical beta is 4.62%Discounted Cash Flow – Target Price: $601.26
Projection
Discounted Cash Flow Valuation FY20E FY21E FY22E FY23E FY24E
Discounted Cash Flow (DCF)
Total Revenue 25,947,611 32,772,880 40,925,568 50,761,214 62,707,917
EBIT 2,960,071 4,116,322 5,784,607 7,731,883 10,227,600 • Discounted Cash Flow was
Less: Tax (444,011) (617,448) (867,691) (1,159,782) (1,534,140)
NOPAT 2,516,060 3,498,873 4,916,916 6,572,101 8,693,460 projected based on a 5 year
Plus: Depreciation and amortization of Property, Equipment and Intangibles
Plus: Amortization of streaming content assets
84,783
12,050,070
110,987
14,787,123
141,040
17,943,406
175,134
21,545,902
213,584
25,766,683
horizon.
Plus: Other non-cash items 41,516 36,706 32,740 28,426 25,083
Plus (Increase)/Decrease in working capital (14,289,256) (17,646,403) (20,451,049) (23,960,966) (27,939,010)
Less: Capex (259,476) (311,342) (368,330) (431,470) (501,663) • Present Value (PV) of each year
FCF 143,697 475,944 2,214,724 3,929,127 6,258,138 and the Terminal Value (TV) of
Yearfrac 1.0 2.0 3.0 4.0 5.0 the final year was calculated to
arrive at Enterprise Value (sum
Discount Factor 0.96 0.92 0.88 0.84 0.80
PV FCF 137,415 435,240 1,936, 778 3,285,815 5,004,711
of all PVs)
FCF
Sum of FCFs 10,799,960 • Implied share price of $601.26
TV
FCF in FY24E 5,004,711
was obtained.
Perpetuity Growth 3.00%
TV in FY24E 328,026,774
PV of TV 262,327,104
Enterprise Value 273,127,064
Cost of Equity
Less: Long-Term Debt (20,662,964)
4.72% 4.67% 4.62% 4.57% 4.52%
Perpetuity Growth
Plus: Cash and Cash Equivalent 10,767,300
Implied Equity Value 263,231,400 2.90% 530.29 547.10 564.87 583.66 603.57
Basic Shares Outstanding as of FY 2019 437,799 2.95% 545.96 563.71 582.50 602.41 623.55
Implied Share Price 601.26 3.00% 562.57 581.35 601.26 622.40 644.88
3.05% 580.21 600.11 621.25 643.74 667.71
Current Share Price (as of 19 Jan) 497.98 3.10% 598.97 620.11 642.60 666.58 692.19
Potential Upside 20.74%Multiple Analysis (TEV/EBIT) – Target Price: $476.38
Comparable Company Name Ticker TEV/ EBIT Multiple Analysis – TEV/EBIT
Amazon.com, Inc. NasdaqGS:AMZN 84.5
Apple Inc. NasdaqGS:AAPL 35.2 • Comparable companies were chosen on the
DISH Network Corporation NasdaqGS:DISH 11.4
Comcast Corporation NasdaqGS:CMCS.A 17.9 basis of providing media entertainment.
The Walt Disney Company NYSE:DIS 73.8
AMC Entertainment Holdings, Inc. NYSE:AMC NM
• TEV/EBIT multiples for comparable companies
Netflix, Inc. NasdaqGS:NFLX 10.2
were obtained from CapitalIQ .
Highest TEV/EBIT 100th Percentile 84.5
Middle TEV/EBIT
Lowest TEV/EBIT
75th Percentile
50th Percentile
73.8
35.2
• Upper limit TEV/EBIT range was set at 100th
percentile, middle or target TEV/EBIT was set
Netflix EBIT for FY20E 2,960,071
at 75th percentile and lower limit TEV/EBIT was
Highest Netflix TEV 250,125,962 set at 50th percentile.
Middle Netflix TEV 218,453,207
Lowest Netflix TEV 104,194,484
• From the analysis, a range of $215.39 to
Highest Netflix Enterprise Value 240,230,298
Middle Netflix Enterprise Value 208,557,543 $548.72 was derived.
Lowest Netflix Enterprise Value 94,298,820
Basic Shares Outstanding as of FY 2019 437,799
Highest Netflix Implied Share Price 548.72
Middle Netflix Implied Share Price 476.38
Lowest Netflix Implied Share Price 215.39Football Field Valuation Range
52 Week
298.84 556.55
High Low
Analyst
550.00 660.00
Estimates
DCF 530.29 692.19
Valuation
TEV/ 215.39 548.72
EBIT
497.98 600.00
0 100 200 300 400 500 600 700 800
Lowest Range Highest Range Current Price Target PriceESG Factors
Strong tailwinds in ESG – Netflix postured for growth
Key Trends Netflix ESG Score
➢ Growing pressure from ➢ Environmental: In 2019, the company has
Governments, NGOs, managed to change to 50% clean ESG Rating 18.2 (Low Risk)
businesses, and consumers electricity use by installing numerous
to adopt sustainable wind turbines and solar panel systems. Industry:
practices Netflix is planning by 2022 to raise this Media 168 out of 266
number to 80% and by 2025 intend to
➢ Greater transparency owing use 100% clean energy Global
to releasing of relevant Universe 1865 out of 12844
sustainability ➢ Social: Conscious effort in ensuring
reports/practices and the rise representation and diversity of workforce
of credible rating agencies to (women, black etc)
audit such companies (eg.
Sustainalytics, Thomson ➢ Governance: Maximize long-term
Source: Sustainalytics (Morningstar)
Reuters, RobecoSAM, GRESB, shareholder value by ensuring intellectual
SASB) property (IP) protection Accurate as of Dec 22, 2020Investment Risks
Business model leaves Netflix susceptible to consumer demands and external threats
✓ Netflix derives their revenue purely from their 3 subscriptions plans offered
Single source of income ✓ Unable to generate more income from existing user base
✓ An unexpected shift in demand will prove detrimental to their balance sheets
✓ Huge initial outlay needed for content licensing and original content production
High Upfront Costs ✓ Price hikes in service due to rising costs, resulting in dissatisfied customers
✓ Large amounts of debt taken to finance the costs needed, increasing default risk
✓ Apple, Disney+, Amazon Prime Video, HBO threaten Netflix’s market share
Tough Competition and position in the saturated digital streaming industry
✓ Piracy/Illegal content downloading and use of VPN remains a growing concern
✓ Regulations revolving around data collection practices and anticompetitive
behavior could potentially pose more issues for Netflix in the future
Tightening Regulations ✓ Controversial rulings (e.g. in EU) can lead to unnecessary tax liabilities
✓ Netflix is also not available in all countries, with restrictions and
censorship limitations in more than 130 countries
Currency Rates ✓ Vulnerable to fluctuating exchange rates in countries they are operating inYou can also read