LETTER Trace metal contents of autotrophic flagellates from contrasting open-ocean ecosystems
←
→
Page content transcription
If your browser does not render page correctly, please read the page content below
Limnology and Oceanography Letters 7, 2022, 354–362
                                                                                    © 2022 The Authors. Limnology and Oceanography Letters published by Wiley Periodicals LLC
                                                                                                   on behalf of Association for the Sciences of Limnology and Oceanography.
                                                                                                                                                      doi: 10.1002/lol2.10258

LETTER
Trace metal contents of autotrophic flagellates from contrasting
open-ocean ecosystems
Laura E. Sofen ,1* Olga A. Antipova ,2 Michael J. Ellwood ,3 Naomi E. Gilbert,4 Gary R. LeCleir,4 Maeve C. Lohan,5
Claire Mahaffey,6 Elizabeth L. Mann,1a Daniel C. Ohnemus,1b Steven W. Wilhelm ,4 Benjamin S. Twining 1
       1
        Bigelow Laboratory for Ocean Sciences, East Boothbay, Maine; 2X-Ray Science Division, Advanced Photon Source,
       Argonne National Laboratory, Lemont, Illinois; 3Research School of Earth Sciences, Australian National University,
       Canberra, Australia; 4Department of Microbiology, The University of Tennessee, Knoxville, Tennessee; 5Ocean and Earth
       Sciences, National Oceanography Centre, University of Southampton, Southampton, UK; 6Department of Earth, Ocean,
       and Ecological Sciences, University of Liverpool, Liverpool, UK

    Scientific Significance Statement
    Phytoplankton require iron, zinc, and other trace metals to grow. These nutrients are in short supply in many open-ocean
    regions where small autotrophic flagellates are important members of the ecosystem. Little is known about these cells’ trace
    metal contents, despite many studies about the trace metal concentrations in larger phytoplankton. Across four open-ocean
    regions with differing levels of nutrients, we found that small, non-diatom eukaryotic phytoplankton maintain relatively low
    Fe concentrations, even when Fe is available in excess, a strategy that may give them a competitive advantage against plank-
    ton with higher metal demands. In addition, both Fe and Zn concentrations appear to be controlled as much by macronutri-
    ent availability as by trace metal availability.

             Abstract
             Nano- and picophytoplankton are a major component of open-ocean ecosystems and one of the main plankton
             functional types in biogeochemical models, yet little is known about their trace metal contents. In cultures of
             the picoeukaryote Ostreococcus lucimarinus, iron limitation reduced iron quotas by 68%, a fraction of the plastic-
             ity known in diatoms. In contrast, a commonly co-occurring cyanobacterium, Prochlorococcus, showed variable

*Correspondence: lsofen@bigelow.org; btwining@bigelow.org
a
    Present address: Ronin Institute for Independent Scholarship, Portland, Maine
b
    Present address: Skidaway Institute of Oceanography, Savannah, Georgia

Associate editor: Angelicque White

Author Contribution Statement: L.E.S. and B.S.T. co-led the manuscript effort. B.S.T., D.C.O., and M.J.E. collected the samples from the Southern
Ocean. M.C.L., C.M., and E.L.M. collected the samples from the Atlantic Ocean. M.C.L. and C.M. designed the incubation experiment in the Atlantic.
G.R.L. and N.E.G. designed the incubation experiment in the Southern Ocean. E.L.M. designed the culture study. B.S.T., E.L.M., and D.C.O. processed
data and summarized findings. N.E.G. conducted the transcriptomic analysis. O.A.A. processed the synchrotron data. L.E.S. and B.S.T. prepared the man-
uscript, which was revised by M.J.E., N.E.G., G.R.L., M.C.L., C.M., E.L.M., D.C.O., and S.W.W.
Data Availability Statement: Cellular elemental content data and metadata are available at https://doi.org/10.5281/zenodo.5191479. Transcriptomic
data is available at https://genome.jgi.doe.gov/portal/Iroenrcoassembly_FD/Iroenrcoassembly_FD.info.html, https://genome.jgi.doe.gov/portal/
Envwatcoassembly_FD/Envwatcoassembly_FD.info.html, and https://genome.jgi.doe.gov/portal/Algbacmetcycling/Algbacmetcycling.info.html.

Additional Supporting Information may be found in the online version of this article.

This is an open access article under the terms of the Creative Commons Attribution License, which permits use, distribution and reproduction in any
medium, provided the original work is properly cited.

                                                                             354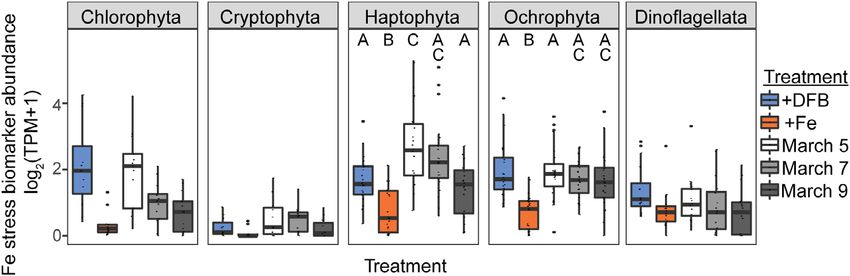
Sofen et al.                                                                                              Metal quotas of small flagellates

          iron contents with iron availability in culture. Synchrotron X-ray fluorescence was used to measure single-cell
          metal (Mn, Fe, Co, Ni, Zn) quotas of autotrophic flagellates (1.4–16.8-μm diameter) collected from four ocean
          regions. Iron quotas were tightly constrained and showed little response to iron availability, similar to cultured
          Ostreococcus. Zinc quotas also did not vary with zinc availability but appeared to vary with phosphorus availabil-
          ity. These results suggest that macronutrient and metal availability may be equally important for controlling
          metal contents of small eukaryotic open-ocean phytoplankton.

       Biogeochemical models are crucial for understanding                contents of such cells from four open-ocean regions with con-
ocean function and predicting responses to changing environ-              trasting nutrient availability. Deckboard incubation experi-
mental conditions. A key component of ocean models is how                 ments provide additional insight into cell nutrient status. This
they parameterize nutrient uptake and storage (Flynn 2010).               work helps inform biogeochemical models by constraining
Iron availability controls phytoplankton abundance and com-               the chemical composition of a dominant phytoplankton
munity composition in much of the ocean (Moore et al. 2013),              group in open-ocean regions.
but uncertainties associated with parameters describing biologi-
cal Fe processes drive large variability in predictions of future
production across trophic levels (Tagliabue et al. 2020).
                                                                          Methods
    Leading biogeochemical models represent phytoplankton                    We determined the metal contents of an isolate of the
communities with three functional types—diatoms, pico-/                   picoeukaryote Ostreococcus lucimarinus (CCMP 3630) using ICP-
nanophytoplankton, and small diazotrophs (Moore et al.                    MS (full details in Supporting Information S1). Ostreococcus were
2018; Tagliabue et al. 2020; Stock et al. 2014)—but measure-              grown under trace metal clean conditions (Cohen et al. 2018) in
ments of micronutrient requirements have typically focused                low-Ni B1 media at 100 μmol photon m2 s1 irradiance under
on diatoms and, to a lesser extent, cyanobacteria. The pico-/             both Fe-replete (100 nM total Fe, 1.2 nM Fe0 ) and Fe-limited
nanophytoplankton, many of which are flagellated and will                  (7.5 nM total Fe, 86 pM Fe0 ) conditions (see Supporting
be referred to hereafter as “flagellates,” dominate open-ocean             Information S1 for culturing details). In addition, two strains of
ecosystems (Hirata et al. 2011) and may have unique biogeo-               Prochlorococcus, MED4 (CCMP 2389) and MIT9312 (CCMP
chemical roles. For example, Phaeocystis plays a key role in              2777), were cultured to compare the responsiveness of Fe quotas
the global sulfur cycle by contributing disproportionately to             in this picoeukaryote competitor. The cyanobacteria were grown
DMS production (Wang et al. 2015). These taxa are thought                 in the same media and Fe concentrations as Ostreococcus but at
to efficiently compete for scarce dissolved nutrients (Cuvelier            60 and 200 μmol photon m2 s1 irradiance.
et al. 2010), yet less is known about their metal physiology                 Phytoplankton samples were collected at or below the surface
than that of diatoms and cyanobacteria.                                   mixed layer (SML) on three cruises of opportunity that covered
    Data available for open-ocean flagellate strains suggests that         a range of Fe, Zn, and macronutrient availability (Fig. 1A). Sam-
this group may be less responsive to metal gradients than dia-            ples from the Atlantic Ocean were collected aboard the RRS
toms or dinoflagellates. Iron quotas of cultured Pelagomonas               James Cook (cruise JC150) from 26 June 2017 to 12 August 2017
calceolata, a small flagellate isolated from the North Pacific              (details provided by Artigue et al. 2020 and Kunde et al. 2019).
Ocean, showed limited physiological plasticity (Sunda and                 We sampled from 40 m at stations at the western end of an
Huntsman 1995), while Fe quotas of diatoms in the same study              Fe-dust gradient (22 N, 54 W; Western Atlantic, high dFe, SML
varied 100-fold. Iron quotas of small flagellated autotrophs               22 m) and the eastern end (22 N, 31 W; Eastern Atlantic, low
from the equatorial Indian and Pacific Oceans also showed                  dFe, SML 38 m). Samples from a transect of the Indian Ocean
muted (ca. twofold) responses to natural and amended dFe gra-             were collected from 20 m aboard the R/V Roger Revelle (cruise
dients, respectively, (Twining et al. 2011, 2019). In the subarc-         RR1604) during the GO-SHIP IO9N cruise from 22 March 2016
tic Pacific, growth rates of small (< 5 μm) phytoplankton are              to 24 April 2016, as described previously (Twining et al. 2019).
less restricted by Fe limitation than those of diatoms both in            The Southern Ocean Time Series site (140 E 47 S), located in
silico and in the field (Zhang et al. 2021). Thus, small flagellate         sub-Antarctic waters, was sampled at the SML (15, 30, or 40 m)
taxa may gain ecological advantage through effective competi-             multiple times from 5 to 18 March 2018 aboard the RV Investiga-
tion for scarce nutrients rather than through physiological plas-         tor (cruise IN2018_V02). On each cruise, phytoplankton were
ticity and nutrient storage capacity.                                     collected for single-cell trace metal analysis using trace metal
    To address the paucity of data on the response of Fe quota            clean techniques (Twining et al. 2019; detailed methods in
to Fe limitation in smaller phytoplankton, we cultured a glob-            Supporting Information S1).
ally abundant picoeukaryote and a commonly co-occurring                      Cellular metals were analyzed following published methods
prokaryote. We then compared metal quotas of small open-                  (Twining et al. 2019) at the Advanced Photon Source, Argonne
ocean autotrophs to understand the extent of variation in                 National Laboratory microprobe beamline 2-ID-E. Cellular ele-
chemical composition in natural settings. We report metal                 mental concentrations (Fig. S6, Sofen and Twining 2021) were

                                                                    355
Sofen et al. Metal quotas of small flagellates
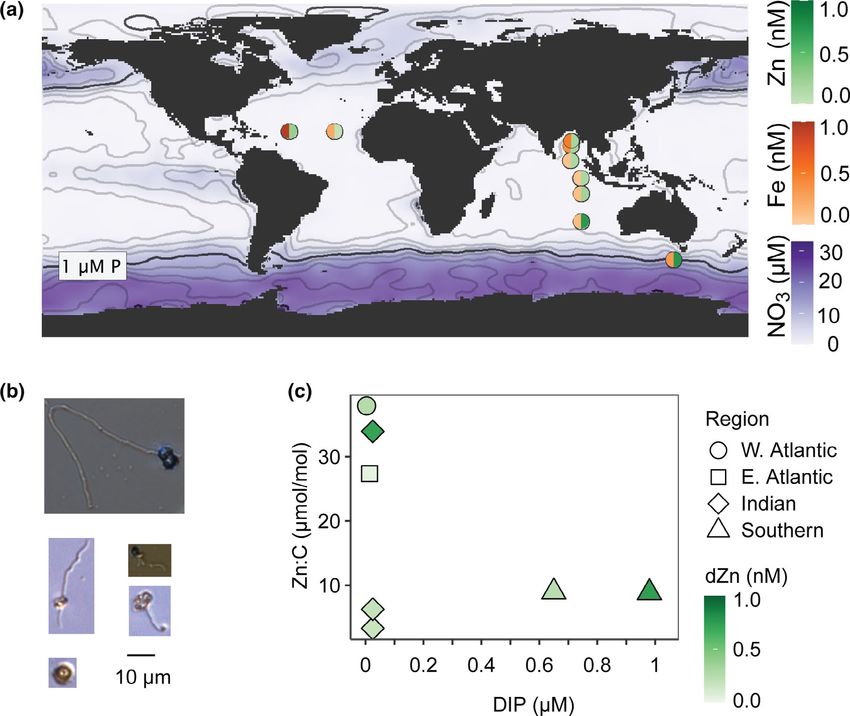
Fig. 1. Biogeochemical context. (A) Nutrient regimes. Cells were analyzed from different regions across a range of nutrient concentrations: Nitrate
(background shading), phosphate (0.25 μM contours), dFe (left half-circle), and dZn (right half-circle). (B) Representative cells, light microscope images.
Morphological features were compared to known traits of common nanoplankton classes. (C) Geometric mean cellular Zn quotas as a function of dis-
solved inorganic phosphorus (DIP) and Zn availability (shading). Indian Ocean DIP was below the detection limit (50 nM) and is plotted at 25 nM.
normalized to cellular C contents, which were calculated from the Southern Ocean, bottles were amended with Fe or the Fe
cell volume using the relationship of Menden-Deuer and chelator desferrioxamine B (DFB) to adjust Fe availability
Lessard (2000). Light microscope images (Fig. 1B) were compared (Gilbert et al. 2022). Eukaryotic transcript profiles were queried
to published texts (Tomas 1997; Scott and Marchan 2005) to for the Fe stress markers fld (flavodoxin), fea1 (Fe-assimilating
confirm that the analyzed cells were consistent with common protein), and PETE (plastocyanin), proteins produced by algae
nano- and picoeukaryote classes from these regions. in response to cellular Fe deficiency (Roche et al. 1996; Erdner
On each cruise, deckboard incubations were conducted to and Anderson 1999; Peers and Price 2006; Behnke and
assess the physiological state of resident phytoplankton. Full LaRoche 2020).
details are available in Supporting Information S1 (Atlantic and
Southern Oceans) and Twining et al. (2019, Indian Ocean). In
Results and discussion
the Atlantic and Indian Oceans, bottles were amended with
FeCl3, ZnCl2, nitrate, or a combination of these. In the Atlantic, Response of picoplankton Fe quotas to Fe availability in
culture
community responses in chlorophyll a (Chl a) and alkaline
Although limited data suggest that small phytoplankton
phosphatase activity (APA) were measured for all incubations,
may lack the high plasticity of Fe quotas seen in diatoms and
and cellular metal quotas were measured from select incuba-
large flagellates (Table S2; Sunda and Huntsman 1995), the
tions (W. Atlantic: 2 μM nitrate and 2 μM nitrate + 1 nM Zn;
paucity of quota data for these smaller taxa limits our under-
E. Atlantic: unamended control, 0.5 nM Fe, and 0.5 nM Zn). In
standing of how generalizable this trend is. To address this,
356Sofen et al. Metal quotas of small flagellates
we investigated the Fe plasticity of a model picoeukaryote in varied 14-fold between regions and was low in the Southern
culture. We measured Fe content of O. lucimarinus grown in Ocean (0.15–0.35 nM), Indian Ocean (0.07–0.49 nM), and
both Fe-replete and Fe-limited media. O. lucimarinus is among Eastern Atlantic (0.23 nM) but high in the Western Atlantic
the smallest known eukaryotic phytoplankton and was iso- (0.95 nM). Dissolved Zn was high in the Southern Ocean
lated from the North Pacific. It reduces its cellular Fe contents (0.24–0.74 nM), moderate in the Indian Ocean (0.15–0.21 nM
under Fe-limitation (Botebol et al. 2017). When grown under at five stations; 0.72 nM at one station) and Western Atlantic
Fe-limited conditions, O. lucimarinus growth was reduced by (0.25 nM), and low in the Eastern Atlantic (0.04 nM).
33% (0.59 0.01 d1, mean SD) relative to replete Fe Cellular Fe quotas of small flagellates from these four regions
(0.86 0.08 d1), and its Fe quota was reduced by 68%, from were strikingly consistent over the 14-fold range of dFe
28 7 to 9 6 μmol Fe mol C1 (Fig. 2C, Table S2). Iron (Fig. 2A). Iron quotas did not vary significantly between regions
quotas for the Fe-replete culture were 38% lower than (Tables 1 and S1, p = 0.37) nor with dFe (p = 0.39), similar to
reported quotas for Emiliania huxleyi in replete media the muted responses of the model species Ostreococcus and
(45 μmol Fe mol C1), and substantially lower than maximum P. calceolata in culture. This contrasts with the large ranges of
quotas in diatoms (68–300 μmol Fe mol C1), while quotas for quotas previously shown for cultured diatoms and larger flagel-
the Fe-limited culture were slightly higher than E. huxleyi and lates under varying dFe (Sunda and Huntsman 1995). The nar-
comparable to diatoms in limited media (3 and 10 μmol Fe row range of quotas we observed also contrasts with the large
mol C1, respectively; Sunda and Huntsman 1995). This fur- variability in quotas previously observed for similar flagellated
ther supports that at least some small open-ocean phytoplank- cells across a dFe gradient from coast to open ocean, over which
ton taxa show reduced plasticity of Fe quotas. This may be flagellate community composition likely shifted (Twining
due to differences in Fe storage capacity; for example, a related et al. 2021). Quotas measured here match the open-ocean com-
Ostreococcus strain (Ostreococcus tauri) uses the Fe storage pro- munities from that study (10 μmol Fe mol C1, Fig. 2A) and
tein ferritin for short-term Fe cycling rather than for long- from an upwelling zone of the equatorial Pacific (14 μmol Fe
term storage (Botebol et al. 2017). mol C1, Twining et al. 2011), despite much higher dFe at some
Ostreococcus Fe quotas were compared to those of of our stations. Measured quotas are smaller and more con-
Prochlorococcus marinus, a cyanobacterium that is abundant in the strained than another study in the Atlantic: they are less than
low- and mid-latitude open ocean and a competitor to small fla- half the cellular concentrations previously measured in slightly
gellates. Procholorococcus partitions into distinct ecotypes—with larger autotrophic flagellates from GA03 cruise (35 2 μmol Fe
unique responses to Fe limitation (Rusch et al. 2010)—along envi- mol C1, Twining et al. 2015). This may also be due to taxo-
ronmental gradients. Under moderate irradiance (60 μmol nomic differences (cells in the previous study were slightly
photon m2 s1), the MED4 strain of Prochlorococcus had similar larger) or due to seasonal changes in growth rate, as previous
Fe concentrations (32 μmol Fe mol C1) to Ostreococcus grown in work occurred in the winter when growth rates were likely
replete Fe and showed hardly any variation in Fe:C as a function lower, potentially lowering metal demand but also growth dilu-
of growth rate (Table S2, Fig. S3, detailed discussion in Supporting tion of Fe quotas. Flagellate quotas in the Atlantic are also lower
Information S1). In contrast, quotas of another Prochlorococcus than quotas in several co-occurring Synechococcus cells
strain, MIT9312, were reduced ca. twofold as growth rate was lim- (30 4 μmol Fe mol C1). In addition, they are lower than the
ited by Fe, from 27 to 14 μmol Fe mol C1. Neither strain showed maximum quota parameter in the biogeochemical model
significant differences in Fe quota under high irradiance PISCES-v2 (Fe:Cmax = 40 μmol Fe mol C1) but not far from the
(200 μmol photon m2 s1) in replete media. MED4 and another model’s optimal quota (7 μmol Fe mol C1, Aumont
Prochlorococcus strain, MIT1214, have previously been found to et al. 2015). While the specific taxonomic groups comprising
take up additional iron after Fe repletion was achieved (Shire and these flagellate populations may vary between regions, the con-
Kustka 2015). This luxury uptake and the variable Fe content in sistency shown by this common phytoplankton functional type
one strain that we measured (MIT9312) are slightly muted com- is remarkable.
pared to diatoms but much more variable than the consistently Deckboard incubations and transcriptomic measurements
low Fe quotas that we observed in another strain (MED4) and were used to assess the Fe status of the same open-ocean com-
Ostreococcus in culture. This highlights the surprising lack of plas- munities we analyzed for Fe contents, with the goal of
ticity in Ostreococcus, and led us to investigate natural communi- assessing whether the observed low plasticity was due to phys-
ties of similar taxa to understand whether this response was iological Fe demand or to Fe availability. We saw little evi-
generalizable. dence for Fe limitation in the phytoplankton community
from the low-dFe East Atlantic: Chl a concentrations (Fig. S2a)
Response of Fe quotas to Fe availability in natural did not change with Fe addition, nor did Fe quotas (Fig. 2B).
environments In the Indian Ocean, chlorophyll concentrations did not
Sampling locations spanned a range of nutrient concentra- change significantly even as Fe quotas increased fourfold
tions (Fig. 1A). The Southern Ocean had high N and P, while upon Fe addition (Twining et al. 2019). We used trans-
the other three regions had low macronutrients. Dissolved Fe criptomics to evaluate the physiology of Southern Ocean
357Sofen et al. Metal quotas of small flagellates
(a) 125
Cell Size
cellular Fe:C (µmol mol-1)
100 Pico
nt
adie Nano
ea n gr
75 e n oc
−op Region
stal
coa W. Atlantic
50 E. Atlantic
Indian
Southern
25 open ocean E. Pacific
0
0.00 0.25 0.50 0.75 1.00 1.25
dFe (nM)
(b) 40 (c) 40 O. lucimarinus
cellular Fe:C (µmol mol-1)
cellular Fe:C (µmol mol-1)
30 W. Atlantic 30
t0
20 48 h 20
E. Atlantic
t0
10 10
48 h
0 0
Control +N + Fe 0.00 0.25 0.50 0.75 1.00
-1
Treatment Growth rate (d )
Fig. 2. Cellular Fe quotas across natural and artificial nutrient gradients. (A) Geometric mean ( SE) Fe quotas of small flagellates across open ocean
regions of different dFe concentrations (open symbols) and along a coastal-open ocean gradient in the E. Pacific (filled symbols, 1.6–16.6 μm cells; Twin-
ing et al. 2021). Regressions of each data set (black lines) and 95% CI (gray shading) are shown. (B) Response of flagellate Fe quotas to 2 μM nitrate and
0.5 nM Fe addition (mean SD, n = 3), E. Atlantic treatments (green) are not statistically different, W. Atlantic treatments (yellow) are different
(p = 0.01). (C) Cultured O. lucimarinus quotas in limited (7.5 nM FeT) and replete (100 nM FeT) culture (mean SD, n = 3; t(4) = 2.8, p = 0.03).
communities. The expression levels of fld, fea1, and PETE is little variability in cellular Fe concentration in potentially
genes encoding common markers of cellular Fe-stress Fe-stressed flagellates, like the non-Fe limited flagellates from
(flavodoxin, Fe-assimilating protein, and plastocyanin, respec- the Atlantic. These open-ocean flagellate communities may
tively), were compared between in situ samples and incuba- gain ecological advantage through effective competition for
tions with added Fe (“high Fe”) or added DFB (“low Fe”). low nutrients rather than through physiological plasticity and
Expression of PETE by dominant phytoplankton groups did nutrient storage.
not vary with Fe availability. Meanwhile, expression of fld and
fea1 show that at least some groups (Haptophyta and Response of metal quotas to macronutrient availability in
Ochrophyta) were likely experiencing Fe-stress, indicated by natural environments
similar elevated expression of fld and fea1 in the low-Fe incu- While flagellate quotas showed little response to dFe, we
bation and in situ surface samples (Fig. 3). However, despite did observe a response to macronutrients. Eukaryotes require
this apparent Fe stress, quotas of this community approached Fe to assimilate nitrate (Schoffman et al. 2016), so Fe quotas
the values associated with maximum growth in Fe-replete cul- may increase with higher nitrate assimilation. Picoeukaryotes
ture. Notably, the minimum Fe quotas we measured are not as in the Sargasso Sea have been shown to use nitrate even at
low as the minimum quotas reported for Southern Ocean dia- low concentrations (Fawcett et al. 2011); nonetheless, the
toms in Fe-limited culture (0.4 μmol Fe mol C1 at relief of N limitation by addition of excess nitrate could stimu-
Fe0 = 0.03 pM, Strzepek et al. 2011). It thus appears that there late cells to take up and reduce additional nitrate. Following
358Sofen et al. Metal quotas of small flagellates
Table 1. Geometric least squares mean ( 1SE) trace metal quotas in pico- and nanoplankton cells (μmol TM Mol C1) from this
study and others, measured by SXRF.
Location Cell type Mn:C n Fe:C n Co:C n Ni:C n Zn:C n
W. Atlantic Nano 2.1 1a,b 4 6.2 4 4 1.2 0.5a,b 3 2.5 1a,b 5 35 19b 5
W. Atlantic Pico 3.6 2 7 18 5 7 6.1 2 4 31 5 49 17b 7
E. Atlantic Pico 2.7 0.7 13 12 2 15 3.0 0.7 8 3.9 1 14 27 4.9b 15
Indian Nano 0.7 0.1a 18 5.0 1 18 0.6 0.09a 18 0.51 0.1a 17 6.8 1.5a 17
Indian Pico 1.5 0.3 16 8.8 2 19 1.2 0.3 16 1.3 0.4 18 7.6 2.4a 18
Southern Nano 3.1 0.6b 20 6.5 1 19 1.1 0.2b 15 1.4 0.4b 19 9.1 1.4a 19
N. Atlantic* 3.2 0.4 35 2 0.92 0.11 1.6 0.3 25 3
E. Pacific† 74 60 12 5 60 3.3 0.6 58 40 10 61
N. Atlantic Syn 92 8 30 4 5 13 5 8 64 16 8
Phytoplankton cell type is abbreviated nano = nanoeukaryotes, pico = picoeukaryotes, Syn = Synechococcus; n refers to number of individual cells. Super-
scripted letters indicate significantly different groups (post hoc Tukey HSD) within each size class for this study. Iron quotas were not significantly different
across regions within either size class. Mn, Ni and Co picoplankton quotas were not significantly different across regions.
*Autotrophic flagellates (Twining et al. 2015).
†
Offshore > 2 km (Twining et al. 2021).
Fig. 3. Iron status of Southern Ocean flagellate communities. Comparison of the normalized expression (log2[TPM + 1], transcripts-per-million) of the most
abundant iron stress genes, Flavodoxin and Fea, for each plankton class across low Fe (added DFB), high Fe (added Fe), and in situ surface samples (15 m). Protein
sequences were queried against a database of one Fea and five Flavodoxin PFAMs; hits with an e-value threshold < 1010 were further filtered to those genes rep-
resenting > 1% of total transcriptome abundance. Significantly different transcript abundances between treatments were found among all taxa except dinoflagel-
lates (Kruskal–Wallis p < 0.05), with letters indicating groupings detected by post hoc Dunn’s test.
nitrate addition to the high-Fe, oligotrophic W. Atlantic, Indian Ocean were in the lowest regional grouping. Quotas of
Fe quotas doubled from 13 1 to 25 1 μmol Fe mol C1 Mn, Zn, and Co varied slightly across regions. Like Fe, quotas
(Fig. 2B, p = 0.01) and bulk Chl a concentrations increased of Mn, Ni, and Zn were low and fairly constrained compared to
(Fig. S2). This region has sufficient dFe available for cells to the known ranges of other groups (Twining and Baines 2013).
take up more Fe when needed, and cells may maintain a lower Quotas in a limited number of co-occurring Synechococcus that
Fe quota when not meeting the demand of high nitrate assim- we analyzed were higher than the flagellates (Table 1).
ilation. Macronutrients may thus be as important as trace Our samples spanned a range of dZn (Fig. 1), and we also
metal availability for controlling the metal contents of small examined relationships of Zn quotas with dZn, region, and
autotrophic flagellates, within the context of low physiologi- macronutrient availability. As for Fe, we saw little evidence for
cal plasticity. Zn limitation: Chl a concentrations increased with N, N + Zn,
In addition to Fe, we measured other biogenic metals in or N + Fe addition, but not with Zn addition alone (Fig. S2a).
small flagellates (Table 1). The quotas of other trace elements Zinc quotas were not directly related to Zn concentration
were more similar than Fe to quotas previously measured (p = 0.34) but were higher at stations with greater Zn avail-
in small flagellates in the North Atlantic during a winter ability in Indian Ocean, where dissolved inorganic phospho-
study (Twining et al. 2015) and in the equatorial Pacific rus (DIP) concentrations were low (Fig. 1C). In regions of low
(Twining et al. 2011; Fig. S4). For all metals, quotas in the DIP, plankton access dissolved organic phosphorus using
359Sofen et al. Metal quotas of small flagellates
(a) E. Pacific
et al. 2021). We found a weak negative relationship between
open ocean coast Fe quota and cell volume (log(Fe:C) = 1.1–0.14log[volume]),
but cell volume could only explain 4% of the variability in
(b) quotas (R2 = 0.04, p = 0.03). These trends are also true of
O. lucimarinus
three other biologically active trace metals: Mn, Ni, and Co
limited Fe replete Fe are twice as high in picoeukaryotes as nanoeukaryotes, a
difference that is statistically significant (p = 0.01, 0.03, and
(c) 8 Picoeukaryotes
6 0.0003, respectively) yet small relative to the variance within
4 each group (Table S3). Zinc quotas were not statistically differ-
2 ent between sizes (17 6 [pico] and 15 6 [nano] μmol Zn
# cells
0 mol C1, p = 0.6). Considering these size classes as one group
8 Nanoeukaryotes for our analysis afforded us greater statistical power than using
6 unbalanced size-segregated data to compare across regions.
4 The metal contents of these size classes are more similar to
2 one another than to other groups, justifying their representa-
0 tion by one functional type while also presenting opportuni-
1 10 100 ties for further studies to resolve taxonomic differences.
-1
cellular Fe:C (µmol mol )
Implications
Fig. 4. Iron quotas in pico- and nanoeukaryotes. (A) Cell quotas of small The relatively narrow ranges of quotas found for small fla-
autotrophic flagellates across a transect from coastal ecosystems to open gellates across a broad range of dFe suggest that physiological
ocean in the East Pacific (EPZT) as reported by Twining et al. (2021). (B) and ecological traits of small autotrophic flagellates are distinct
Geometric mean ( SD) cell quotas of O. lucimarinus cultured in limited from cyanobacteria, diatoms, and even larger flagellated photo-
(triangle) and replete (circle) Fe media (n = 3). (C) Cell quotas of pico- trophs. In natural plankton assemblages and in culture, small
and nanoeukaryotes from four open ocean regions (histograms, geomet-
ric means as dashed lines).
flagellates operated at the lower range of Fe quotas typically
observed for diatoms. This is an important distinction since
our current understanding of phytoplankton metal physiology
alkaline phosphatases (Duhamel et al. 2021), which incorpo- comes mostly from work with diatoms, but smaller taxa also
rate Zn, Co, or in the case of bacteria, Fe. Previous studies play a key role in the ecology and chemistry of these regions.
have shown limited responses of APA to metal addition in Remaining questions regarding specific physiological adapta-
communities that are limited by both DIP and the cofactor tions of different taxa within this diverse group of small flagel-
metal (Mahaffey et al. 2014; Browning et al. 2017). In our lates, as well as further field studies of single-cell diazotroph
work, whole community APA at either terminus of the Fe-dust responses to metal availability, will require new methods that
gradient showed no significant response to Zn or Fe addition can pair biological classification and chemical measurements.
(Fig. S2b), and cellular Fe and Zn quotas of small flagellates in These findings can be used to update parameters in biogeo-
these treatments also did not increase above the control (Figs. S6, chemical models to reflect the distinct physiology of pico-/
2B), consistent both with previous phosphatase studies nanophytoplankton to better constrain predictions of future
(Mahaffey et al. 2014; Browning et al. 2017) and with other evi- productivity under changing environmental conditions.
dence (Chl a and quota responses) that these trace metals were
not limiting. Thus, like nitrate, phosphate availability may influ- References
ence metal quotas along with metal availability.
Artigue, L., and others. 2020. Water mass analysis along 22 N
Are picoeukaryotes and nanoeukaryotes functionally in the subtropical North Atlantic for the JC150 cruise
distinct? (GEOTRACES, GApr08). Deep Sea Res. Oceanogr. Res. Pap.
Biogeochemical models represent many taxa with one 158: 103230. doi:10.1016/j.dsr.2020.103230
pico-/nanophytoplankton functional type. We examined Aumont, O., C. Ethé, A. Tagliabue, L. Bopp, and M. Gehlen.
whether pico- and nanoeukaryotes distinguished with a 3 μm 2015. PISCES-v2: An ocean biogeochemical model for
cut-off (as advocated by Vaulot et al. 2008) had meaningfully carbon and ecosystem studies. Geosci. Model Dev. 8:
different metal contents. Average Fe quotas in picoeukaryotes 2465–2513. doi:10.5194/gmd-8-2465-2015
were twofold higher than those in nanoeukaryotes (Table S3, Behnke, J., and J. LaRoche. 2020. Iron uptake proteins in algae
p = 0.007), but the difference between sizes was smaller than and the role of iron starvation-induced proteins (ISIPs).
the variance observed within each group (Fig. 4C) and smaller Eur. J. Phycol. 55: 339–360. doi:10.1080/09670262.2020.
than the range of flagellate quotas in previous culture and 1744039
field studies, e.g., the 40-fold difference in quotas between Botebol, H., and others. 2017. Acclimation of a low iron
coastal and open-ocean flagellates (Fig. 4A, Twining adapted Ostreococcus strain to iron limitation through
360Sofen et al. Metal quotas of small flagellates
cell biomass lowering. Sci. Rep. 7: 327. doi:10.1038/ Moore, J. K., and others. 2018. Sustained climate warming
s41598-017-00216-6 drives declining marine biological productivity. Science
Browning, T. J., E. P. Achterberg, J. C. Yong, I. Rapp, C. 359: 1139–1143. doi:10.1126/science.aao6379
Utermann, A. Engel, and C. M. Moore. 2017. Iron Peers, G., and N. M. Price. 2006. Copper-containing plastocya-
limitation of microbial phosphorus Acquisition in the nin used for electron transport by an oceanic diatom.
Tropical North Atlantic. Nat. Commun. 8: 15465. doi: Nature 441: 341–344. doi:10.1038/nature04630
10.1038/ncomms15465 Roche, J. L., P. W. Boyd, R. Michael, L. McKay, and R. J. Geider.
Cohen, N. R., and others. 2018. Iron storage capacities and 1996. Flavodoxin as an in situ marker for iron stress in phy-
associated ferritin gene expression among marine diatoms. toplankton. Nature 382: 802–805. doi:10.1038/382802a0
Limnol. Oceanogr. 63: 1677–1691. doi:10.1002/lno.10800 Rusch, D. B., A. C. Martiny, C. L. Dupont, A. L. Halpern, and J.
Cuvelier, M. L., and others. 2010. Targeted metagenomics and Craig Venter. 2010. Characterization of Prochlorococcus
ecology of globally important uncultured eukaryotic phyto- clades from iron-depleted oceanic regions. Proc. Natl. Acad.
plankton. Proc. Natl. Acad. Sci. U. S. A. 107: 14679–14684. Sci. U. S. A. 107: 16184–16189. doi:10.1073/pnas.1009513107
doi:10.1073/pnas.1001665107 Schoffman, H., H. Lis, Y. Shaked, and N. Keren. 2016. Iron–
Duhamel, S., J. M. Diaz, J. C. Adams, K. Djaoudi, V. Steck, and nutrient interactions within phytoplankton. Front. Plant
E. M. Waggoner. 2021. Phosphorus as an integral compo- Sci. 7: 1223. doi:10.3389/fpls.2016.01223
nent of global marine biogeochemistry. Nat. Geosci. 14: Scott, F. J., and H. J. Marchan [eds.]. 2005, Antarctic marine
359–368. doi:10.1038/s41561-021-00755-8 protists. Australian Biological Resources Study/Australian
Erdner, D. L., and D. M. Anderson. 1999. Ferredoxin and Antarctic Division.
flavodoxin as biochemical indicators of iron limitation dur- Shire, D. M., and A. B. Kustka. 2015. Luxury uptake, iron stor-
ing open-ocean iron enrichment. Limnol. Oceanogr. 44: age and ferritin abundance in Prochlorococcus marinus
1609–1615. doi:10.4319/lo.1999.44.7.1609 (Synechococcales) strain MED4. Phycologia 54: 398–406.
Fawcett, S. E., M. W. Lomas, J. R. Casey, B. B. Ward, and D. M. doi:10.2216/14-109.1
Sigman. 2011. Assimilation of upwelled nitrate by small Sofen, L. E., and B. S. Twining. 2021. Trace metal contents of
eukaryotes in the Sargasso Sea. Nat. Geosci. 4: 717–722. autotrophic flagellates from contrasting open-ocean ecosys-
doi:10.1038/ngeo1265 tems. doi:10.5281/ZENODO.5191479
Flynn, K. J. 2010. Ecological modelling in a sea of variable Stock, C. A., J. P. Dunne, and J. G. John. 2014. Global-scale car-
stoichiometry: Dysfunctionality and the legacy of Redfield bon and energy flows through the marine planktonic food
and Monod. Prog. Oceanogr. 84: 52–65. doi:10.1016/j. web: An analysis with a coupled physical–biological model.
pocean.2009.09.006 Prog. Oceanogr. 120: 1–28. doi:10.1016/j.pocean.2013.07.001
Gilbert, N. E., and others. 2022. Bioavailable iron titrations Strzepek, R. F., M. T. Maldonado, K. A. Hunter, R. D. Frew,
reveal oceanic Synechococcus ecotypes optimized for differ- and P. W. Boyd. 2011. Adaptive strategies by Southern
ent iron availabilities. ISME Commun. Ocean phytoplankton to lessen iron limitation: Uptake of
Hirata, T., and others. 2011. Synoptic relationships between organically complexed iron and reduced cellular iron
surface chlorophyll a and diagnostic pigments specific to requirements. Limnol. Oceanogr. 56: 1983–2002. doi:10.
phytoplankton functional types. Biogeosciences 8: 311– 4319/lo.2011.56.6.1983
327. doi:10.5194/bg-8-311-2011 Sunda, W. G., and S. A. Huntsman. 1995. Iron uptake and
Kunde, K., N. J. Wyatt, D. Gonzalez-Santana, A. Tagliabue, C. growth limitation in oceanic and coastal phytoplankton.
Mahaffey, and M. C. Lohan. 2019. Iron distribution in the Mar. Chem. 50: 189–206. doi:10.1016/0304-4203(95)00035-P
subtropical North Atlantic: The pivotal role of colloidal iron. Tagliabue, A., and others. 2020. An iron cycle Cascade governs
Global Biogeochem. Cycles 33: 1532–1547. doi:10.1029/ the response of equatorial Pacific ecosystems to climate change.
2019GB006326 Glob. Chang. Biol. 26: 6168–6179. doi:10.1111/gcb.15316
Mahaffey, C., S. Reynolds, C. E. Davis, and M. C. Lohan. 2014. Tomas, C. R. [ed.]. 1997, Identifying marine phytoplankton.
Alkaline phosphatase activity in the Subtropical Ocean: Elsevier. doi:10.1016/B978-0-12-693018-4.X5000-9
Insights from nutrient, dust and trace metal addition experi- Twining, B. S., S. B. Baines, J. B. Bozard, S. Vogt, E. A. Walker,
ments. Front. Mar. Sci. 1: 73. doi:10.3389/fmars.2014.00073 and D. M. Nelson. 2011. Metal quotas of plankton in the
Menden-Deuer, S., and E. J. Lessard. 2000. Carbon to volume equatorial Pacific Ocean. Deep- Sea Res. Top. Stud. Ocean-
relationships for dinoflagellates, diatoms, and other Protist ogr. 58: 325–341. doi:10.1016/j.dsr2.2010.08.018
plankton. Limnol. Oceanogr. 45: 569–579. doi:10.4319/lo. Twining, B. S., and S. B. Baines. 2013. The trace metal compo-
2000.45.3.0569 sition of marine phytoplankton. Ann. Rev. Mar. Sci. 5:
Moore, C. M., and others. 2013. Processes and patterns of oce- 191–215. doi:10.1146/annurev-marine-121211-172322
anic nutrient limitation. Nat. Geosci. 6: 701–710. doi:10. Twining, B. S., S. Rauschenberg, P. L. Morton, and S. Vogt.
1038/ngeo1765 2015. Metal contents of phytoplankton and labile
361Sofen et al. Metal quotas of small flagellates
particulate material in the North Atlantic Ocean. Prog. experiments in the Atlantic and for measuring dFe, dZn, and APA,
Oceanogr. 137: 261–283. doi:10.1016/j.pocean.2015. respectively. We thank Philip Boyd for assistance with work at the Southern
07.001 Ocean Time Series and helpful comments on the manuscript. Use of the
Twining, B. S., S. Rauschenberg, S. E. Baer, M. W. Lomas, A. C. Advanced Photon Source, an Office of Science User Facility operated for
the U.S. Department of Energy (DOE) Office of Science by Argonne
Martiny, and O. Antipova. 2019. A nutrient limitation mosaic
National Laboratory, was supported by the U.S. DOE under Contract
in the eastern tropical Indian Ocean. Deep Sea Res. Top. Stud. No. DE-AC02-06CH11357. Transcriptomic sequencing (proposal ID
Oceanogr. 166: 125–140. doi:10.1016/j.dsr2.2019.05.001 504140) conducted by the U.S. Department of Energy Joint Genome
Twining, B. S., and others. 2021. Taxonomic and nutrient Institute (https://ror.org/04xm1d337), a DOE Office of Science User
Facility, is supported by the Office of Science of the U.S. Department of
controls on phytoplankton iron quotas in the ocean.
Energy under Contract No. DE-AC02-05CH11231. L.E.S. and B.S.T. were
Limnol. Oceanogr. Lett. 6: 96–106. doi:10.1002/lol2.10179 supported by NSF grants OCE-1829819 and OCE-1559021. N.E.G. and
Vaulot, D., W. Eikrem, M. Viprey, and H. Moreau. 2008. The S.W.W. were supported by NSF grant OCE-1829641. M.C.L. was
diversity of small eukaryotic phytoplankton (≤3 Μm) in supported by UK Natural Environment Research Council grant
marine ecosystems. FEMS Microbiol. Rev. 32: 795–820. doi: NE/N001125/1. C.M. was supported by UK Natural Environment Research
Council grant NE/N001079/1. This research was financially supported
10.1111/j.1574-6976.2008.00121.x
under Australian Research Council’s Discovery program (DP170102108;
Wang, S., S. Elliott, M. Maltrud, and P. Cameron-Smith. 2015. DP130100679) and ship time from Australia’s Marine National Facility. We
Influence of explicit Phaeocystis parameterizations on the are grateful to the officers, crew, and research staff of the Marine National
global distribution of marine dimethyl sulfide. J. Geophys. Facility and the R.V. Investigator for their help with sample collection and
Res. Biogeo. 120: 2158–2177. doi:10.1002/2015JG003017 generation of hydrochemistry data. We thank two anonymous reviewers
for thoughtful comments on this manuscript.
Zhang, H.-R., Y. Wang, P. Xiu, Y. Qi, and F. Chai. 2021. Roles
of iron limitation in phytoplankton dynamics in the West-
ern and eastern subarctic Pacific. Front. Mar. Sci. 8:
735826. doi:10.3389/fmars.2021.735826 Submitted 22 October 2021
Revised 22 March 2022
Acknowledgments
Accepted 27 April 2022
We thank Sara Rauschenberg for assisting with SXRF analyses. We thank
Koko Kunde, Neil Wyatt, and Clare Davies for assisting in the incubation
362You can also read