Analysis of Electric and Hybrid Vehicle Usage in Proximity to Charging Infrastructure in Indiana
←
→
Page content transcription
If your browser does not render page correctly, please read the page content below
Journal of Transportation Technologies, 2021, 11, 577-596
                                                                                                  https://www.scirp.org/journal/jtts
                                                                                                            ISSN Online: 2160-0481
                                                                                                              ISSN Print: 2160-0473

Analysis of Electric and Hybrid Vehicle Usage in
Proximity to Charging Infrastructure in Indiana

Jairaj Desai, Jijo K. Mathew, Howell Li, Darcy M. Bullock

Purdue University, West Lafayette, USA

How to cite this paper: Desai, J., Mathew,      Abstract
J.K., Li, H. and Bullock, D.M. (2021) Anal-
ysis of Electric and Hybrid Vehicle Usage       This paper explores the movement of connected vehicles in Indiana for ve-
in Proximity to Charging Infrastructure in      hicles classified by the NHTSA Product Information Catalog Vehicle listing
Indiana. Journal of Transportation Tech-        as being either electric (EV) or hybrid electric (HV). Analysis of trajectories
nologies, 11, 577-596.
                                                from July 12-18, 2021 for the state of Indiana observed nearly 33,300 trips and
https://doi.org/10.4236/jtts.2021.114036
                                                267,000 vehicle miles travelled (VMT) for the combination of EV and HV.
Received: August 7, 2021                        Approximately 53% of the VMT occurred in just 10 counties. For just EVs,
Accepted: September 4, 2021                     there were 9814 unique trips and 64,700 Electric Vehicle Miles Traveled
Published: September 7, 2021
                                                (EVMTs) in total. A further categorization of this revealed that 18% of these
Copyright © 2021 by author(s) and               EVMTs were on Interstate roadways and 82% on non-interstate roads.
Scientific Research Publishing Inc.             Proximity analysis of existing DC Fast charging stations in relation to inter-
This work is licensed under the Creative        state roadways revealed multiple charging deserts that would be most bene-
Commons Attribution International               fited by additional charging capacity. Eleven roadway sections among the 9
License (CC BY 4.0).
http://creativecommons.org/licenses/by/4.0/
                                                interstates were found to have a gap in available DC fast chargers of 50 miles
                Open Access                     or more. Although the connected vehicle data set analyzed did not include all
                                                EV’s the methodology presented in this paper provides a technique that can
                                                be scaled as additional EV connected vehicle data becomes available to agen-
                                                cies. Furthermore, it emphasizes the need for transportation agencies and
                                                automotive vendors to strengthen their data sharing partnerships to help ac-
                                                celerate the adoption of EV and reduce consumer range anxiety with EV.
                                                Graphics are included that illustrate examples of counties that are both over-
                                                served and underserved by charging infrastructure.

                                                Keywords
                                                Electric Vehicles, Connected Vehicles, Trajectory Data, Driver Behavior,
                                                Charging Stations

                                              1. Introduction
                                              An estimated 10 million electric vehicles (EV) were on roads in 2020, an increase

DOI: 10.4236/jtts.2021.114036 Sep. 7, 2021                        577                        Journal of Transportation Technologies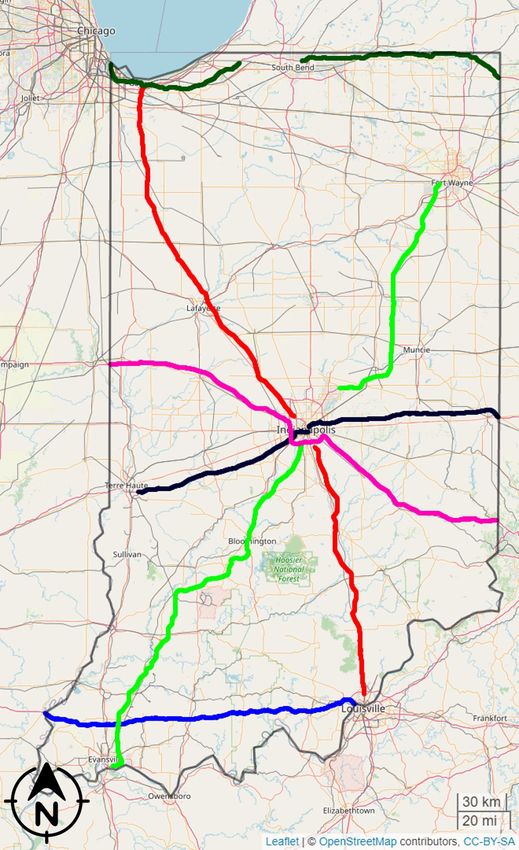
J. Desai et al.
of 41% for the calendar year. Eighteen of the world’s top 20 vehicle manufacturers
in 2020 have announced plans to scale up the production of electric vehicles in
their fleets [1]. Fifteen countries have publicly announced plans to phase out
sales of internal combustion engine (ICE) vehicles in support of zero emissions
vehicles [2]. The United States recently set forth a national target for EVs to
make up half of all new vehicle sales by the end of this decade [3]. While EVs
only account for 4% of vehicles in the US, their penetration rate has continued to
increase approximately 1% annually since 2017 [4]. It is estimated that EVs will
come close to reaching cost parity with ICE vehicles around 2025 that will result
in an accelerated transition from ICE to EV [5].
In addition to cost, range anxiety and availability of public charging stations
[6] [7] are two of the major barriers currently cited for inhibiting growth of EVs.
Furthermore, it is unclear to transportation agencies, consumers, and the private
sector where infrastructure usage and charging demand will grow or how fast it
will grow. The motivation of this paper is to explore using connected EV data to:
Characterize differences (or lack of a difference) in EV and ICE operating
speeds on Interstates in Indiana;
Characterize vehicle miles traveled by counties;
Identify counties that are underserved by charging infrastructure (and per-
haps overserved);
Identify “charging deserts” on major interstates;
Propose a methodology for evaluating candidate Interstate exits for installing
new charging stations.
2. Literature Review
A study utilized questionnaire surveys to understand the reasons behind EV and
hybrid vehicle (HV) owners in California reverting from an EV purchase and
found convenience of charging and limited access to level 2 charging at home as
contributing factors to discontinuance [8]. A survey of plug-in electric vehicle
(PEV) owners in California in 2016 and 2017 indicated over half of respondents
prefer home charging, while results indicated that the use of home, work and
public charging locations are an interdependent relationship of charging capacity
[9].
Past research has studied the impact of driving characteristics (driving style
and speeds) on EV usage and energy consumption using test vehicles in both
rural and urban areas indicating aggressive driving of EVs increases the cost to
the user by 30% and causes a marked difference in energy consumption [10].
Multiple energy consumption studies have looked at various factors that may
detrimentally impact EV efficiency and range including road type, auxiliary
loads (such as HVAC systems), driving at higher speeds, acceleration profiles,
increased vehicle cross-sectional area and ambient environment [11] [12] [13].
Research has established that battery electric vehicles have significant energy
savings for low speed drives with frequent stops, and observe substantial energy
consumption at highway speeds [14].
DOI: 10.4236/jtts.2021.114036 578 Journal of Transportation Technologies
J. Desai et al.

                                   An EV usage and planning study completed on six EVs deployed in Athens,
                                GA found most EVs were charged continuously within 3 hours and 80% of all
                                trips were less than 10 miles [15]. EV charging infrastructure planning research
                                has utilized long-term traffic flow predictions and public transportation datasets
                                to estimate optimal future charging infrastructure plans [16]. A study looked at
                                spot traffic counts in Western Australia coupled with an assumed EV penetra-
                                tion rate of 1% to select sites for future DC Fast charging stations using the cri-
                                terion of reliability, accessibility and availability of amenities and services [17].
                                Various simulation-based approaches have been employed in the past for EV
                                fast charging infrastructure planning using simulated trajectories and charging
                                behavior assumptions [18], urban mobility simulations that minimize EV energy
                                consumption [19], as well as mathematical programming models factoring in
                                user convenience and grid connections for low penetration levels of 5% [20].
                                Data obtained from fast charging stations in Ireland observed 0.18 charges per
                                day per EV user at home and 0.06 charges per day per EV user in public charg-
                                ing locations, thus reinforcing the need for more strategically placed fast charg-
                                ing stations to incentivize more usage in non-peak grid demand times [21].
                                   Past research has heavily focused on factors affecting EV range and charging
                                behavior and patterns on a user level. While most of the above studies utilized
                                floating car data, spot traffic counts, mathematical programming or simulation
                                modeling, very few studies have looked at real world connected vehicle data col-
                                lected from EVs and HVs to evaluate driver behavior and usage as it relates to
                                charging infrastructure on a macroscopic, statewide level. Our study aims to
                                bridge this gap by using connected vehicle data for a 1-week period in Indiana
                                for EVs and HVs.

                                3. Connected Vehicle Data
                                Indiana ingests over 10 billion connected vehicle records per month from a
                                combination of EV and ICE, with penetration of roughly 4% of all vehicles [22].
                                The charging standard for the EV vehicles analyzed is the SAE J1772 and Com-
                                bined Charging System (CCS) standard. This study looked at a one-week period
                                from July 12-18, 2021 to evaluate EV and HV usage patterns as they relate to ex-
                                isting charging infrastructure.
                                   Connected vehicle data utilized in this study is made up of individual journey
                                waypoints recorded at a 3-second fidelity. Each data record contains the follow-
                                ing attributes: Geolocation, speed, heading, timestamp, an anonymized unique
                                trajectory identification number and a vehicle classification code. This vehicle
                                classification code was then cross referenced with the National Highway Traffic
                                Safety Administration’s (NHTSA) Product Information Catalog Vehicle Listing
                                (vPIC) Application Programming Interface (API) [23] to obtain the electrifica-
                                tion level associated with it. If the electrification level obtained is ‘BEV (Battery
                                Electric Vehicle)’, the vehicle classification code and subsequently the associated
                                waypoint is flagged as belonging to an electric vehicle. A similar classification
                                process is followed for Hybrid Vehicles as well (Figure 1).

DOI: 10.4236/jtts.2021.114036                        579                        Journal of Transportation Technologies
J. Desai et al.

                                Figure 1. Methodology for decoding vehicle classification code to isolate EV and HV
                                connected vehicle data.

                                   Nearly 2.65 million waypoints were thus found for EVs for the week of July
                                12-18, 2021 spread over 9800 unique trips for the state of Indiana. Correspon-
                                dingly, 7.74 million waypoints were obtained for HVs for the same week spread
                                over 23,000 unique trips. A spatial representation of these EV and HV waypoints
                                has been shown in Figure 2(a) and Figure 2(b) respectively. In comparison, over
                                7.54 million unique trips were found for ICE vehicles (ICEV) for the same period.
                                The majority of the EV and HV coverage is concentrated in metropolitan areas.

                                                    (a)                                        (b)

                                Figure 2. Electric and hybrid vehicle trails in Indiana (July 12-18, 2021). (a) ~64,700
                                EVMTs in Indiana; (b) ~202,000 HVMTs in Indiana.

DOI: 10.4236/jtts.2021.114036                         580                        Journal of Transportation Technologies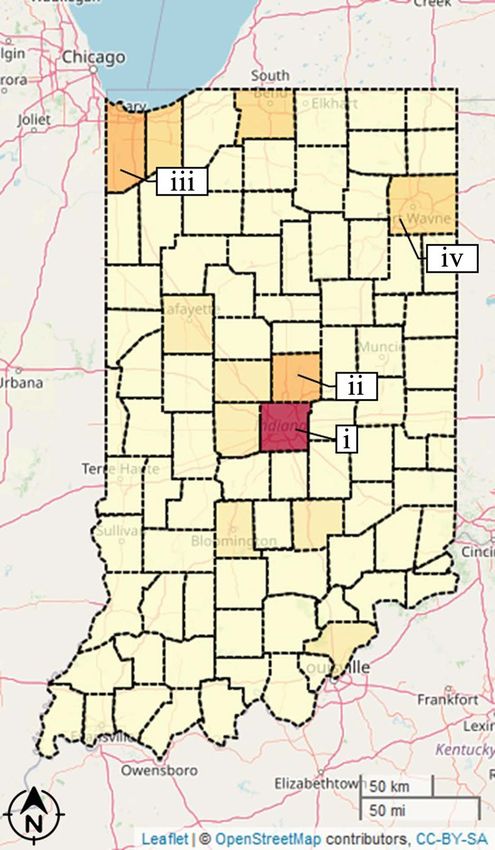
J. Desai et al.

                                   Of the 92 counties in the state of Indiana, vehicle miles traveled (VMT) totals
                                were computed for both EVs and HVs by matching each individual waypoint to
                                the county it was recorded in. A spatial representation of these EVMTs and
                                HVMTs in terms of percentage of the total VMT (EVMT + HVMT) by the
                                county have been shown in Figure 3(a) and Figure 3(b). A tabular representa-
                                tion of the top 10 counties with the highest combined totals of EVMT and
                                HVMT is shown in Table 1. Marion (callout i), Hamilton (callout ii) and Lake
                                (callout iii) counties account for the highest EVMTs while Marion, Hamilton
                                and Allen (callout iv) counties observed the highest HVMTs. Marion county had
                                the highest vehicle miles traveled for EVs and HVs overall.

                                                    (a)                                      (b)

                                Figure 3. EVMTs and HVMTs aggregated by Indiana County (July 12-18, 2021). (a)
                                EVMTs aggregated by County; (b) HVMTs aggregated by County.

DOI: 10.4236/jtts.2021.114036                       581                       Journal of Transportation Technologies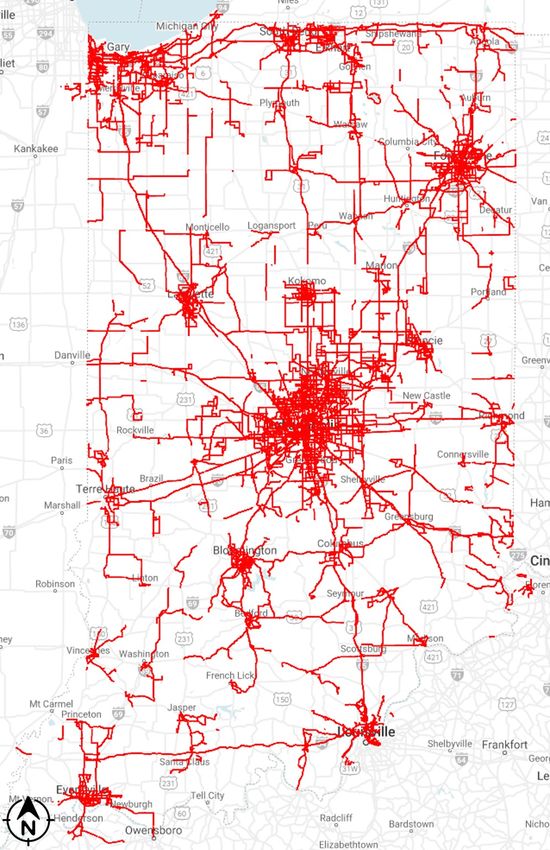
J. Desai et al.

                                Table 1. Top 10 Indiana counties with highest totals of EVMT and HVMT (July 12-18,
                                2021).

                                       County             EVMT (miles)       HVMT (miles)          Total (miles)
                                       Marion                 9557              27,980                37,537
                                      Hamilton                4625              15,994                20,619
                                        Allen                 3067              15,085                18,152
                                         Lake                 4294              12,862                17,156
                                        Porter                2693               8223                 10,916
                                      St. Joseph              2899               5820                  8719
                                      Hendricks               1865               5447                  7312
                                      Tippecanoe              2274               4910                  7184
                                       Monroe                 1983               5010                  6993
                                       Madison                916                5353                  6269

                                4. Electric and Hybrid Vehicle Miles Traveled by Roadway
                                Using linear referenced sections of the roadway on all Indiana interstates at ap-
                                proximately 0.1-mile fidelity, each EV and HV waypoint was cross-referenced
                                and matched to an interstate route with a direction of travel. This enabled the
                                computation of summary statistics for EVs and HVs in terms of percent of ve-
                                hicle miles traveled (VMT) on interstate corridors and non-interstate roadways
                                (Figure 4). Approximately 18% of EVMTs occur on interstate roadways and
                                24% of HVMTs occur on interstates. A further categorization of EVMTs and
                                HVMTs was performed for individual routes for 11 interstate corridors around
                                the state. A stacked bar representation shown in Figure 4(c) clearly illustrates
                                the north-south interstate route I-65 and I-69 seeing the most EV and HV traffic
                                in addition to substantial EV and HVMT on the I-465 loop around Indianapolis.
                                   Using the route-by-route breakdown of EVMTs for Indiana Interstates ob-
                                tained earlier, the top ten 1-mile interstate segments with highest EVMTs are
                                shown graphically and on an Indiana map in Figure 5(a) and Figure 5(b) re-
                                spectively. Eight of the top 10 segments were found to be in urban areas primar-
                                ily on or near the I-465 beltway around Indianapolis which observes daily com-
                                muter traffic. Additional segments on I-94 in northwest Indiana see significant
                                usage potentially owed to traffic commuting to and from Illinois. These high
                                usage sections could be potential early deployment sites for additional charging
                                stations and/or in-pavement wireless charging [24].

                                5. Interstate Operating Speeds of Electric and Hybrid
                                   Vehicles
                                Average Speeds of EVs and HVs, and ICEVs that traversed on I-65 (chosen due
                                to highest EVMTs and HVMTs recorded among all interstates) were evaluated
                                for the week of July 12-18, 2021. Median EV and HV speeds were found to be
                                68.7 and 71.6 mph respectively, with ICEVs operating at a median speed of 72.3
                                mph.

DOI: 10.4236/jtts.2021.114036                       582                       Journal of Transportation Technologies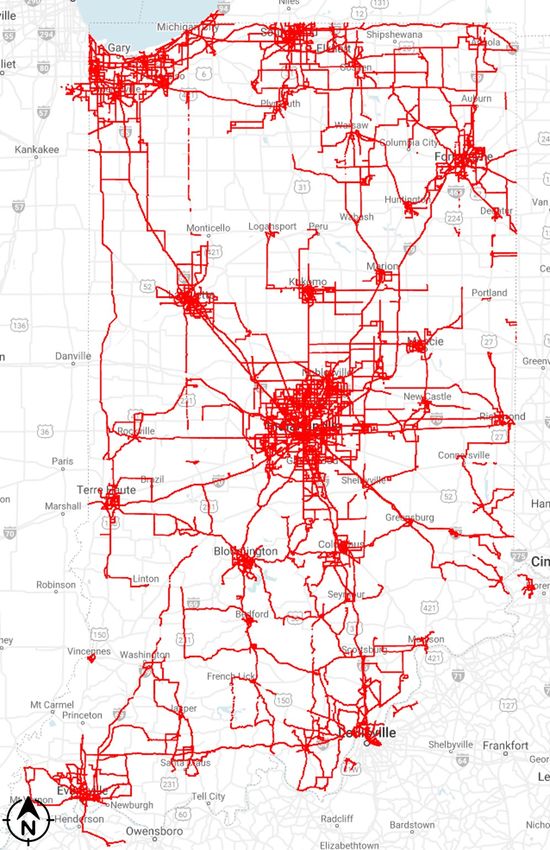
J. Desai et al.

                                                        (a)                                (b)

                                                                         (c)

                                Figure 4. VMTs categorized by roadway, interstate routes (July 12-18, 2021). (a) EVMTs
                                categorized by roadway; (b) HVMTs categorized by roadway; (c) Interstate VMTs catego-
                                rized by EVs and HVs.

                                  Figure 6 shows a cumulative frequency distribution plot of uncongested ve-
                                hicle speeds (speeds above 45 mph) for I-65. A separate frequency line has been
                                used for each of the EV, HV and ICEV vehicle classes for ease of comparison.
                                  From Figure 6, one can see that the distribution of ICE vehicle speeds is
                                higher than both HV and EV. In fact, there is approximately a 3 mph difference

DOI: 10.4236/jtts.2021.114036                        583                        Journal of Transportation Technologies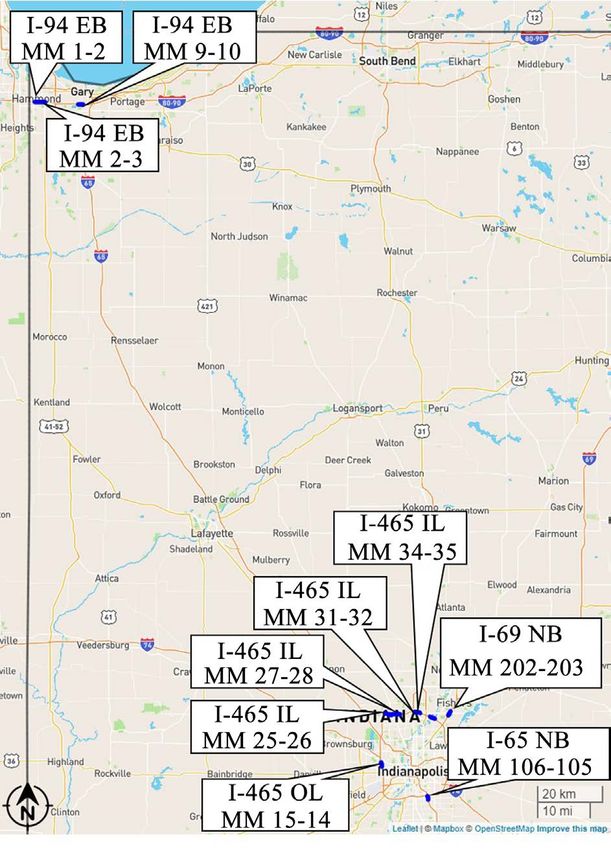
J. Desai et al.

                                                                          (a)

                                                                          (b)

                                Figure 5. Interstate segments with highest EVMTs (July 12-18, 2021). (a) Top 10 inter-
                                state segments with highest EVMTs; (b) Statewide map of top 10 interstate segments with
                                highest EVMTs.

                                in median speeds between ICE and EV. Some of this may be due to range anxie-
                                ty concerns by EV operators resulting in them driving at lower speeds to con-
                                serve battery charge and/or different driving styles of ICE and EV consumers.

DOI: 10.4236/jtts.2021.114036                         584                        Journal of Transportation Technologies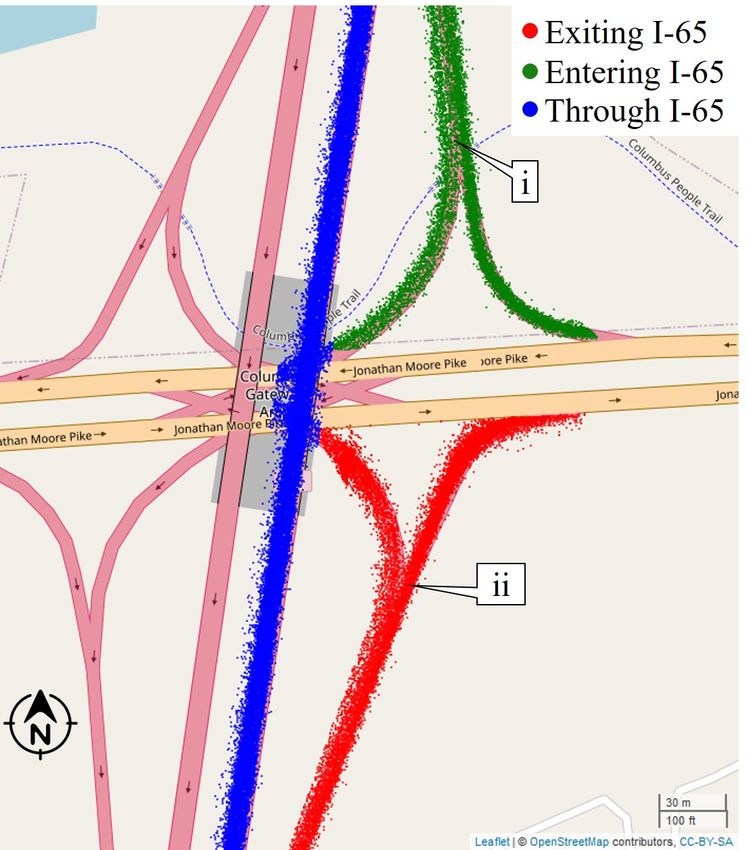
J. Desai et al.

                                Figure 6. Cumulative frequency distributions of EV, HV and ICEV uncongested speeds
                                for I-65 (July 12-18, 2021).

                                6. Evaluating EV Charging Infrastructure
                                Using the National Renewable Energy Laboratory’s (NREL) alternative fuel sta-
                                tions API [25], geolocation data and multiple other pertinent attributes includ-
                                ing number of charge points were obtained for 294 electric charging stations in
                                Indiana. Among these, 270 were found to be level 2 capable (Figure 7(a)) and 24
                                stations were found to be capable of providing DC Fast Charging (Figure 7(b)).
                                Fast charging is a critical need for long-distance driving, especially for travel on
                                long stretches of limited access roadways such as interstate corridors. Level 2
                                charging was observed to be spread out across the state with clusters in the Gary,
                                South Bend, Fort Wayne and Indianapolis regions. DC Fast charging is however
                                more sparsely distributed with few in the north-central and southwest region.

                                6.1. Charging Station Usage
                                With rising adoption rates of EV and HV, a clear and present concern for EV
                                owners as well as the private sector is charging station capacity. With limited
                                charging infrastructure and charging spots at each station, the adoption rate of
                                EVs could soon possibly surpass the ability of existing infrastructure to serve all
                                EV owners if the growth of infrastructure does not keep pace. Owing to this, an
                                analysis of charging station usage is needed to compute number of unique uses
                                per day to look at charging patterns. A DC Fast charging station in South Bend,
                                Indiana was utilized for this analysis as shown in Figure 8(a).

DOI: 10.4236/jtts.2021.114036                        585                       Journal of Transportation Technologies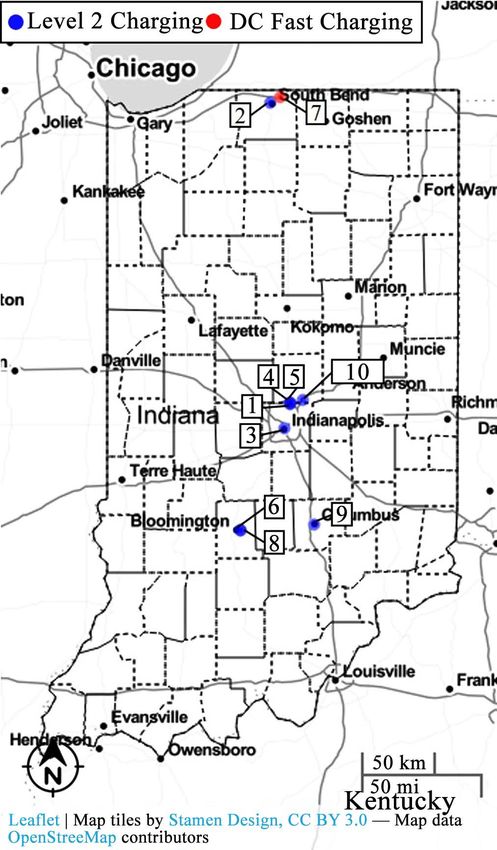
J. Desai et al.

                                                    (a)                                       (b)

                                Figure 7. Level 2 and DC fast charging infrastructure in Indiana [25]. (a) 270 level 2
                                charging stations; (b) 24 DC fast charging stations.

                                                                         (a)

                                                                         (b)

                                Figure 8. Charging station usage (June 1-July 27, 2021). (a) DC fast charging station
                                (South Bend, Indiana); (b) Usage by hour of day and day of week.

DOI: 10.4236/jtts.2021.114036                        586                        Journal of Transportation Technologies
J. Desai et al.
A spatial polygon was drawn around all of the charging spots at this station.
EV waypoint geolocations for a nearly 2-month period of June 1-July 27, 2021
were then cross-referenced with this polygon to detect those waypoints that
coincided directly with either of the charging spots. Using the obtained intersec-
tion of data, a temporal profile of unique EV trips visiting this charging station
has been shown by the illustration in Figure 8(b) categorized by day of week
and hour of day. The hours of 2 PM and 8 PM specifically show up as peak
charge times with the weekend period of Friday, Saturday and Sunday appearing
to be the preferred time to charge. While this analysis only provides an initial
look at charging patterns at one station, this methodology is easily scalable to
any charging station irrespective of location which makes it a valuable tool for
EV stakeholders.
Using a similar methodology as shown above, the top ten most utilized EV
charging stations were found for the state of Indiana, 9 of which were level 2 ca-
pable and 1 provided DC fast charging capability (ranked 7). A majority of these
stations were found to be in urban areas near Indianapolis, South Bend and Co-
lumbus and have also been shown on an Indiana county map along with their
ranks called out in Figure 9.
Figure 9. Top 10 utilized EV charging stations in Indiana called out by rank (July 12-18,
2021).
DOI: 10.4236/jtts.2021.114036 587 Journal of Transportation TechnologiesJ. Desai et al.
For all 92 counties in Indiana, the number of charging stations and the num-
ber of charge points at all stations were obtained. A linear relationship was es-
tablished between VMTs for EVs and HVs versus the number of charge stations
as well as the number of charge points available per county. This distinction be-
tween charge points and charge stations is needed as the number of charge sta-
tions in a county alone may not reflect the true charging capacity owing to mul-
tiple charge points available at each station. A scatter plot along with a predicted
linear relationship line between number of charge stations, EVMTs and HVMTs
by Indiana county has been shown in Figure 10(a). A similar plot showing a re-
lationship with number of charge points is depicted in Figure 10(b).
(a)
(b)
Figure 10. Relationship between charging locations and VMT by Indiana county (July
12-18, 2021). (a) Count of EV charging stations vs. EVMT and HVMT by Indiana county;
(b) Count of EV charging points vs. EVMT and HVMT by Indiana County.
Clusters near the y-axis pointed to by callouts i on Figure 10(a) and Figure
10(b) indicate overserved counties in the state where a high number of
charging stations and charge points are available however minimal EVMTs
and HVMTs are observed.
DOI: 10.4236/jtts.2021.114036 588 Journal of Transportation TechnologiesJ. Desai et al.
Clusters near the x-axis pointed to by callouts ii on Figure 10(a) and Figure
10(b) indicate underserved counties in the state where there is a high EVMT
or HVMT, but little charging infrastructure.
These visualizations may be helpful to government and private sector planners
in providing a first look at determining which geographical locations in particu-
lar are over or underserved and allocating resources and investment accordingly.
6.2. Sensitivity Analysis for DC Fast Charging Station Proximity to
Interstates
As fast charging is essential for planning long distance routes, availability of fast
charging stations near high-speed interstate corridors is essential to assuage
range anxiety. Using the geolocations of the 24 DC Fast charging stations in In-
diana [25], a proximity analysis was conducted to determine the closest inter-
state roadway to each station within a specified radius. The results of a sensitivi-
ty analysis wherein the specified radius was increased in 1-mile steps are shown
in Table 2. 75% of all DC Fast charging stations were found to be within 1-mile
of an interstate corridor while 96% of all DC Fast charging stations were within 6
miles of an interstate.
Table 2. Proximity of DC fast charging stations to Indiana interstates.
Number of DC Fast Charging Percentage of DC Fast Charging
Radius (mi)
Stations within the radius Stations within the radius
1 18 75%
2 20 83%
3 21 88%
4 22 92%
5 22 92%
6 23 96%
7 23 96%
8 23 96%
9 23 96%
State of Indiana 24 100%
7. Charging Deserts on Interstate Routes
Using the results of the sensitivity analysis from above, the closest interstate
roadways were found within 1-mile of each of the 18 stations. These limits were
subsequently utilized to introduce the concept of a fast “charging desert,” which
indicates long segments of interstate without a DC Fast charging station availa-
ble within a 1-mile threshold. A statewide summary of charging segments and
deserts on nine interstate routes is shown in Figure 11(a). Each interstate is
broken up into segments at either end of which is either a charging station, route
endpoint, or the state boundary line, however a fast-charging station is not
found in the interior of the segment. It was assumed that a 50-mile length thre-
shold for a fast charging desert would be significant enough to add to range an-
DOI: 10.4236/jtts.2021.114036 589 Journal of Transportation TechnologiesJ. Desai et al.
xiety concerns, as the average late-model production EV can travel about 3.4
miles per kilowatt-hour [26] and a typical level 2 charger outputting 6.6 kilo-
watts, thereby potentially adding up to about one hour to a trip if resorted to a
level 2 charger. Each such 50-mile or longer segment is termed a desert and has
been illustrated in Figure 11(b) highlighting multiple long fast charge gaps on
Indiana’s interstates, from Lafayette to Gary on I-65, Evansville to Indianapolis
on I-69 and Terre Haute to Indianapolis on I-70 to name a few.
(a)
(b) (c)
Figure 11. Segment lengths on Indiana interstates without a DC fast charging station
(Fast charge deserts). (a) DC fast charging availability segments on Indiana interstates;
(b) DC fast charging deserts longer than 50 miles (no station within 1 mile of interstate);
(c) DC fast charging deserts longer than 50 miles (no station within 5 miles of interstate).
DOI: 10.4236/jtts.2021.114036 590 Journal of Transportation TechnologiesJ. Desai et al.
To spatially visualize the sensitivity of the 1-mile threshold, a corresponding
desert map has been shown in Figure 11(c) with a 5-mile threshold where the
I-65 desert south of Indianapolis is shorter owing to a DC fast charging station
found within a 5-mile radius. Callout (i) on Figure 11(b) shows the original
longer desert on I-65 which reduces in length when the proximity threshold for
charging stations is changed from 1 mile to 5 miles.
For a detailed look at each interstate, start and end mile markers (mm) for
each charging segment and whether it is a potential desert or not are provided in
Table 3. For example, I-65 consists of three charging deserts, one between MM 4
and MM 120, the second between MM 120 and MM 172 and the third between
MM 172 and MM 262. Eleven fast charging deserts in total were found across 9
interstate routes in Indiana.
Table 3. Summary of charging segments and deserts on Indiana interstates (no station
within 1 mile of interstate).
Total Length Fast Charging Availability Segments
Interstate Potential Desert
(mi) Start MM End MM Length (mi)
52.0 33.6 34.6
I-465 53 33.6 45.1 11.5
45.1 52.0 6.9
I-469 31 0.0 31.0 31.0
I-64 124 0.0 124.0 124.0 Yes
0.0 4.7 4.7
4.7 120.1 115.4 Yes
I-65 262
120.1 172.1 52.0 Yes
172.1 262.0 89.9 Yes
0.0 205.7 205.7 Yes
205.7 210.0 4.3
I-69 357 210.0 305.2 95.2 Yes
305.2 310.9 5.7
310.9 357.0 46.1
0.0 11.1 11.1
I-70 157 11.1 71.5 60.4 Yes
71.5 157.0 85.5 Yes
I-74 171 0.0 171.0 171.0 Yes
0.0 22.2 22.2
I-94 46
22.2 46.0 23.8
0.0 55.7 55.7 Yes
I-90 156.28 55.7 80.0 24.3
80.0 156.3 76.3 Yes
8. Evaluating EV Usage of Interstate Exits for Charging
Locations
Having identified the significant fast charge gaps on interstates as shown in ear-
DOI: 10.4236/jtts.2021.114036 591 Journal of Transportation TechnologiesJ. Desai et al.
lier sections, the opportunity provided to planners would be to decide which in-
terstate exits to place additional charging infrastructure. It can be assumed that
the most heavily utilized exits, irrespective of vehicle class, would serve as the
ideal locations to reinforce with charging capacity.
Without tracking user activity patterns over an entire trip, our methodology
makes use of the vehicle classification code which represents the make and mod-
el of a vehicle in order to look at outflows and inflows on the exit and entry
ramps respectively at a chosen interstate location by defining a time threshold
ranging from 30 to 90 minutes. We thus ensure anonymity by not capturing any
stopping patterns from the connected vehicle data.
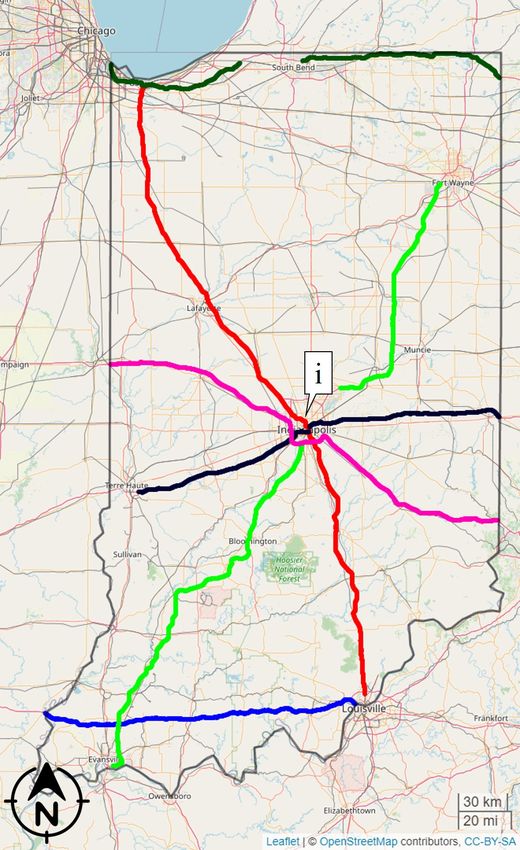
Figure 12 shows exit 68 on I-65 NB (near the midway point on I-65 charging
desert MM 4-120 from Table 3) near Columbus, Indiana to illustrate this analy-
sis technique. Connected vehicle waypoints shown in blue indicate those trips
traveling through on I-65 without taking the exit, red indicate those exiting (cal-
lout ii) and green indicate trips entering I-65 NB (callout i) at the same location
using one of two entry ramps. All EV, HV, and ICEV waypoints were used for
this analysis.
Figure 12. I-65 NB through, exiting and entering trajectory samples at I-65 Exit 68 (July
12-18, 2021).
Once trips have been categorized as exiting, entering and through, each ve-
hicle classification code from an exiting trip is matched with all vehicle classifi-
cation codes from entering trips that are seen on the entry ramps within
30-minutes of the exiting trip. If a match is found, that particular trip is flagged
as one that took a short break at the exit under consideration.
Using the methodology defined above, the analysis was conducted for a
1-week period from July 12-18, 2021 for MM 68 exclusively for the northbound
direction of travel. Nearly 8.5 million connected vehicle records from over
61,000 unique trips were observed near this exit. Out of these, approximately 1.5
million records were found to be traveling northbound on I-65 spread over
DOI: 10.4236/jtts.2021.114036 592 Journal of Transportation TechnologiesJ. Desai et al.
11,800 unique trips. The results of the analysis conducted on these records have
been shown in Table 4.
Table 4. Summary table of time threshold sensitivity and number of journeys taking a
short break at I-65 exit 68 categorized by vehicle type, July 12-18, 2021.
Journeys taking a short break
Time Threshold (minutes)
EV HV ICEV
30 0 2 260
60 0 2 364
90 0 2 414
We thus see 262 trips (30-min threshold), 366 trips (60-min threshold) and
416 trips (90-min threshold) taking a short break at exit 68 over a 1-week period.
This represents at the very least nearly 2% of trips taking a short break at this ex-
it. The scalable nature of this methodology allows practitioners and researchers
to apply similar techniques throughout an interstate to find the most utilized ex-
its on a corridor and subsequently plan the placement of additional EV charging
infrastructure accordingly so as to provide a good charging level of service to the
EV and HV motoring public.
9. Conclusions and Future Opportunities
This study used one week of connected vehicle trajectory data in Indiana to ana-
lyze EV and HV usage patterns. Nearly half of all VMTs for EVs and HVs were
seen in just the top 10 counties. A spatial analysis highlighted multiple Indiana
counties near Indianapolis with the highest EV ownership and usage, followed
by Allen County in Northeast Indiana and Lake County in Northwest Indiana.
(Figure 3, Table 1). Out of nearly 11,600 EVMTs and 49,200 HVMTs on Indi-
ana interstates, I-65 had the largest EV traffic with 2631 EVMTs (Figure 4(c)).
In general, the average speeds of the EVs were close, but slightly less than HV
and ICE, indicated by the left shift on the EV speed distributions (Figure 6).
A graphic of charge stations and charge points versus VMTs for EVs and HVs
on a county-by-county basis was used to identify underserved and overserved
counties where the charging infrastructure does not match travel demand and
vice versa (Figure 10).
Subsequently, a methodology was presented to evaluate the percent of EV, HV
and Non-EV trips exiting for short breaks at interstate exits. This methodology
can be used to obtain the most commonly utilized Interstate exits by EVs to fur-
ther aid in decisions involving the deployment of charging infrastructure to ad-
dress any under or overserving issues.
There are 24 DC Fast charging stations spread around the state, and the ma-
jority of them (75%) are accessible within 1 mile of interstate roadways in Indi-
ana (Table 2). The concept of a “fast charging desert” was introduced to identify
long interstate segments that lacked DC Fast charging stations within 1 mile of
DOI: 10.4236/jtts.2021.114036 593 Journal of Transportation TechnologiesJ. Desai et al.
the Interstate. The study found 11 interstate segments, over 50 miles in length
that lacked adjacent DC Fast charging stations. These segments have been shown
in Figure 11 and Table 3. Methods to analyze charging station usage (Figure 8)
coupled with this analysis of charge gaps can together provide a good overview
of existing charging infrastructure performance for stakeholders.
In addition to examining opportunities for fast charging stations, it is also
important to look at locations that might be viable for wireless EV charging. This
study identified ten 1-mile interstate segments observing the highest EVMTs
(Figure 5) as an early screening for further evaluation [24]. Not surprisingly,
they were near urban areas.
In conclusion, an important question all EV stakeholders are currently facing
is balancing investment in areas that have growing EV usage versus investing in
underserved areas in an effort to stimulate demand. We believe the performance
measures and visualizations put forth in this paper will be important tools for
public agencies and private sector partners to use to help inform future policies
and investments.
Acknowledgements
Trajectory data between June 1st and July 27th, 2021 used in this study, was pro-
vided by Wejo Data Services Inc. This work was supported in part by the Na-
tional Science Foundation and the Joint Transportation Research Program ad-
ministered by the Indiana Department of Transportation and Purdue University.
The contents of this paper reflect the views of the authors, who are responsible
for the facts and the accuracy of the data presented herein, and do not necessari-
ly reflect the official views or policies of the sponsoring organizations. These
contents do not constitute a standard, specification, or regulation.
Conflicts of Interest
The authors declare no conflicts of interest regarding the publication of this pa-
per.
References
[1] International Energy Agency (IEA) (2021) Global EV Outlook 2021—Overview.
International Energy Agency, Paris.
https://www.iea.org/reports/global-ev-outlook-2021?mode=overview
[2] Bloomberg NEF (2021) Electric Vehicle Outlook 2021.
https://about.bnef.com/electric-vehicle-outlook/
[3] McCormick, M. and Bushey, C. (2021) Biden Sets Electric Vehicle Target in Drive
to Cut Emissions. Financial Times.
https://www.ft.com/content/7fbc2d70-5365-4d3b-97ec-cea2756de28d
[4] Broom, D. (2021, January 20) 2020 Was a Breakthrough Year for Electric Vehicles.
Here’s Why. World Economic Forum.
https://www.weforum.org/agenda/2021/01/electric-vehicles-breakthrough-tesla-chi
na/
DOI: 10.4236/jtts.2021.114036 594 Journal of Transportation TechnologiesJ. Desai et al.
[5] Lane, B. (2016) Electric Vehicle Market Statistics. http://www.mjbradley.com
[6] Geotab, Inc. (2021, January 6) Addressing the Barriers to EV Adoption.
http://www.geotab.com/energy
[7] Franke, T., Neumann, I., Bühler, F., Cocron, P. and Krems, J.F. (2012) Experiencing
Range in an Electric Vehicle: Understanding Psychological Barriers. Applied Psy-
chology, 61, 368-391. https://doi.org/10.1111/j.1464-0597.2011.00474.x
[8] Hardman, S. and Tal, G. (2021) Understanding Discontinuance among California’s
Electric Vehicle Owners. Nature Energy, 6, 538-545.
https://doi.org/10.1038/s41560-021-00814-9
[9] Lee, J.H., Chakraborty, D., Hardman, S.J. and Tal, G. (2020) Exploring Electric Ve-
hicle Charging Patterns: Mixed Usage of Charging Infrastructure. Transportation
Research Part D: Transport and Environment, 79, Article ID: 102249.
https://doi.org/10.1016/j.trd.2020.102249
[10] Bingham, C., Walsh, C. and Carroll, S. (2012) Impact of Driving Characteristics on
Electric Vehicle Energy Consumption and Range. IET Intelligent Transport Sys-
tems, 6, 29-35. https://doi.org/10.1049/iet-its.2010.0137
[11] Kambly, K. and Bradley, T.H. (2015) Geographical and Temporal Differences in
Electric Vehicle Range Due to Cabin Conditioning Energy Consumption. Journal of
Power Sources, 275, 468-475. https://doi.org/10.1016/j.jpowsour.2014.10.142
[12] Yao, E., Yang, Z., Song, Y. and Zuo, T. (2013) Comparison of Electric Vehicle’s
Energy Consumption Factors for Different Road Types. Discrete Dynamics in Na-
ture and Society, 2013, Article ID: 328757. https://doi.org/10.1155/2013/328757
[13] Wager, G., Whale, J. and Braunl, T. (2016) Driving Electric Vehicles at Highway
Speeds: The Effect of Higher Driving Speeds on Energy Consumption and Driving
Range for Electric Vehicles in Australia. Renewable and Sustainable Energy Re-
views, 63, 158-165. https://doi.org/10.1016/j.rser.2016.05.060
[14] Yuan, X., Li, L., Gou, H. and Dong, T. (2015) Energy and Environmental Impact of
Battery Electric Vehicle Range in China. Applied Energy, 157, 75-84.
https://doi.org/10.1016/j.apenergy.2015.08.001
[15] Yang, H., Gao, Y., Farley, K.B., Jerue, M., Perry, J. and Tse, Z. (2015) EV Usage and
City Planning of Charging Station Installations. 2015 IEEE Wireless Power Transfer
Conference, Boulder, 13-15 May 2015, 1-4.
https://doi.org/10.1109/WPT.2015.7139139
[16] Li, C., Dong, Z., Chen, G., Zhou, B., Zhang, J. and Yu, X. (2021) Data-Driven Plan-
ning of Electric Vehicle Charging Infrastructure: A Case Study of Sydney, Australia.
IEEE Transactions on Smart Grid, 12, 3289-3304.
https://doi.org/10.1109/TSG.2021.3054763
[17] Bräunl, T., Harries, D., McHenry, M. and Wager, G. (2020) Determining the Op-
timal Electric Vehicle DC-Charging Infrastructure for Western Australia. Trans-
portation Research Part D: Transport and Environment, 84, Article ID: 102250.
https://doi.org/10.1016/j.trd.2020.102250
[18] Kavianipour, M., Fakhrmoosavi, F., Singh, H., Ghamami, M., Zockaie, A., Ouyang,
Y., et al. (2021) Electric Vehicle Fast Charging Infrastructure Planning in Urban
Networks Considering Daily Travel and Charging Behavior. Transportation Re-
search Part D: Transport and Environment, 93, Article ID: 102769.
https://doi.org/10.1016/j.trd.2021.102769
[19] Maia, R., Silva, M., Araujo, R. and Nunes, U. (2011) Electric Vehicle Simulator for
Energy Consumption Studies in Electric Mobility Systems. 2011 IEEE Forum on
DOI: 10.4236/jtts.2021.114036 595 Journal of Transportation TechnologiesJ. Desai et al.
Integrated and Sustainable Transportation Systems, Vienna, 29 June-1 July 2011,
227-232. https://doi.org/10.1109/FISTS.2011.5973655
[20] Dashora, Y., Barnes, J.W., Pillai, R.S., Combs, T.E., Hilliard, M. and Chinthavali,
M.S. (2010) The PHEV Charging Infrastructure Planning (PCIP) Problem. Interna-
tional Journal of Emerging Electric Power Systems, 11, Article No. 7.
https://doi.org/10.2202/1553-779X.2482
[21] Morrissey, P., Weldon, P. and O’Mahony, M. (2016) Future Standard and Fast
Charging Infrastructure Planning: An Analysis of Electric Vehicle Charging Beha-
vior. Energy Policy, 89, 257-270. https://doi.org/10.1016/j.enpol.2015.12.001
[22] Hunter, M., Mathew, J., Cox, E., Blackwell, M. and Bullock, D. (2021) Estimation of
Connected Vehicle Penetration Rate on Indiana Roadways. JTRP Affiliated Reports,
Paper No. 37. https://doi.org/10.5703/1288284317343
[23] Specifications, W.A.P.I. (2012) Vehicle API. https://vpic.nhtsa.dot.gov/api/
[24] INDOT (2021) INDOT: Wireless Electric Vehicle Charging Solution for Highway
Infrastructure.
https://www.in.gov/indot/current-programs/innovative-programs/wireless-electric-
vehicle-charging-solution-for-highway-infrastructure/
[25] National Renewable Energy Laboratory (n.d.) All Stations API.
https://developer.nrel.gov/docs/transportation/alt-fuel-stations-v1/all/
[26] Moloughney, T. (2021, February 12) EV Range Tests: Real-World Vs EPA.
https://insideevs.com/reviews/443791/ev-range-test-results/
DOI: 10.4236/jtts.2021.114036 596 Journal of Transportation TechnologiesYou can also read