Enhanced Mid-depth Southward Transport in the Northeast Atlantic at the Last Glacial Maximum Despite a Weaker AMOC
←
→
Page content transcription
If your browser does not render page correctly, please read the page content below
Enhanced Mid-depth Southward Transport in the
 Northeast Atlantic at the Last Glacial Maximum
 Despite a Weaker AMOC
 L. Menviel, P. Spence, L. Skinner, Tachikawa Kazuyo, T. Friedrich, L.
 Missiaen, J. Yu

 To cite this version:
 L. Menviel, P. Spence, L. Skinner, Tachikawa Kazuyo, T. Friedrich, et al.. Enhanced Mid-
 depth Southward Transport in the Northeast Atlantic at the Last Glacial Maximum Despite a
 Weaker AMOC. Paleoceanography and Paleoclimatology, American Geophysical Union, 2020, 35 (2),
 �10.1029/2019PA003793�. �hal-03005034�

 HAL Id: hal-03005034
 https://hal.archives-ouvertes.fr/hal-03005034
 Submitted on 18 Mar 2022

 HAL is a multi-disciplinary open access L’archive ouverte pluridisciplinaire HAL, est
archive for the deposit and dissemination of sci- destinée au dépôt et à la diffusion de documents
entific research documents, whether they are pub- scientifiques de niveau recherche, publiés ou non,
lished or not. The documents may come from émanant des établissements d’enseignement et de
teaching and research institutions in France or recherche français ou étrangers, des laboratoires
abroad, or from public or private research centers. publics ou privés.
 Copyright
RESEARCH ARTICLE Enhanced Mid-depth Southward Transport in the
10.1029/2019PA003793
 Northeast Atlantic at the Last Glacial Maximum
Key Points: Despite a Weaker AMOC
• As the AMOC weakens, Nordic
 Sea sea ice and convection sites
 shift equatorward and the Deep L. C. Menviel1,2 , P. Spence1 , L. C. Skinner3 , K. Tachikawa4 , T. Friedrich5 ,
 Western Boundary Current weakens L. Missiaen1 , and J. Yu6
 proportionally
• As the AMOC weakens, the 1 Climate Change Research Centre, University of New South Wales, Sydney, New South Wales, Australia, 2 PANGEA,
 southward flow on the eastern side of
 the Mid-Atlantic Ridge strengthens University of New South Wales, Sydney, New South Wales, Australia, 3 Department of Earth Sciences, University of
 by up to 100% Cambridge, Cambridge, UK, 4 Aix Marseille Univ., CNRS, IRD, Coll France, CEREGE, Aix-en-Provence, France,
• Proxy records are consistent with 5 Department of Oceanography, University of Hawai‘i at Mānoa, Honolulu, HI, USA, 6 Research School of Earth
 both weaker NADW and AABW at Sciences, Australian National University, Canberra, ACT, Australia
 the Last Glacial Maximum

Supporting Information: Abstract While previous studies consistently suggest that North Atlantic Deep Water (NADW) was
• Supporting Information S1 shallower at the Last Glacial Maximum (LGM) than at pre-industrial, its strength is still controversial.
 Here, using a series of LGM experiments, we show that proxy records are consistent with a shallower and
Correspondence to: ∼50% weaker NADW, associated with a ∼3◦ equatorward shift of the sea ice edge and convection sites in
L. Menviel, the Norwegian Sea. A shoaling and weakening of NADW further allow penetration of Antarctic Bottom
l.menviel@unsw.edu.au Water in the North Atlantic, despite Antarctic Bottom Water transport being reduced by ∼40%. While the
 Deep Western Boundary Current in the northwest Atlantic weakens with NADW, the mid-depth
Citation: southward flow on the east side of the north Mid-Atlantic Ridge strengthens, consistent with paleorecords.
Menviel, L. C., Spence, P., This northeast Atlantic intensification is due to a change in density gradients: a weaker AMOC reduces the
Skinner, L. C., Tachikawa, K.,
Friedrich, T., Missiaen, L., & Yu, J. transport of equatorial waters to the northeast Atlantic, thus weakening the North Atlantic zonal density
(2020). Enhanced middepth gradient. The resultant globally weaker oceanic circulation at the LGM would have contributed to an
southward transport in the northeast increase in oceanic carbon content and thus a decrease in atmospheric CO2 concentration.
Atlantic at the Last Glacial Maximum
despite a weaker AMOC. Paleo-
ceanography and Paleoclimatology, 35,
e2019PA003793. https://doi.org/10. 1. Introduction
1029/2019PA003793
 The Atlantic Meridional Overturning Circulation (AMOC), which is defined by the zonally integrated flow
Received 13 OCT 2019 in the Atlantic, depends on North Atlantic Deep Water (NADW) and Antarctic Bottom Water (AABW)
Accepted 17 JAN 2020 transport in the Atlantic basin. Today, NADW is composed of Labrador Sea Water (LSW), Denmark Strait
Accepted article online 3 FEB 2020 Overflow Water, and Iceland-Scotland Overflow Water, which are formed by deep ocean convection and
 brine rejection in the Labrador Sea and Nordic Seas, respectively (Bullister et al., 2013). In the subpolar
 North Atlantic, these water masses merge and flow southward along the Deep Western Boundary Current
 (Talley et al., 2011). The surface and subsurface circulation of the North Atlantic are also influenced by the
 AMOC, with one of the main features of the upper branch of the AMOC being the Gulf Stream and its exten-
 sion the North Atlantic Current (NAC). The Gulf Stream follows the east coast of North America from the
 tip of Florida to Newfoundland, after which it crosses the Atlantic as the NAC bringing warm waters to the
 northeast Atlantic. Despite the AMOC influence on climate and on the global carbon cycle, past changes
 in its strength are still a matter of debate, and in particular its state at the Last Glacial Maximum (LGM,
 ∼21,000 years ago) (e.g., Hesse et al., 2011; Kurahashi-Nakamura et al., 2017; Lippold et al., 2012; Menviel
 et al., 2017).
 The LGM was characterized by a global mean sea level ∼134 m lower than present (Lambeck et al., 2014)
 due to large continental ice sheets covering North America and Eurasia (e.g., Abe-Ouchi et al., 2015; Tarasov
 et al., 2012) and by a concentration of atmospheric carbon dioxide (CO2 ) ∼100 ppm lower (Marcott et al.,
 2011). At the LGM, NADW formation was most likely different from today due to the significant sea ice
 advance in the Labrador and Nordic Seas (Yang et al., 2006).
 The different geochemical properties of NADW and AABW have been used to reconstruct their extent in the
©2020. American Geophysical Union. Atlantic at the LGM. NADW is characterized by low nutrients (e.g., PO4 ) and dissolved inorganic carbon
All Rights Reserved. (DIC) concentrations, as well as high carbonate ions content, because most surface nutrients are utilized

MENVIEL ET AL. 1 of 12
Paleoceanography 10.1029/2019PA003793

 by phytoplankton within the NAC. Since carbon isotope fractionation mostly occurs during photosynthesis,
 preferentially incorporating 12 C into organic matter, NADW has relatively high 13 C values. In contrast, due
 to low nutrient utilization at the surface of the Southern Ocean, AABW displays a high nutrient content and
 low 13 C values. Neodymium (Nd) isotopic ratios (143 Nd/144 Nd, Nd) have also been used to infer changes in
 the Atlantic ocean circulation as the NADW end-member has a much lower Nd (∼ −12.3±0.9) than AABW
 (∼ −8.6 ± 0.6) (Tachikawa et al., 2017). Lower PO4 (Marchitto, 2006), and higher carbonate ions content (Yu
 et al., 2008), as well as higher benthic 13 C (Curry & Oppo, 2005) and Nd (Howe et al., 2016) in the upper
 2,000 m of the North Atlantic at the LGM have thus been interpreted as indicating a shallower NADW. An
 expansion of AABW into the deep North Atlantic has been deduced from higher PO4 content, lower 13 C
 values below 2,500 m depth (Curry & Oppo, 2005; Marchitto, 2006), and higher Nd (Howe et al., 2016).
 However, assessing the AMOC strength at the LGM has proven more elusive and controversial because no
 proxies can provide a quantitative estimate of the AMOC strength. Radiocarbon “ventilation ages” inform
 on the rate of ventilation but are complicated by the impacts of variable air-sea gas exchange efficiency and
 water mass sourcing (e.g., Skinner et al., 2017). Since 231 Pa has a much longer residence time than 230 Th
 in the ocean, sedimentary 231 Pa/230 Th has also been used as a proxy for AMOC strength (e.g., Henry et al.,
 2016; McManus et al., 2004). Higher ventilation ages below 2,000 m depth in the North Atlantic (Freeman
 et al., 2016; Skinner et al., 2017) as well as changes in vertical 231 Pa/230 Th profiles (Bradtmiller et al., 2014;
 Gherardi et al., 2005; Lippold et al., 2012, 2016; McManus et al., 2004; Ng et al., 2018) support a shoaling of
 NADW and enhanced AABW incursion. However, while 231 Pa/230 Th (Gherardi et al., 2005; Lippold et al.,
 2016; McManus et al., 2004; Ng et al., 2018) records from the northwest Atlantic suggest a weaker LGM
 NADW transport, records from the northeast Atlantic suggest that the LGM mid-depth (here defined as
 ∼1,500 to 3,000 m depth) transport was as strong as during pre-industrial (PI) (Balmer & Sarnthein, 2018;
 Gherardi et al., 2005; Lippold et al., 2012), despite some radiocarbon evidence for poor ventilation below
 2,000 m depth (Freeman et al., 2016; Skinner et al., 2017).
 The latest LGM simulations performed as part of the Paleoclimate Modelling Intercomparison Project phase
 3 (PMIP3) cannot inform on the possible AMOC strength at the LGM, as all models, apart from CCSM4,
 simulate a deeper boundary between NADW and AABW (Muglia & Schmittner, 2015), in contrast to what
 is suggested by paleo-records. The consistent AMOC strengthening and deepening in these PMIP3 LGM
 simulations has been partly attributed to stronger North Atlantic windstress (Muglia & Schmittner, 2015).
 Only CCSM4 displays a 275 m shoaling of NADW with a marginal strengthening of 1.8 Sv (+9%), but it
 has not been shown whether this small AMOC change would lead to a tracer distribution that would be in
 agreement with paleoproxy records.
 To further our understanding of the LGM AMOC, the sensitivity of nutrients, 18 O, 13 C, or ventilation ages
 to different Atlantic oceanic circulation states has been tested and compared to paleorecords (e.g., Hesse
 et al., 2011; Kurahashi-Nakamura et al., 2017; Menviel et al., 2017; Muglia et al., 2018; Tagliabue et al.,
 2009). These model outputs/paleodata comparisons provide additional evidence for a shoaling of NADW at
 the LGM but do not provide a consensus on the change in AMOC strength. However, to date, no modeling
 study has looked into how AMOC changes at the LGM could impact the mid-depth oceanic circulation and
 particularly zonal differences across the North Atlantic.
 Here, using a suite of experiments performed with an Earth system model, which includes 13 C, radiocar-
 bon, and Nd, we study the relations between location of deep ocean convection in the Nordic and Labrador
 Seas, NADW and AABW transport, and the strength of North Atlantic mid-depth ocean currents. The result-
 ing North Atlantic tracer profiles are compared to existing paleoproxy records, in order to assess whether the
 zonal differences recorded in North Atlantic proxy records can be explained, and whether this can inform
 on the LGM AMOC strength.

 2. Methods
 A series of LGM experiments is performed with the Earth system model of intermediate complexity LOVE-
 CLIM. LOVECLIM includes an ocean general circulation model (3◦ by 3◦ , 20 vertical levels), fully coupled
 to a dynamic-thermodynamic sea ice model, a quasi-geostrophic atmospheric model (T21 resolution), and a
 land and marine carbon cycle model (Goosse et al., 2010). The model also includes carbon isotopes (Menviel
 et al., 2015) and Nd (Friedrich et al., 2014).

MENVIEL ET AL. 2 of 12
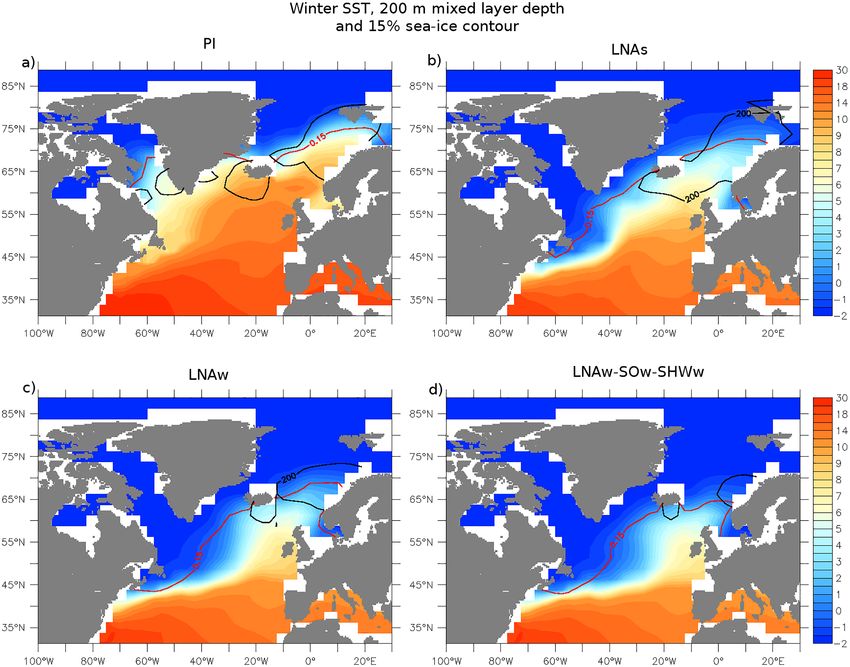
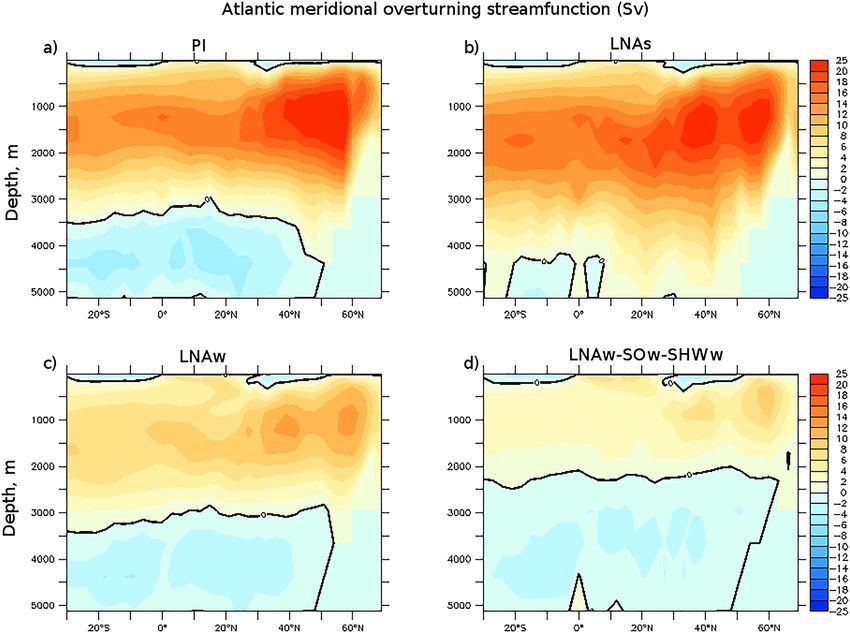
Paleoceanography 10.1029/2019PA003793

 A set of LGM experiments with different oceanic circulation states performed with the carbon
 isotopes-enabled version of LOVECLIM is described in Menviel et al. (2017). However, since these exper-
 iments did not include Nd, a new series of LGM experiments is performed. The initial conditions of the
 experiments are taken from a LGM experiment (V3L in Menviel et al., 2017), which features a strong AMOC,
 and a mean LGM oceanic 13 C that is ˜0.34‰ lower than at PI. From there, LOVECLIM is equilibrated to
 LGM boundary conditions by applying appropriate orbital parameters (Berger, 1978), Northern Hemisphere
 ice sheets topography and albedo (Abe-Ouchi et al., 2007), atmospheric greenhouse gases concentrations
 (190 ppm for CO2 , 379.12 ppb for CH4 and 199 ppb for N2 O), and their isotopic values (−6.45‰ for 13 CO2
 and 400‰ for Δ14 CO2 ), as well as a closed Bering Strait.
 The default LGM experiment thus obtained displays a strong AMOC and is referred to as LNAs. To mimic
 the background meltwater runoff from the large Northern Hemisphere ice sheets, which is not captured by
 our model setup, freshwater is added (0.1 Sv) into the North Atlantic for 3,000 years (LNAw). The model
 setup does not take into account the advance of the glacial Antarctic ice sheet onto the Ross and Weddell
 Seas (Bentley et al., 2014), which are the main regions of AABW formation today. Ice sheet advance onto
 the Antarctic continental shelves could have led to a weaker AABW formation at the LGM than PI. Start-
 ing from LNAw, AABW is weakened by adding meltwater into the Southern Ocean (0.07 Sv, LNAw-SOw).
 Finally, it has been hypothesized that the strength of the Southern Ocean upwelling, mainly modulated by
 the Southern Hemispheric westerlies, would provide a strong control on carbon transfer from the deep ocean
 to the atmosphere, and thus on the atmospheric CO2 concentration (Toggweiler et al., 2006). To account for
 potential changes in the strength of the Southern Hemispheric westerlies, that might not be captured by
 LOVECLIM, additional simulations are forced by a 20% weakening of the Southern Hemispheric westerlies
 (LNAw-SHWw), or both a Southern Ocean meltwater input and a weakening of the Southern Hemispheric
 westerlies (LNAw-SOw-SHWw).
 As there are some small differences in initial conditions and forcings applied across the LGM experiments
 described in Menviel et al. (2017) and the ones performed here, the resultant oceanic circulation states differ
 slightly (supporting information Table S1). Therefore, both set of experiments are included here, as this
 provides a larger ensemble of simulations to study the relationship between AMOC strength and currents
 with greater statistical confidence.
 To understand the processes leading to changes in North Atlantic 13 C between the LGM and PI, 13 C
 anomalies (Δ 13 C) are decomposed into their biological ( 13 CBIO ) and thermodynamic ( 13 CTH ) compo-
 nents. Since there is no fractionation during carbonate precipitation in this version of the model, the
 biological impact on 13 C can be estimated by the change in remineralized carbon (Corg ):

 13 Corg
 ∗12
 Corg 13 Corg ∗ Rc∕p ∗ PRem
 13 CBIO = 12 C
 = 12 C
 (1)

 with −20‰ for 13 Corg , PRem phosphate generated through remineralization and estimated from the apparent
 oxygen utilization (AOU) (PRem =AOU/Ro∕p ). Rc∕p and Ro∕p are the carbon over phosphate and oxygen over
 phosphate Redfield ratios equal to 117 and 170, respectively. Δ 13 CTH reflects the changes in 13 C due to
 air-sea gas exchange and temperature and is estimated by Δ 13 CTH = Δ 13 C −Δ 13 CBIO .
 This decomposition assumes that dissolved oxygen in the ocean could have reached equilibrium everywhere.
 Due to disequilibrium during air-sea gas exchange, AOU changes might be overestimated and therefore so
 might be 13 CBIO estimates (Khatiwala et al., 2019).

 3. Sea Ice and Deep Ocean Convection
 The preindustrial (PI) experiment is characterized by a strong AMOC (∼25 Sv, Figure 1a), with deep ocean
 convection occurring in the Norwegian Sea, the Labrador Sea, and south of Iceland (Figure 2a). In agreement
 with recent data from the Overturning in the Subpolar North Atlantic Program (Lozier et al., 2019), the
 transport between Greenland and Scotland dominates the overturning and varies between ∼10 and 17 Sv.
 Under LGM conditions, the model simulates an AMOC as strong as PI (∼25 Sv, Figure 1b, LNAs), but with
 NADW reaching the abyssal North Atlantic and filling most of the Atlantic basin. Several processes lead to
 this strong LGM AMOC: colder conditions, the closure of the Bering Strait (Hu et al., 2012), and stronger
 polar easterlies in the Nordic Seas. Deep ocean convection still occurs in the Norwegian Sea and south of

MENVIEL ET AL. 3 of 12
Paleoceanography 10.1029/2019PA003793

Figure 1. Meridional overturning streamfunction in the Atlantic basin (Sv) for (a) the preindustrial control run (PI), the LGM state with (b) strong NADW
(LNAs), (c) weak NADW (LNAw), and (d) weak NADW and weak AABW (LNAw-SOw-SHWw). The 0 Sv line is in black.

 Iceland (Figure 2b), but sea ice advance over the Labrador Sea inhibits deep ocean convection in that region.
 In fact, all the simulations performed here suggest that there is no LSW under LGM conditions due to the
 sea ice advance. As LSW has a very low Nd, a lack of LSW induces positive Nd anomalies in the deep
 northwest Atlantic (Figure 3i), in agreement with LGM Nd values from the western Atlantic (Böhm et al.,
 2015; Howe et al., 2016; Lippold et al., 2016).
 However, paleoproxy records do not support strong NADW transport below 3,000 m depth at the LGM,
 and some processes, such as increased runoff from surrounding ice sheets, are not included in the model.
 When meltwater is added to the North Atlantic, the AMOC weakens to 14.7 Sv (Figure 1c, LNAw).
 Greater stratification and a reduced meridional heat transport to the North Atlantic due to weaker AMOC
 (Krebs & Timmermann, 2007) induces a 3◦ equatorward shift of the winter sea ice edge in the Norwegian
 Sea (Figure 2c). The lack of deep-ocean convection during boreal summer leads to an advance of the summer
 sea ice edge in the Nordic Seas to ∼ 65◦ N and to 55◦ N on the western side of the Labrador Sea.
 The AABW, defined here as the minimum of the meridional overturning streamfunction in the Southern
 Ocean, is strong at −12.6 Sv for PI, and −14.6 Sv for both LNAs and LNAw. Despite AABW being strong in
 LNAs, it does not penetrate into the North Atlantic because the strong and deep NADW prevents it. A mod-
 ification of both the buoyancy and dynamic forcing over the Southern Ocean causes a reduction of AABW
 formation to −7.8 Sv, but also reduces the Southern Ocean upwelling, which in turns weakens the AMOC
 to 11.2 Sv (Figure 1d, LNAw-SOw-SHWw, Methods). This AMOC weakening further cools the northeast
 Atlantic, shifting both the winter and summer sea ice edges by an additional ∼ 2◦ southward, and restrict-
 ing deep ocean convection to a small area in the southern part of the Norwegian Sea, as well as south of

MENVIEL ET AL. 4 of 12

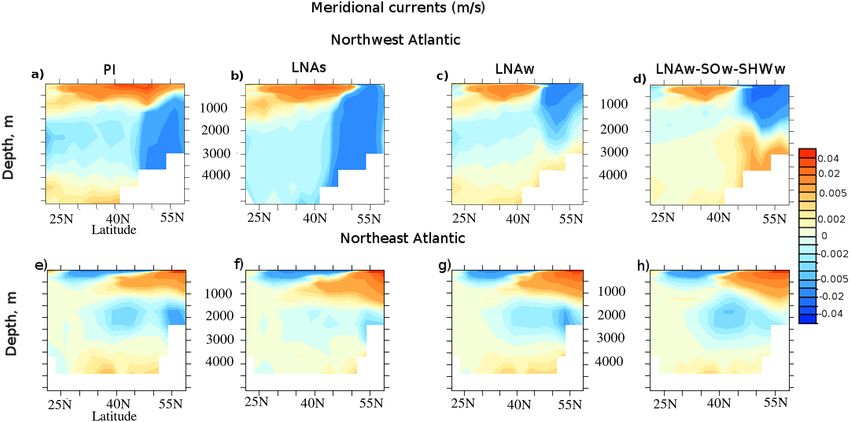
Paleoceanography 10.1029/2019PA003793

Figure 2. Winter SST (shading, ◦ C), mixed layer depth (black contour, 200 m) and 15% sea ice concentration (red contour) for (a) the preindustrial experiment,
and the LGM states with (b) a strong NADW (LNAs), (c) a weak NADW (LNAw), and (d) weak NADW and weak AABW (LNAw-SOw-SHWw).

 Iceland (Figure 2d). The AMOC weakening is also associated with a significant shoaling of the
 NADW/AABW boundary to 2,400 m depth, further away from bottom topography, which reduces mixing
 and increases stratification (De Boer & Hogg, 2014), as seen in the North Atlantic vertical tracer distribution
 (Figure 3).

 4. North Atlantic Middepth Currents
 At PI, the Deep Western Boundary Current (DWBC), a southward flow occurring between 1,500 and 3,500 m
 depth in the northwest Atlantic, is strong (Figures 4a and 5a, black circle, ∼15 Sv) and overlays an abyssal
 northern flow of southern-sourced waters. Under LGM conditions, when NADW is strong, the DWBC trans-
 port is similar but deeper, with the southward flow dominating below ∼2,000 m depth (Figures 4b and 5a,
 blue triangle). As the AMOC weakens, so does the DWBC (R = 0.95, Figure 5a), which also shoals, thus
 allowing an abyssal northern flow of southern-sourced waters (Figures 4c and 4d). Despite its weaker global
 transport in experiment LNAw-SOw-SHWw, AABW fills the lower half of the Atlantic basin as a result of
 the weaker and shallower NADW.
 The northeastern Atlantic basin also features a middepth southward flow on the eastern side of the
 Mid-Atlantic Ridge (MAR) in PI, albeit much weaker (∼3 Sv) than in the northwest Atlantic (Figure 4e), and
 which overlays a northward abyssal flow of southern-sourced waters. In contrast to the western Atlantic, as

MENVIEL ET AL. 5 of 12
Paleoceanography 10.1029/2019PA003793

Figure 3. Tracers vertical profiles in the northwestern and northeastern Atlantic. Vertical profiles of (a, b) DIC (μmol L−1 ), (c, d) PO4 (μmol L−1 ), (e, f) 13 C
(‰), (g, h) ventilation age (years) and (i, j) Nd averaged over (top) the northwest Atlantic and (bottom) the northeast Atlantic for (black) the preindustrial
control run, and the LGM states with strong NADW (red, LNAs), weak NADW (green, LNAw), and weak NADW and weak AABW (blue, LNAw-SOw-SHWw).
The simulated variables are averaged over the areas that include proxy records: 39–30◦ W/41–65◦ N and 28–14◦ W/42–62◦ N for PO4 , 76–30◦ W/28–56◦ N and
28–7◦ W/27–61◦ N for 13 C, 86–44◦ W/0–44◦ N and 27–9◦ W/5–38◦ N for ventilation ages, and 77–32◦ W/12–41◦ N and 23–20◦ W/18–25◦ N for Nd. For DIC the
respective western and eastern basins are defined as follows: 80–35◦ W/30–60◦ N and 25◦ W to 0◦ E/30–60◦ N. The blue triangles indicate LGM, (c, d) PO4
estimates from Cd/Ca measurements (Marchitto, 2006) (Table S2), (e, f) benthic 13 C (Peterson et al., 2014) (Table S3), (g, h) ventilation age estimates from
benthic foraminifera (filled triangles from Skinner et al., 2017, and empty triangle from Balmer & Sarnthein, 2018) (Table S4) and (i,j) Nd data (Foster et al.,
2007; Gutjahr et al., 2008; Roberts et al., 2010; Böhm et al., 2015; Howe et al., 2016; Land et al., 2016; Lippold et al., 2016; Howe et al., 2017) (Table S5).

Figure 4. Northwestern (top row) and northeastern (bottom row) Atlantic meridional ocean currents (m/s) averaged over (top) 80–38◦ W until 50◦ N and
43–38◦ W north of that, (bottom) 25◦ W to 0◦ E for (a, e) the preindustrial control run (PI), and the LGM states with (b,f) a strong AMOC (LNAs), (c,g) a weak
AMOC (LNAw), and (d,h) weak AMOC and weak AABW (LNAw-SOw-SHWw). Positive values indicate a northward flow.

MENVIEL ET AL. 6 of 12
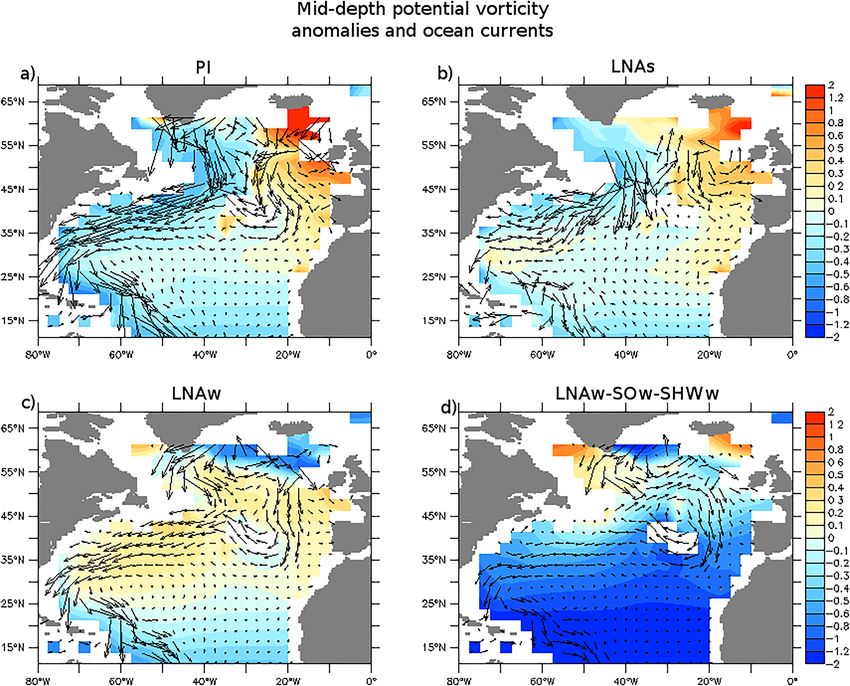
Paleoceanography 10.1029/2019PA003793

Figure 5. Relationship between AMOC and southward transport. (a) AMOC versus western boundary transport defined as the southward transport at
30◦ N/74–68◦ W, and depths greater than 1,000 m (depth interval varies with the simulation to calculate only the southward flow, Table S1). (b) AMOC versus
transport on the east side of the MAR defined as the southward transport at 40◦ N/22–16◦ W, and depths greater than 1,000 m (depth interval varies with the
simulation to calculate only the southward flow, Table S1); dashed lines represent ±1 . (c) Zonal temperature gradient at ∼ 50◦ N and averaged over the upper
1,443 m depth (40–38◦ W compared to 24–20◦ W) versus transport on the east side of the MAR for a set of LGM experiments (section 2 and Table S1). The black
dot is the preindustrial control run, the blue triangle is LNAs, the blue star is LNAw, and the red star is LNAw-SOw-SHWw. Red symbols indicate the
simulations for which the transport on the east side of the MAR is significantly stronger (≥ 1 ) than the preindustrial. Linear regressions (solid black lines) do
not take into account the experiments with NADW off (represented by the green dots).

 the AMOC weakens, the southward transport on the east side of the MAR intensifies (Figures 4g, 4h, and
 5b, R = −0.72, and Figure 6). This southward transport is over 1 stronger than in PI (Figure 5, red sym-
 bols), when the AMOC is in an intermediate state (8.5 to 11 Sv), and the Nordic Sea convection site is at its
 southernmost location (∼ 65◦ N, Figure 2d).
 This intensification of middepth transport on the east side of the MAR is linked to a change in zonal den-
 sity gradient and thus to changes in the potential vorticity field (q=- . , with the ocean density, and f
 0 z
 the Coriolis parameter). Geostrophic flows do not easily flow across potential vorticity gradients. When the
 AMOC is strong, there is a strong zonal potential vorticity gradient at middepth north of 45◦ N that inhibits
 the zonal flow and directs the flow toward the DWBC (Figures 6a and 6b). This strong zonal potential vortic-
 ity gradient is in part due to zonal temperature differences (Figures 2 and 5c) arising from the North Atlantic
 Ocean circulation. Indeed, the NAC brings warm buoyant waters to the northeast Atlantic, reaching down
 to a depth of ∼1,000 m. By contrast, the northwest Atlantic is under the influence of the return flow of cold
 and fresh waters associated with the subpolar gyre, thus giving rise to a strong zonal temperature gradient
 (Figure 5c). As the AMOC weakens, so does the NAC, and thus the northeast Atlantic cools and lightens
 much more than the northwest Atlantic, reducing the zonal density gradient. The middepth zonal potential
 vorticity gradient north of 45◦ N decreases and is displaced westward (Figure 6c), thus allowing for a south-
 ward flow on both sides of the MAR. In LNAw-SOw-SHWw, the zonal potential vorticity gradient between
 45◦ N and 55◦ N is weak, thus allowing the NADW to flow on the east side of the MAR (Figure 6d).

 5. Comparison With Paleorecords and Implications
 As NADW features low PO4 , and high 13 C compared to AABW, past AMOC changes can be inferred
 from geochemical analyses of marine sediment cores. The PO4 content will increase and 13 C will decrease
 as organic matter is remineralized and a water mass ages, but 13 C is also influenced by air-sea gas
 exchange. Since dissolved Cd distribution in the ocean is very similar to PO4 , past changes in seawater PO4
 concentration can be estimated by measuring Cd/Ca in foraminifera shells (Marchitto, 2006).
 In experiment LNAw-SOw-SHWw, as a result of the weaker and shallower NADW, AABW fills the lower
 half of the Atlantic basin despite AABW being weaker (Figure 4). This leads to a strong increase in verti-
 cal tracer gradients in the North Atlantic. Even though the AMOC is weaker, the PO4 concentration is low
 (below 1.6 μmol/L) and 13 C is high above ∼2,000 m depth, in agreement with LGM 13 C and Cd/Ca records
 (Marchitto, 2006; Peterson et al., 2014) (Figures 3c–3f, blue line and triangles). On the other hand, as sug-
 gested by proxy records, southern-sourced low 13 C/high PO4 waters reach both sides of the North Atlantic
 below ∼2,500 m depth (Figures 3c–3f, blue line and triangles).

MENVIEL ET AL. 7 of 12
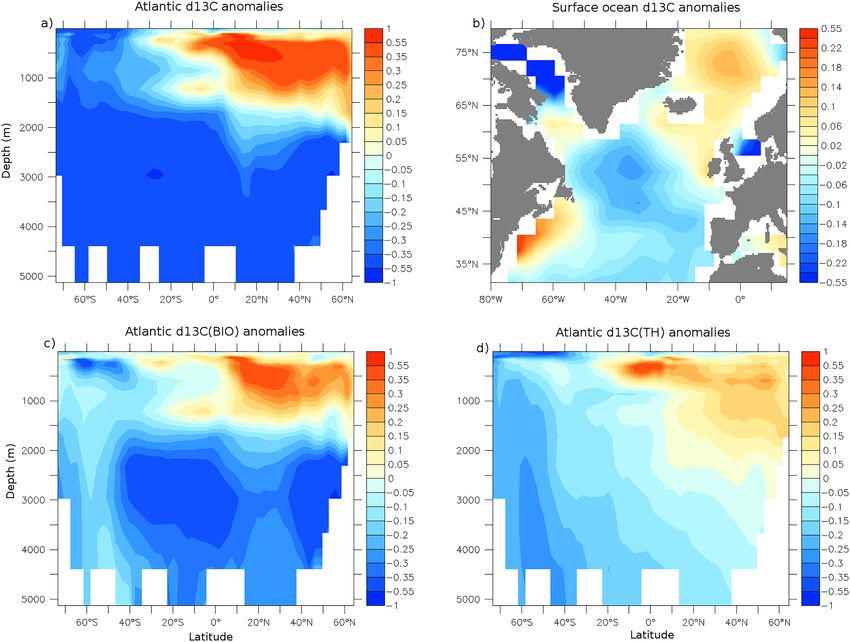
Paleoceanography 10.1029/2019PA003793

Figure 6. Mid-depth potential vorticity and ocean currents. Potential vorticity (q = − .
 z
 ) anomalies with respect to the northern North Atlantic
 0
(50–60◦ N/60–0◦ W, m−1 ·s−1 , shaded) at 1,443–2,622 m depth with currents (m/s) overlaid for (a) the preindustrial control run, and the LGM states with (b)
strong NADW, (c) weak NADW, and (d) weak NADW and weak AABW.

 To understand the processes leading to the positive 13 C anomaly simulated in the North Atlantic from
 the subsurface down to 1,500 m depth in LNAw-SOw-SHWw, the change in 13 C is decomposed into its
 biological ( 13 CBIO ) and thermodynamic ( 13 CTH ) components (Methods). As seen in Figure 7, the positive
 North Atlantic 13 C anomaly can be attributed at 70% to 13 CBIO and at 30% to 13 CTH . Even if a part of this
 13 CBIO could be due to the ∼40% lower export production in the North Atlantic, the changes in subsurface
 to middepth currents also significantly contribute. The weaker AMOC indeed leads to a reduction in the
 northward transport of intermediate-depth low latitude waters, with low 13 C/high PO4 concentration, to
 the northwest Atlantic (Figure 4). The change in 13 CTH can be attributed to the strong surface cooling
 (−6.7 ◦ C), as well as to the southward shift of the convection site. Intermediate-depth North Atlantic 13 C
 anomalies are thus due to both a change in 13 C and PO4 NADW end-members, as well as to changes in
 oceanic circulation. It should however be noted that, as this decomposition method relies on calculating
 AOU from the saturated dissolved O2 concentration in the ocean, 13 CBIO changes might be overestimated
 (Khatiwala et al., 2019).
 Even if the simulated AMOC is weaker, the southward transport in the upper 1,500 m is still relatively strong
 and leads to ventilation ages within ∼250 years of PI (Figures 3g and 3h, blue line). As the deep North
 Atlantic is filled with southern-sourced waters, simulated ventilation ages below 3,000 m depth are ∼1,500
 and 1,000 years higher in the northwest and northeast Atlantic, respectively, compared to PI. This is in good

MENVIEL ET AL. 8 of 12
Paleoceanography 10.1029/2019PA003793

Figure 7. Attributing 13 C changes. (a) 13 C anomalies zonally averaged over the Atlantic; (b) surface 13 C anomalies; (c) 13 CBIO and (d) 13 CTH anomalies
zonally averaged over the Atlantic (‰) for LNAw-SOw-SHWw compared to PI.

 agreement with ventilation ages estimated from benthic foraminifera (Freeman et al., 2016; Skinner et al.,
 2017) (Figures 3g and 3h, blue filled triangles), even if the proxy records suggest that ventilation ages in the
 northwest Atlantic could be up to 400 years lower than in the northeast Atlantic between 3,000 and 4,000 m
 depth. The very low ventilation age estimated at 3,000 m depth on the Azores plateau (Figure 3h, empty
 blue triangle, Balmer & Sarnthein, 2018) is at odds with other North Atlantic measurements and cannot be
 reconciled with any of the simulations. The simulated transport in the deep northwest Atlantic could thus
 be a bit too weak in LNAw-SOw-SHWw, but paleoproxy records are consistent with a weaker circulation
 than the one simulated in LNAw.
 The main difference in Nd between the PI and all the LGM simulations is the lack of LSW, which induces
 a reduced zonal Nd gradient in the North Atlantic at the LGM (Figures 3i and 3j). In the deep northeast
 Atlantic, Nd decreases as AABW weakens (Figure 3j) because in the case of a “stagnant” ocean, boundary
 exchange with low- Nd boundaries such as the Gulf of Guinea, dominates the Nd signature. This mismatch
 with proxy records could be due to a greater AABW Nd end-member at the LGM, or an overestimated
 boundary exchange effect in the model.
 This increase in North Atlantic vertical tracer gradient at the LGM is also seen in the simulated DIC profile,
 with relatively low DIC concentration at intermediate depth and high concentration below ∼2,200 m depth.
 Weak NADW and AABW thus allow carbon sequestration in the deep North Atlantic Ocean (Figures 3a and
 3b), which would contribute to decreasing the atmospheric CO2 concentration at the LGM. As shown in
 Menviel et al. (2017), this weak oceanic circulation state allows for a 504 Gt C increase in deep ocean carbon.

MENVIEL ET AL. 9 of 12
Paleoceanography 10.1029/2019PA003793

 6. Discussion and Conclusions
 The LGM AMOC strength is modulated by several processes including the buoyancy of surface waters in the
 NADW formation region, itself being a function of the North Atlantic/Nordic Sea temperature and freshwa-
 ter budget, the density contrast between NADW and AABW (Weber et al., 2007), North Atlantic windstress
 (Muglia & Schmittner, 2015; Sherriff-Tadano et al., 2018), and the closure of the Bering Strait (Hu et al.,
 2012). A stronger halocline in the Nordic Seas at the LGM would lead to sea ice advance, and a weaken-
 ing of NADW formation (Oka et al., 2012). The simulations presented here suggest that sea ice advance at
 the LGM could have been associated with cessation of deep-ocean convection in the Labrador Sea, a south-
 ward shift of the convection site in the Norwegian Sea, and convection south of Iceland, thus leading to a
 weaker AMOC, consistent with benthic 18 O and 13 C records (Elmore et al., 2015; Meland et al., 2008; Millo
 et al., 2006). Furthermore, even in the most extreme scenario (LNAw-SOw-SHWw), the Norwegian Sea sea
 ice concentration is less than 50% for most of the year at ∼ 66◦ N, in agreement with paleoproxy records
 (de Vernal et al., 2006). In these simulations, the lack of a LSW signal is the dominant control on the Atlantic
 Nd distribution, with NADW and AABW strength only playing relatively minor roles (Figures 3i and 3j).
 While the LGM simulation presented here agrees well with paleoproxy records of ocean surface conditions
 and North Atlantic ventilation, correctly simulating deep ocean convection is a challenge for ocean general
 circulation models (Heuzé, 2017). The location of convection and the respective strength of the convection
 sites should thus be further assessed in future studies.
 For a range of deep ocean convection locations, the strength of the DWBC decreases with the AMOC
 (Figure 5a), thus supporting the hypothesis that changes in 231 Pa/230 Th in the northwest Atlantic reflect
 AMOC changes (e.g., Gherardi et al., 2005; Henry et al., 2016; McManus et al., 2004). However, our simula-
 tions suggest that the middepth southward transport on the eastern side of the MAR will weaken only when
 NADW formation has almost ceased (Figure 5b). Therefore, ventilation records from the eastern side of the
 MAR will not directly reflect the AMOC strength.
 The best fit with paleoproxy records is obtained for a LGM simulation with ∼50% reduced NADW and 40%
 weaker AABW (LNAw-SOw-SHWw), even though the oceanic circulation could potentially be a bit too weak
 in that scenario. Menviel et al. (2017) showed that another simulation with a similarly weak NADW, but
 AABW 11% weaker than PI (LNAw-SOw) could also provide a reasonable fit. However, the paleodata sug-
 gest strong vertical stratification in the North Atlantic at the LGM, which is best represented by simulation
 LNAw-SOw-SHWw (Figure 3, blue lines). Compared to PI, this simulation suggests a weaker flow on the
 western side and stronger flow on the eastern side of the MAR, which are both consistent with North Atlantic
 231
 Pa/230 Th records (Ng et al., 2018).
 Taking into account this east-west reorganization, we have shown that both northeastern and northwestern
 Atlantic proxy records are consistent with a weaker AMOC at the LGM. In addition, southern-sourced waters
 can fill the North Atlantic below ∼2,500 m depth despite the AABW transport being reduced.
 Compared to an LGM state with a strong AMOC, a LGM simulation with weak AMOC leads to an increase
 in deep (below 2,600 m depth) ocean carbon content of 216 Gt C, while a LGM simulation with weak NADW
Acknowledgments and AABW leads to a 504 Gt C increase (Menviel et al., 2017). A globally weaker ocean circulation in the
This project was supported by the Atlantic at the LGM, as consistent with proxy records, would thus contribute to lowering atmospheric CO2
Australian Research Council. L. C. M., by increasing the oceanic carbon content. However, future studies will need to detail the physical processes
L. M., P. S., and J. Y. acknowledge
funding from the Australian Research leading to such a weak oceanic circulation at the LGM.
Council Grants DE150100107,
DP180100048, DE150100223, Data Availability Statement
FT140100993, FT180100606, and
DP140101393. L. C. S. acknowledges The paleoproxy data described in this study and the data from Figure 3 are available in the support-
support from NERC Grant ing information. Results of the modeling experiments are available through UNSW ResData (http://
NE/L006421/1. This work also handle.unsw.edu.au/1959.4/resource/collection/resdatac_862/1, under the DOI: https://doi.org/10.26190/
benefited from discussions and
interactions made possible by the 5e1ce1e12f00f).
INQUA “IPODS” (Investigating Past
Ocean Dynamics) focus group.
LOVECLIM experiments were References
performed on a computational cluster
owned by the Faculty of Science of the Abe-Ouchi, A., Saito, F., Kageyama, M., Braconnot, P., Harrison, S. P., Lambeck, K., et al. (2015). Ice-sheet configuration in the
University of New South Wales, CMIP5/PMIP3 Last Glacial Maximum experiments. Geoscientific Model Development, 8(11), 3621–3637. https://doi.org/10.5194/
Sydney, Australia. gmd-8-3621-2015

MENVIEL ET AL. 10 of 12
Paleoceanography 10.1029/2019PA003793

 Abe-Ouchi, A., Segawa, T., & Saito, F. (2007). Climatic conditions for modelling the Northern Hemisphere ice sheets throughout the Ice
 Age cycle. Climate of the Past, 3, 423–438.
 Balmer, S., & Sarnthein, M. (2018). Glacial-to-deglacial changes in North Atlantic meltwater advection and deep-water
 formation—Centennial-to-millennial-scale 14 C records from the Azores plateau. Geochimica et Cosmochimica Acta, 236, 399–415.
 https://doi.org/10.1016/j.gca.2018.03.001
 Bentley, M. J., Cofaigh, C., Anderson, J. B., Conway, H., Davies, B., Graham, A. G., et al. (2014). A community-based geological
 reconstruction of Antarctic Ice Sheet deglaciation since the Last Glacial Maximum. Quaternary Science Reviews, 100, 1–9. https://doi.
 org/10.1016/j.quascirev.2014.06.025
 Berger, A. (1978). Long term variations of daily insolation and Quaternary climate change. Journal of the Atmospheric Sciences, 35,
 2362–2367.
 Böhm, E., Lippold, J., Gutjahr, M., Frank, M., Blaser, P., Antz, B., et al. (2015). Strong and deep Atlantic meridional overturning circulation
 during the last glacial cycle. Nature, 517, 73–76.
 Bradtmiller, L., McManus, J., & Robinson, L. (2014). 231 Pa/230 Th evidence for a weakened but persistent Atlantic meridional overturning
 circulation during Heinrich Stadial 1. Nature Communications, 5, 5817.
 Bullister, J. L., Rhein, M., & Mauritzen, C. (2013). Chapter 10—Deepwater formation. In G. Siedler, S. M. Griffies, J. Gould, & J. A. Church
 (Eds.), Ocean circulation and climate (Vol. 103, pp. 227–253). Academic Press. https://doi.org/10.1016/B978-0-12-391851-2.00010-6
 Curry, W., & Oppo, D. (2005). Glacial water mass geometry and the distribution of 13 C of ΣCO2 in the western Atlantic Ocean.
 Paleoceanography, 20, PA1017. https://doi.org/10.1029/2004PA001021
 De Boer, A. M., & Hogg, A. M. (2014). Control of the glacial carbon budget by topographically induced mixing. Geophysical Research Letters,
 41, 4277–4284. https://doi.org/10.1002/2014GL059963
 de Vernal, A., Rosell-Melé, A., Kucera, M., Hillaire-Marcel, C., Eynaud, F., Weinelt, M., et al. (2006). Comparing proxies for the
 reconstruction of LGM sea-surface conditions in the northern North Atlantic. Quaternary Science Reviews, 25(21), 2820–2834. https://
 doi.org/10.1016/j.quascirev.2006.06.006
 Elmore, A., Wright, J., & Chalk, T. (2015). Precession-driven changes in Iceland-Scotland Overflow Water penetration and bottom water
 circulation on Gardar Drift since ∼200 ka. Palaeogeography, Palaeoclimatology, Palaeoecology, 440, 551–563. https://doi.org/10.1016/j.
 palaeo.2015.09.042
 Foster, G., Vance, D., & Prytulak, J. (2007). No change in the neodymium isotope composition of deep water exported from the North
 Atlantic on glacial-interglacial time scales. Geology, 35, 37–40.
 Freeman, E., Skinner, L., Waelbroeck, C., & Hodell, D. (2016). Radiocarbon evidence for enhanced respired carbon storage in the Atlantic
 at the Last Glacial Maximum. Nature Communications, 7, 11998. https://doi.org/10.1038/ncomms11998
 Friedrich, T., Timmermann, A., Stichel, T., & Pahnke, K. (2014). Ocean circulation reconstructions from Nd : A model-based feasibility
 study. Paleoceanography, 29, 1003–1023. https://doi.org/10.1002/2014PA002658
 Gherardi, J., Labeyrie, L., McManus, J., Francois, R., Skinner, L., & Cortijo, E. (2005). Evidence from the northeastern Atlantic basin for
 variability in the rate of the meridional overturning circulation through the last deglaciation. Earth and Planetary Science Letters, 240,
 710–723.
 Goosse, H., Brovkin, V., Fichefet, T., Jongma, J., Huybrechts, P., Mouchet, A., et al. (2010). Description of the Earth system model of
 intermediate complexity LOVECLIM version 1.2. Geoscientific Model Development, 3, 603–633.
 Gutjahr, M., Frank, M., Stirling, C., Keigwin, L., & Halliday, A. (2008). Tracing the Nd isotope evolution of North Atlantic Deep and
 Intermediate Waters in the western North Atlantic since the Last Glacial Maximum from Blake Ridge sediments. Earth and Planetary
 Science Letters, 266, 61–77.
 Henry, L., McManus, J., Curry, B., Roberts, N., Piotrowski, A., & Keigwin, L. (2016). North Atlantic Ocean circulation and abrupt climate
 change during the last glaciation. Science, 353, 470–474. https://doi.org/10.1126/science.aaf5529
 Hesse, T., Butzin, M., Bickert, T., & Lohmann, G. (2011). A model-data comparison of 13 C in the glacial Atlantic Ocean. Paleoceanography,
 26, PA3220. https://doi.org/10.1029/2010PA002085
 Heuzé, C. (2017). North Atlantic deep water formation and AMOC in CMIP5 models. Ocean Science, 13(4), 609–622. https://doi.org/10.
 5194/os-13-609-2017
 Howe, J. N., Piotrowski, A. M., Hu, R., & Bory, A. (2017). Reconstruction of east-west deep water exchange in the low latitude Atlantic
 Ocean over the past 25,000 years. Earth and Planetary Science Letters, 458, 327–336. https://doi.org/10.1016/j.epsl.2016.10.048
 Howe, J., Piotrowski, A., Noble, T., Mulitza, S., Chiessi, C., & Bayon, G. (2016). North Atlantic Deep Water production during the Last
 Glacial Maximum. Nature Communications, 7, 11765. https://doi.org/10.1038/ncomms11765
 Hu, A., Meehl, G., Han, W., Timmermann, A., Otto-Bliesner, B., Liu, Z., et al. (2012). Role of the Bering Strait on the hysteresis of the
 ocean conveyor belt circulation and glacial climate stability. Proceedings of the National Academy of Sciences of the USA, 107, 6417–6422.
 https://doi.org/10.1073/pnas.1116014109
 Khatiwala, S., Schmittner, A., & Muglia, J. (2019). Air-sea disequilibrium enhances ocean carbon storage during glacial periods. Science
 Advances, 5(6), eaaw4981. https://doi.org/10.1126/sciadv.aaw4981
 Krebs, U., & Timmermann, A. (2007). Tropical air-sea interactions accelerate the recovery of the Atlantic Meridional Overturning
 Circulation after a major shutdown. Journal of Climate, 20, 4940–4956.
 Kurahashi-Nakamura, T., Paul, A., & Losch, M. (2017). Dynamical reconstruction of the global ocean state during the Last Glacial
 Maximum. Paleoceanography, 32(4), 326–350. https://doi.org/10.1002/2016PA003001
 Lambeck, K., Rouby, H., Purcell, A., Sun, Y., & Sambridge, M. (2014). Sea level and global ice volumes from the Last Glacial Maximum to
 the Holocene. Proceedings of the National Academy of Sciences, 111(43), 15,296–15,303. https://doi.org/10.1073/pnas.1411762111
 Land, D., Bailey, I., Wilson, P., Chalk, T., Foster, G., & Gutjahr, M. (2016). Incursions of southern-sourced water into the deep North Atlantic
 during late Pliocene glacial intensification. Nature Geoscience, 9, 375–379.
 Lippold, J., Gutjahr, M., Blaser, P., Christner, E., de Carvalho Ferreira, M., Mulitza, S., et al. (2016). Deep water provenance and dynamics
 of the (de)glacial Atlantic meridional overturning circulation. Earth and Planetary Science Letters, 445, 68–78. https://doi.org/10.1016/
 j.epsl.2016.04.013
 Lippold, J., Luo, Y., Francois, R., Allen, S., Gherardi, J., Pichat, S., et al. (2012). Strength and geometry of the glacial Atlantic Meridional
 Overturning Circulation. Nature Geoscience, 5, 813–816.
 Lozier, M. S., Li, F., Bacon, S., Bahr, F., Bower, A. S., Cunningham, S. A., et al. (2019). A sea change in our view of overturning in the
 subpolar North Atlantic. Science, 363(6426), 516–521. https://doi.org/10.1126/science.aau6592
 Marchitto, T. (2006). Deep water mass geometry in the glacial Atlantic Ocean: A review of constraints from the paleonutrient proxy Cd/Ca.
 Geochemistry Geophysics Geosystems, 7, Q12003. https://doi.org/10.1029/2006GC001323

MENVIEL ET AL. 11 of 12
Paleoceanography 10.1029/2019PA003793

 Marcott, S., Clark, P., Padman, L., Klinkhammer, G., Springer, S., Liu, Z., et al. (2011). Ice-shelf collapse from subsurface warming as trigger
 for Heinrich events. Proceedings of the National Academy of Sciences, 108, 13,415–13,419. https://doi.org/10.1073/pnas.1104772108
 McManus, J. F., Francois, R., Gherardi, J. M., Keigwin, L. D., & Brown-Leger, S. (2004). Collapse and rapid resumption of Atlantic
 meridional circulation linked to deglacial climate changes. Nature, 428, 834–837.
 Meland, M., Dokken, T., Jansen, E., & Hevrøy, K. (2008). Water mass properties and exchange between the Nordic seas and the northern
 North Atlantic during the period 23–6 ka: Benthic oxygen isotopic evidence. Paleoceanography, 23, PA1210. https://doi.org/10.1029/
 2007PA001416
 Menviel, L., Mouchet, A., Meissner, K., Joos, F., & England, M. (2015). Impact of oceanic circulation changes on atmospheric 13 CO2 .
 Global Biogeochemical Cycles, 29, 1944–1961. https://doi.org/10.1002/2015GB005207
 Menviel, L., Yu, J., Joos, F., Mouchet, A., Meissner, K., & England, M. (2017). Poorly ventilated deep ocean at the Last Glacial Maximum
 inferred from carbon isotopes: A data-model comparison study. Paleoceanography, 32, 2–17. https://doi.org/10.1002/2016PA003024
 Millo, C., Sarnthein, M., Voelker, A., & Erlenkeuser, H. (2006). Variability of the Denmark Strait overflow during the Last Glacial Maximum.
 Boreas, 35(1), 50–60. https://doi.org/10.1111/j.1502-3885.2006.tb01112.x
 Muglia, J., & Schmittner, A. (2015). Glacial Atlantic overturning increased by wind stress in climate models. Geophysical Research Letters,
 42, 9862–9868. https://doi.org/10.1002/2015GL064583
 Muglia, J., Skinner, L. C., & Schmittner, A. (2018). Weak overturning circulation and high Southern Ocean nutrient utilization maximized
 glacial ocean carbon. Earth and Planetary Science Letters, 496, 47–56. https://doi.org/10.1016/j.epsl.2018.05.038
 Ng, H., Robinson, L., McManus, J., Mohamed, K., Jacobel, A., Ivanovic, R., et al. (2018). Coherent deglacial changes in deep Atlantic Ocean
 circulation. Nature Communications, 9, 2947. https://doi.org/10.1038/s41467-018-05312-3
 Oka, A., Hasumi, H., & Abe-Ouchi, A. (2012). The thermal threshold of the Atlantic meridional overturning circulation and its control by
 wind stress forcing during glacial climate. Geophysical Research Letters, 39, L09709. https://doi.org/10.1029/2012GL051421
 Peterson, C., Lisiecki, L., & Stern, J. (2014). Deglacial whole-ocean 13 C change estimated from 480 benthic foraminiferal records.
 Paleoceanography, 29, 549–563. https://doi.org/10.1002/2013PA002552
 Roberts, N., Piotrowski, A., McManus, J., & Keigwin, L. (2010). Synchronous deglacial overturning and water mass source changes. Science,
 327, 75–78.
 Sherriff-Tadano, S., Abe-Ouchi, A., Yoshimori, M., Oka, A., & Chan, W. L. (2018). Influence of glacial ice sheets on the Atlantic meridional
 overturning circulation through surface wind change. Climate Dynamics, 50(7), 2881–2903. https://doi.org/10.1007/s00382-017-3780-0
 Skinner, L., Primeau, F., Freeman, E., de la Fuente, M., Goodwin, P., Gottschalk, J., et al. (2017). Radiocarbon constraints on the glacial
 ocean circulation and its impact on atmospheric CO2 . Nature Communications, 8, 16010. https://doi.org/10.1038/ncomms16010
 Tachikawa, K., Arsouze, T., Bayon, G., Bory, A., Colin, C., Dutay, J. C., et al. (2017). The large-scale evolution of neodymium isotopic
 composition in the global modern and Holocene ocean revealed from seawater and archive data. Chemical Geology, 457, 131–148. https://
 doi.org/10.1016/j.chemgeo.2017.03.018
 Tagliabue, A., Bopp, L., Roche, D., Bouttes, N., Dutay, J. C., Alkama, R., et al. (2009). Quantifying the roles of ocean circulation and
 biogeochemistry in governing ocean carbon-13 and atmospheric carbon dioxide at the Last Glacial Maximum. Climate of the Past, 5,
 695–706.
 Talley, L. D., Pickard, G. L., Emery, W. J., & Swift, J. H. (2011). Chapter S9—Atlantic Ocean: Supplementary materials, (6th ed.)., Descriptive
 physical oceanography (sixth edition) (pp. 1–43). Boston: Academic Press. https://doi.org/10.1016/B978-0-7506-4552-2.10021-6
 Tarasov, L., Dyke, A. S., Neal, R. M., & Peltier, W. R. (2012). A data-calibrated distribution of deglacial chronologies for the North American
 ice complex from glaciological modeling. Earth and Planetary Science Letters, 315–316, 30–40.
 Toggweiler, J., Russell, J., & Carson, S. (2006). Midlatitude westerlies, atmospheric CO2 , and climate change during ice ages.
 Paleoceanography, 21, PA2005. https://doi.org/10.1029/2005PA001154
 Weber, S., Drijfhout, S., Abe-Ouchi, A., Crucifix, M., Eby, M., Ganopolski, A., et al. (2007). The modern and glacial overturning circulation
 in the Atlantic ocean in PMIP coupled model simulations. Climate of the Past, 3, 51–64.
 Yang, D., Myers, P. G., & Bush, A. B. G. (2006). Sensitivity of the subpolar North Atlantic to Last Glacial Maximum surface forcing and sea
 ice distribution in an eddy-permitting regional ocean model. Paleoceanography, 21, PA2013. https://doi.org/10.1029/2005PA001209
 Yu, J., Elderfield, H., & Piotrowski, A. (2008). Seawater carbonate ion- 13 C systematics and application to glacial-interglacial North Atlantic
 ocean circulation. Earth and Planetary Science Letters, 271, 209–220.

MENVIEL ET AL. 12 of 12
You can also read