On C-Band Quad-Polarized Synthetic Aperture Radar Properties of Ocean Surface Currents - MDPI
←
→
Page content transcription
If your browser does not render page correctly, please read the page content below
remote sensing
Article
On C-Band Quad-Polarized Synthetic Aperture Radar
Properties of Ocean Surface Currents
Shengren Fan 1 , Vladimir Kudryavtsev 2,3 , Biao Zhang 1,4, * , William Perrie 5 ,
Bertrand Chapron 2,6 and Alexis Mouche 6
 1   School of Marine Sciences, Nanjing University of Information Science & Technology, Nanjing 210044, China;
     sr_fan@nuist.edu.cn
 2   Russian State Hydrometerorological University, St. Petersburg 195196, Russia; kudr@rshu.ru (V.K.);
     bertrand.chapron@ifremer.fr (B.C.)
 3   Marine Hydrophysical Institute, Sebastopol 299011, Russia
 4   Southern Marine Science and Engineering Guangdong Laboratory, Zhuhai 519082, China
 5   Bedford Institute of Oceanography, Fisheries and Oceans Canada, Dartmouth, NS B2Y 4A2, Canada;
     william.perrie@dfo-mpo.gc.ca
 6   Laboratoire d’Océanographie Physique Spatiale, Ifremer, Brest 29200, France; alexis.mouche@ifremer.fr
 *   Correspondence: zhangbiao@nuist.edu.cn; Tel.: +86-25-58695692

 Received: 1 September 2019; Accepted: 2 October 2019; Published: 5 October 2019

 Abstract: We present new results for ocean surface current signatures in dual co- and cross-polarized
 synthetic aperture radar (SAR) images. C-band RADARSAT-2 quad-polarized SAR ocean scenes
 are decomposed into resonant Bragg scattering from regular (non-breaking) surface waves and
 scattering from breaking waves. Surface current signatures in dual co- and cross-polarized SAR
 images are confirmed to be governed by the modulations due to wave breaking. Due to their small
 relaxation scale, short Bragg waves are almost insensitive to surface currents. Remarkably, the
 contrast in sensitivity of the non-polarized contribution to dual co-polarized signals is found to largely
 exceed, by a factor of about 3, the contrast in sensitivity of the corresponding cross-polarized signals.
 A possible reason for this result is the co- and cross-polarized distinct scattering mechanisms from
 breaking waves: for the former, quasi-specular radar returns are dominant, whereas for the latter,
 quasi-resonant scattering from the rough breaking crests governs the backscatter intensity. Thus,
 the differing sensitivity can be related to distinct spectral intervals of breaking waves contributing
 to co- and cross-polarized scattering in the presence of surface currents. Accordingly, routinely
 observed current signatures in quad-polarized SAR images essentially originate from wave breaking
 modulations, and polarized contrasts can therefore help quantitatively retrieve the strength of surface
 current gradients.

 Keywords: quad-polarized SAR; ocean surface current; polarization decomposition; Bragg scattering;
 breaking waves

1. Introduction
     With the advent of new spaceborne synthetic aperture radar (SAR) systems, more detailed
information on the ocean surface signatures of high-resolution ocean–atmosphere processes is becoming
available. Due to their high spatial resolution, wide swath acquisitions, and their capability to operate
at day and night over the global ocean, C-band spaceborne SAR microwave sensors can often capture
spectacular manifestations of mesoscale and submesoscale ocean surface signatures. Surface floating
buoys (drifters) and shipborne marine radar can measure near-surface currents [1,2], with the former
only able to measure current velocities at depths of about 15 m, and the latter is limited by the detection

Remote Sens. 2019, 11, 2321; doi:10.3390/rs11192321                        www.mdpi.com/journal/remotesensing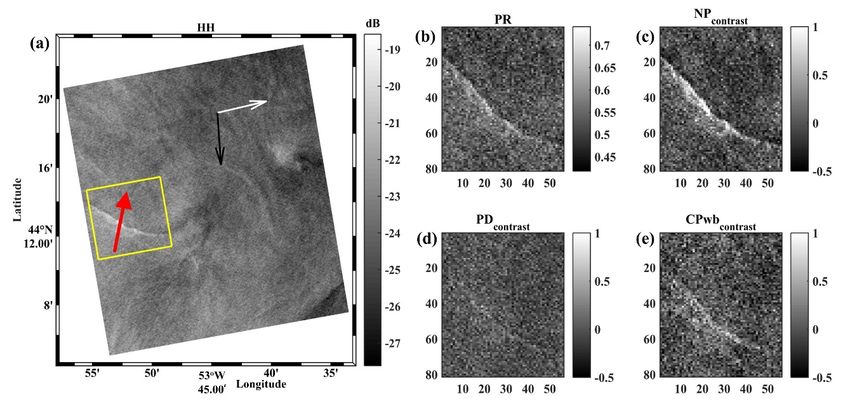
Remote Sens. 2019, 11, 2321                                                                         2 of 17

range, which is rather short, about 4 km. Though high-frequency (HF) radar is capable of remotely
sensing the ocean surface current field, with large coverage, the retrieval process is complicated because
the currents contain contributions from the wave-induced Stokes drift [3,4]. In any case, it has been
demonstrated that single- and dual-antenna SARs have the capability to measure line-of-sight or vector
currents [5–8]. Since the RADARSAT-2 (RS-2) launch in 2007, more than a decade of quad-polarized
SAR images are readily available. This helps to advance the interpretation and quantification of various
ocean surface phenomena (e.g., currents, sea surface thermal fronts, and oceanic internal waves) as
well as to better understand the microwave scattering from the ocean surface.
     Compared to optical observations [9,10], the diversity of radar polarization observations can
provide further help to better isolate the measured roughness variations between the changes of
polarized resonant Bragg scatters and non-polarized scatters associated with breaking waves. Previous
studies have revealed that a ‘conventional’ simple model based on Bragg scattering dramatically
underestimates the observed radar signatures of ocean currents [11]. The reason is that the relaxation
rate of short Bragg waves is very fast and these waves are therefore not modulated by typical
current gradients, which have a width of the order of 1 km. Radar imaging models have been
improved following the integral equation method [12] and the composite surface Bragg theory [13,14].
By inclusion of intermediate scale waves carrying the shorter Bragg waves, the gap between simulated
and observed radar backscatter anomalies has been reduced, but still the discrepancy exists [15,16].
     Previous investigation suggested that the effect of wave breaking on radar scattering might
provide the explanation for this discrepancy, between simulated and observed radar signatures of
ocean currents [17]. In particular, wave–current interactions amplify wave breaking dissipation which
in turn results in an enhancement of shorter gravity waves, including Bragg waves [18]. Accordingly,
wave breaking effects [19] should be taken into account when simulating radar returns in areas of
strong currents [20,21]. Wave breaking statistics can be based on the threshold level approach [22],
and the relaxation-type wave–current interactions model [23]. The crucial role of wave breaking in
radar imaging of ocean currents has been further demonstrated on the basis of previously developed
models [17]; as well as dual co- and cross-polarized SAR observations of meso-scale currents and
internal waves [9,10,24,25], nonlinear Ekman divergence [26] and sea surface temperature front
signatures [27].
     As already suggested [17,28] and tested [24,29,30] for particular case-studies, an effective
methodology can build on previous work that uses the dual co-polarization (VV and HH) radar data to
quantitatively assess contributions of Bragg and non-Bragg scattering (associated with wave breaking)
in SAR imaging of different ocean surface phenomena, such as surface slicks, current gradients,
and wind field features. Recently, using a large number of RS-2 quad-polarized SAR measurements,
the contribution of wave breaking to C-band dual co-polarized scattering has been quantified under
different incidence angles and wind conditions [31]. Results show that cross-polarized scattering from
breaking waves can reach 80% of the total normalized radar cross-section (NRCS) for wind speeds up
to 20 m/s, which suggests that wave breaking can play a crucial role in cross-polarized radar imaging
of the ocean current, like co-polarization.
     In this paper, we consider six particular cases of RS-2 quad-polarized SAR images to further
precisely identify whether the short Bragg waves, or the modulations of wave breaking, are the most
sensitive to the presence of ocean surface features (ocean currents, internal waves and fronts). Moreover,
we further explore and analyze the differing sensitivity between co- and cross-polarized signals to
breaking wave modulations. This paper is organized as follows. The description of the SAR data and
the radar imaging properties are presented in Section 2.1. In Section 2.2, the decomposition method is
introduced. In Section 3, we present the analyses of different ocean surface features, followed by a
corresponding discussion in Section 4. Conclusions are given in Section 5.
Remote Sens. 2019, 11, 2321                                                                           3 of 17

2. Data and Model Approach

2.1. Data
       In a recent study, the background properties, in particular, the dependence of wave breaking
 contributions in dual co- and cross-polarized SAR signals on incidence angle, azimuth and wind speed,
 have been reported [31]. In the present study, we investigate the quad-polarized SAR signatures of
 meso-scale ocean phenomena which have been visually detected in available RS-2 SAR scenes.
       In total, 71 SAR images contain distinct signatures of surface currents, natural slicks, ocean fronts
 and internal waves (IWs). Hereafter, we concentrate the analysis on six “typical” quad-polarized SAR
 images, acquired over the Aleutian Islands, on 13:53 UTC, 24 May 2012 (see Figure 1), on 14:35 UTC,
15 August 2009 (see Figure 3) on 22:07 UTC, 18 March 2009 (see Figure 5), on 21:30 UTC, 26 April
 2009 (see Figure 7), on 01:57 UTC, 9 August 2009 (see Figure 9), and on 18:20 UTC, 14 September, 2009
(see Figure 11). These SAR scenes provide quite generic environmental conditions to analyze and
 discuss the main mechanisms responsible for the manifestation of ocean and atmospheric processes,
 as detected at the ocean surface. The RS-2 fine quad-polarization imaging mode provides SAR images
 in HH- (σhh0
              ), VV- (σvv
                       0
                          ) and cross-polarized (CP) polarizations, defined as CP = (σvh
                                                                                      0
                                                                                         + σhv
                                                                                            0
                                                                                               )/2. For these
 six cases, the HH polarization scenes are shown in Figures 1a, 3a, 5a, 7a, 9a and 11a. It should be noted
 that the noise-equivalent sigma-zero (NESZ) is very low for the quad-polarization imaging mode with
 approximate values of −36.5 ± 3 dB [32]. The NESZ has been subtracted from co- and cross-polarized
 NRCS before the polarimetric analysis.
       In Figure 1, periodic bright/dark signatures are well expressed in HH and PR = σhh     0
                                                                                                /σvv
                                                                                                   0
                                                                                                     images.
This case, which is only VV, has previously been considered [33] in the context of developing an
 improved C-band SAR GMF for ocean surface wind speed retrieval. It was reported that the observed
periodic features are caused by near-surface wind oscillations induced by atmospheric gravity waves.
 Figure 3a,b depicts SAR signatures of IWs: periodic dark and bright oscillatory patterns are related
 to the typical manifestations of IWs trains. The other linear feature is considered to be a solitary IW.
The unique step-like change of the HH-signal, displaying a bright linear feature around the front
 in Figure 5a,b, is presumably associated with the modulation of the near-surface winds over the
 SST front and convergence of the current around the frontal line. Figures 7a, 9a and 11a, and the
‘number 2’ feature in Figure 3a exhibit very different bright linear signatures which are quite visible in
 HH-polarized images, and in processed PR images, which can be further interpreted as manifestations
 of the surface current boundaries.

2.2. Model Approach
     To interpret these observed high-resolution SAR features, we follow the approach suggested
in [29] and further extended to CP in [24,30,31]. Following this approach, VV and HH normalized
radar cross sections (NRCSs) can be separated into two parts, associated with the polarized resonant
                   pp
Bragg scattering σOB and the non-polarized (NP) radar returns from breaking waves σwb :

                                               pp     pp
                                              σ0 = σ0B + σwb                                             (1)

    Equation (1) is then solved to derive the NP contribution, σwb , from the dual co-polarized NRCS
measurements:
                                      σwb = σvv
                                              0 − ∆σ0 / (1 − pB )                                 (2)

where ∆σ0 = σvv0
                 − σhh
                    0
                       is the polarization difference (PD), and pB is the estimated polarization ratio
(PR) based on the two-scale Bragg scattering model (TSM) (see Figure 1a in [31]).
     CP NRCS can also be decomposed into two parts,

                                              σvh   vh    vh
                                               0 = σ0B + σwb                                             (3)
Remote Sens. 2019, 11, 2321                                                                                                    4 of 17

where σvh
       0B
          is estimated Bragg scattering for CP from TSM, and σvh
                                                              wb
                                                                 corresponds to the contribution of
wave breaking to CP, defined as [31]:

                                                       σvh
                                                        wb
                                                           = σvh
                                                              0 − rB ∆σ0                                                           (4)

where rB is the TSM estimate for CP-over-PD ratio: rB = σvh    0B
                                                                  /∆σ0 (see Figure 3a in [31]). Hereafter
the contribution of wave breaking to CP, (4), is denoted CPwb. Detailed description of the relative
contribution of wave breaking to dual co- and cross-polarized NRCS can be found in [31].
      Following Equations (1) and (3), the original dual co- and cross-polarized images are thus
transformed into new images which possess information on very different radar scattering mechanisms:
Bragg scattering (associated with PD) provided by the fast-response of short wind waves, and the
contributions of wave breaking to dual co- and cross-polarized NRCS, as defined by Equations (2) and
(4), respectively. Anticipating the different sensitivities of short wind waves and wave breaking to
various ocean phenomena, this set of new images can then serve as an effective way to interpret the
original SAR data. The definition of the key parameters used in this paper are shown in Table 1.

                                         Table 1. Definition of the key parameters.

                                                  PR                   σhh
                                                                        0
                                                                           /σvv
                                                                             0
                                                  PD                  σvv
                                                                       0
                                                                          − σhh
                                                                             0
                                                  NP            σvv
                                                                 0
                                                                    − ∆σ0 /(1 − pB )
                                                  CP               (σvh
                                                                     0
                                                                        + σhv
                                                                           0
                                                                              )/2
                                                CPwb                σvh
                                                                     0
                                                                        − rB ∆σ0
                                                                                      2
                                                                    |Ghh |2 1+ ghh ·si
                                                  pB                       ·
                                                                    |Gvv |2 1+ gvv ·s2i
                                                                   |Gvv −Ghh |2    s2n
                                                  rB
                                                                  |Gvv | −|Ghh | sin2 θ
                                                                        2       2

                                               contrast              ( y − y)/y
      Note: Ghh , Gvv , ghh , and gvv are scattering coefficients of TSM defined by Equations (A2) and (A3) in [31], s2i and s2n
      are the mean square slope (MSS) of tilting waves, in and out of the direction of the incidence plane.

     In the following Section, SAR observations of several different ocean surface features (e.g.,
atmospheric gravity waves, oceanic internal waves, sea surface temperature (SST) fronts, and ocean
currents) will be assessed. Specifically, we estimate different polarized images (PR, NP, PD, and CPwb)
and use them to identify these phenomena. They will be individually investigated beginning with
an atmospheric gravity wave, followed by by Figures 1 and 2; oceanic internal waves, followed by
Figures 3 and 4; SST fronts, followed by Figures 5 and 6; ocean currents, followed by Figures 7 and 8,
Figures 9 and 10, and Figures 11 and 12.

3. Scattering Signatures

3.1. Atmospheric Gravity Waves
     The case shown in Figure 1 provides quad-polarized SAR signatures of wind speed oscillations
induced by atmospheric gravity waves. This case had been used [33] to test the capability of a new
C_SARMOD2 GMF to retrieve wind speed variability from VV-polarized SAR data. In our present
case, the full set of quad-polarized SAR images, and their companions, PD, NP, CPwb, and PR =
HH/VV, are used. As obtained, the bright/dark features are quite visible in HH and PR: the larger the
wind speed, the larger is PR. Such behavior presumes that the wind sensitivity of NP (wave breaking)
is higher than the wind sensitivity of Bragg waves. This result can also be shown to occur using the
image contrast, k y = ( y − y)/y, defined as the deviation from the mean value scaled by the mean,
of NP, PD, CPwb. As obtained, the intensities of NP- and CPwb contrast are much higher than the
intensities of the PD contrast.
very similar. The wind sensitivity to the wave breaking contribution to co- and cross-polarized
  signals is thus similar, confirming previously reported results ([31], their Figure 4). As shown in
  Figure 2b,c, the scale of NP contrast is about twice that of PD contrast. NP (wave breaking) is thus
  more
Remote    sensitive
       Sens. 2019, 11,to wind speed variations than PD (short-scale Bragg waves), which is also consistent
                       2321                                                                            5 of 17
  with previously reported results ([24], compare their Figure 5b and Figure 12b).

   Remote Sens. 2019                                                                                                     5 of 18

   very similar. The wind sensitivity to the wave breaking contribution to co- and cross-polarized
   signals is thus similar, confirming previously reported results ([31], their Figure 4). As shown in
   Figure 2b,c, the scale of NP contrast is about twice that of PD contrast. NP (wave breaking) is thus
   more sensitive to wind speed variations than PD (short-scale Bragg waves), which is also consistent
   with previously reported results ([24], compare their Figure 5b and Figure 12b).

      Figure 1. Synthetic aperture radar (SAR) images containing atmospheric gravity waves: (a) RS-2 SAR
         Figure 1. Synthetic aperture radar (SAR) images containing atmospheric gravity waves: (a) RS-2 SAR
      HH-polarized images (dB units) of an area of the West Coast of USA acquired at 13:53 UTC on May 24,
         HH-polarized images (dB units) of an area of the West Coast of USA acquired at 13:53 UTC on May
      2012.
         24, The
             2012.key
                   Theparameters    associated
                         key parameters         with the
                                           associated    enlarged
                                                       with         region region
                                                             the enlarged   of the yellow   fragment
                                                                                     of the yellow       in (a) are
                                                                                                      fragment    inestimated
                                                                                                                     (a) are
      as:estimated
          (b) polarization   ratio (PR) (linear units); (c) non-polarized    (NP)   contrast;  (d)  polarization    difference
                    as: (b) polarization ratio (PR) (linear units); (c) non-polarized (NP) contrast; (d) polarization
      (PD)  contrast,
         difference    andcontrast,
                     (PD)   (e) cross-polarized   wave breaking
                                     and (e) cross-polarized  wave(CPwb)
                                                                     breakingcontrast.    The incidence
                                                                                (CPwb) contrast.            angle, averaged
                                                                                                    The incidence     angle,
      wind
         averaged wind speed and the angle between radar look direction and wind direction are about1144m/s
             speed  and  the angle  between   radar look  direction  and  wind    direction  are  about   44 degrees,
      and  59 degrees,
         degrees,  11 m/srespectively. The black
                           and 59 degrees,         and white
                                             respectively.  Thearrows   in (a)
                                                                 black and     correspond
                                                                             white  arrows into wind    direction to
                                                                                                 (a) correspond     and  radar
                                                                                                                       wind
      look  direction.  Wind   direction is from  the  NDBC    buoy,  wind   speed   from  the  C_SARMOD2
         direction and radar look direction. Wind direction is from the NDBC buoy, wind speed from the             GMF.   RS-2
      data  are a product   of MacDonald,     Dettwiler,  and  Associates,   Ltd.  All  rights  reserved.
         C_SARMOD2 GMF. RS-2 data are a product of MacDonald, Dettwiler, and Associates, Ltd. All rights
         reserved.
        Figure 1.of
     Transects    Synthetic
                    PR, NPaperture
                             contrast,radar
                                         PD(SAR)    images
                                              contrast,     containing
                                                          and            atmospheric
                                                               CPwb contrast,         gravity
                                                                                   along  thewaves:   (a) RS-2
                                                                                               red arrow     in SAR
                                                                                                                the yellow
        HH-polarized images (dB units) of an area of the West Coast of USA acquired at 13:53 UTC on May
fragment shown in Figure 2a–d correspondingly, further clearly indicate that the wind sensitivity of
        24, 2012. The key parameters associated with the enlarged region of the yellow fragment in (a) are
the NRCS components supported by wave breaking is indeed stronger than that of PD associated with
        estimated as: (b) polarization ratio (PR) (linear units); (c) non-polarized (NP) contrast; (d) polarization
Bragg scattering. Note that Figure 2b,d show that the transects of NP and CPwb contrasts are very
        difference (PD) contrast, and (e) cross-polarized wave breaking (CPwb) contrast. The incidence angle,
similar.averaged
         The wind    sensitivity
                  wind   speed andtothethe  wave
                                         angle     breaking
                                                between   radarcontribution
                                                                 look directionto  co-wind
                                                                                 and   anddirection
                                                                                            cross-polarized
                                                                                                      are about signals
                                                                                                                  44       is
thus similar,  confirming   previously     reported   results  ([31],  their Figure  4). As  shown    in
        degrees, 11 m/s and 59 degrees, respectively. The black and white arrows in (a) correspond to windFigure   2b,c, the
scale ofdirection
         NP contrast    is about
                  and radar   looktwice    thatWind
                                    direction.  of PDdirection
                                                        contrast.    NP (wave
                                                                 is from  the NDBCbreaking)   is thus
                                                                                      buoy, wind       more
                                                                                                   speed   fromsensitive
                                                                                                                 the      to
wind speed    variations
        C_SARMOD2      GMF.than
                              RS-2PD
                                   data(short-scale
                                         are a productBragg    waves),Dettwiler,
                                                        of MacDonald,     which isandalso consistent
                                                                                         Associates, Ltd.with   previously
                                                                                                          All rights
reported  results ([24], compare their Figure 5b and Figure 12b).
        reserved.

         Figure 2. Transects across the atmospheric gravity waves along the red arrow shown in Figure 1a: (a)
         PR, (b) NP contrast, (c) PD contrast, (d) CPwb contrast.

      Figure      Transects
               2. 2.
          Figure     Transectsacross
                               acrossthe
                                       the atmospheric   gravitywaves
                                           atmospheric gravity   waves  along
                                                                      along thethe
                                                                                redred arrow
                                                                                    arrow    shown
                                                                                          shown      in Figure
                                                                                                in Figure 1a: (a)1a:
      (a) PR,
          PR, (b)
               (b)NP
                   NPcontrast,
                       contrast,(c)
                                  (c)PD
                                      PDcontrast,
                                          contrast, (d) CPwb  contrast.
                                                  (d) CPwb contrast.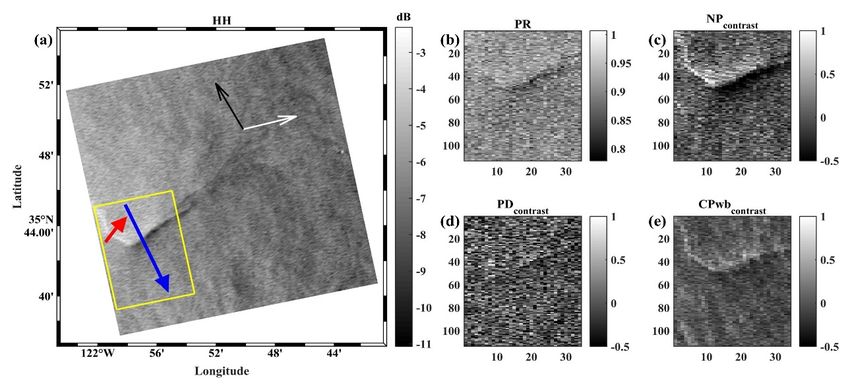
Remote
Remote Sens.Sens.
2019,2019
11, 2321 6 of617of 18
3.2. Oceanic Internal Waves
3.2. Oceanic Internal Waves
The manifestation of oceanic IWs in SAR images is shown in Figure 3. Firstly, the train of short-
The manifestation
period IWs is easily of oceanic IWs
recognized, in SAR
in the first images is shown of
yellow fragment in plot
Figure(a) 3. Firstly,bythe
(marked train of #1).
fragment
short-period
Another IWs is easily
second recognized,
feature, which inmay the first yellow fragment
be treated as SAR ofsignatures
plot (a) (marked by fragment
of solitary #1). a
IWs, with
Another second feature,
corresponding which
bright may
linear be treated
feature, as SAR
spreads signatures
from top to of solitary
bottom ofIWs,
the with
HH aimage
corresponding
(marked by
bright linear feature,
fragment spreads
#2). Enlarged from top of
fragments to IWs
bottom of the HH image
manifestations in PR-,(marked by fragment
NP-, PD-, #2). Enlarged of
and CPwb-components
fragments of IWs manifestations
quad-polarized SAR images are in shown
PR-, NP-, PD-,(3b)
in plots andto CPwb-components
(3e) (for IWs train)of andquad-polarized
in plots (3f) toSAR
(3i) (for
images are shown
the solitary IW).in Firstly,
plots (3b)
wetonotice
(3e) (for
thatIWs train) and in
modulations areplots
well(3f) to (3i) (for
expressed in the
PR,solitary
for eitherIW).
or Firstly,
both type
we notice
of IWs. that modulations
This are well
again indicates expressed
that in PR, for
modulations either
of NP or both typeexceed
components of IWs.the This again indicates
modulations due to
thatBragg
modulations of NP components exceed the modulations due to Bragg scattering.
scattering. This observation is verified by considering the modulations of NP- and PD-signals, This observation
is verified by considering
e.g. compare plots (3c)the
andmodulations of NP-
(3d) for IW train and
and PD-signals,
plots (3g) and e.g.
(3h)compare plots (3c)
for the solitary IW.and
For (3d)
bothfor
cases,
IW train and plots (3g)of
the modulations and (3h)
the PDforsignal
the solitary IW. detectable
are not For both cases, the modulations
whereas of the PD
NP modulations signal
are quitearewell
not expressed.
detectable whereas
Secondly, NPsimilar
modulations
to NP, are quite well of
modulations expressed. Secondly,are
the CPwb-signal similar to NP, modulations
also visually detectable, but
of the
lessCPwb-signal
pronounced.are also visually detectable, but less pronounced.
Figure 3. SAR images containing a oceanic internal solitary wave (IW) and a train of IWs: (a) RS-2
Figure 3. SAR images containing a oceanic internal solitary wave (IW) and a train of IWs: (a) RS-2
SAR HH-polarized images (dB units) of an area of the West Coast of USA acquired at 14:35 UTC on
SAR HH-polarized images (dB units) of an area of the West Coast of USA acquired at 14:35 UTC on
August 15, 2009. The key parameters associated with the enlarged region of the yellow fragment in
August 15, 2009. The key parameters associated with the enlarged region of the yellow fragment in
(a) are estimated as: (b,f) PR (linear units); (c,g) NP contrast; (d,h) PD contrast; (e,f) CPwb contrast.
(a) are estimated as: (b) and (f) PR (linear units); (c) and (g) NP contrast; (d) and (h) PD contrast; (e)
The incidence angle, averaged wind speed and the angle between radar look direction and wind
and (f) CPwb contrast. The incidence angle, averaged wind speed and the angle between radar look
direction are about 29 degrees, 6 m/s and 39 degrees, respectively. RS-2 data are a product of MacDonald,
direction and wind direction are about 29 degrees, 6 m/s and 39 degrees, respectively. RS-2 data are
Dettwiler, and Associates, Ltd. All rights reserved.
a product of MacDonald, Dettwiler, and Associates, Ltd. All rights reserved.
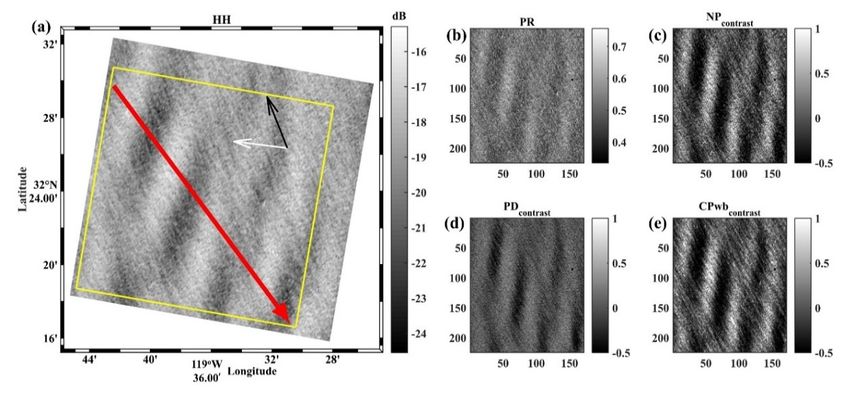
Transects over the IW train and the solitary IW (red and blue arrows) are shown in Figure 4a,d,e,h,
Transects over the IW train and the solitary IW (red and blue arrows) are shown in Figure
correspondingly. As already noticed, for both cases, the strongest modulations are observed in the NP
4a,d,e,h, correspondingly. As already noticed, for both cases, the strongest modulations are observed
signal, whereas modulations in CPwb are also observed but are not prominent, and modulations of the
in the NP signal, whereas modulations in CPwb are also observed but are not prominent, and
PD signal associated with Bragg scattering modulations are negligible, and thus not detectable by a
modulations of the PD signal associated with Bragg scattering modulations are negligible, and thus
C-band SAR.
not detectable by a C-band SAR.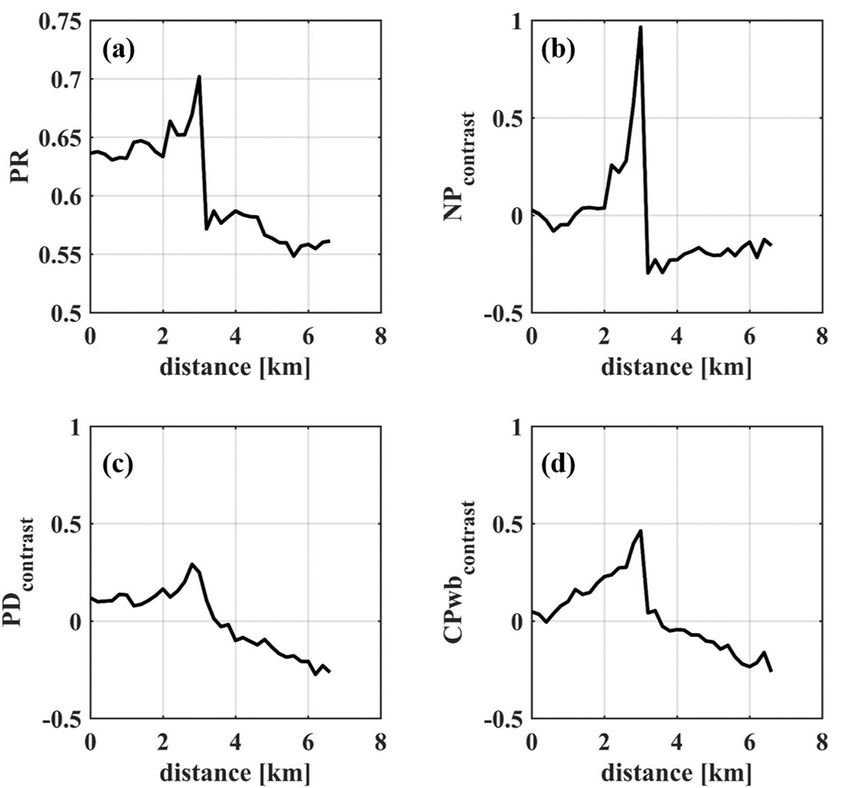
Remote Sens. 2019 7 of 18
Remote Sens.
Remote 2019,
Sens. 11, 2321
2019 7 of7 17
of 18
Figure 4. Transects across the IW train along the red arrow shown in Figure 3a: (a) PR, (b) NP contrast,
Figure 4. Transects across the IW train along the red arrow shown in Figure 3a: (a) PR, (b) NP contrast,
(c) PD contrast, (d) CPwb contrast. Transects across the solitary IW along the blue arrow shown in
(c) PD contrast,
Figure (d) CPwb
4. Transects contrast.
across Transects
the IW train alongacross
the redthe solitary
arrow IWin
shown along the3a:
Figure blue arrow
(a) PR, (b) shown in
NP contrast,
Figure 3a: (e) PR, (f) NP contrast, (g) PD contrast, (h) CPwb contrast.
Figure 3a: contrast,
(c) PD (e) PR, (f)(d)
NPCPwb
contrast, (g) PDTransects
contrast. contrast, across
(h) CPwb
the contrast.
solitary IW along the blue arrow shown in
Figure 3a: (e) PR, (f) NP contrast, (g) PD contrast, (h) CPwb contrast.
3.3.
3.3. SST
SST Fronts
Fronts
3.3. Figure
SST
Figure 5 presumably
Fronts
5 presumably provides
provides the manifestation
the manifestation of an oceanic
of an oceanic temperature
temperature front. A change
front. A step-like step-like
of change of HH
HH signal signal
in the in the
direction ofdirection
the yellow offragment
the yellow fragment
is likely causedis likely
by thecaused
effect ofbythe
the effect of the
atmospheric
Figure 5 presumably provides the manifestation of an oceanic temperature front. A step-like
atmospheric
boundary layer boundary layerover
transformation transformation overfront.
the temperature the temperature
As known and front.
oftenAs known[17,34,35],
reported and often
change of HH signal in the direction of the yellow fragment is likely caused by the effect of the
reported [17,34,35], the spatial variations of the SST alter stratification of the marine
the spatial variations of the SST alter stratification of the marine atmospheric boundary layer (MABL) atmospheric
atmospheric boundary layer transformation over the temperature front. As known and often
andboundary layer (MABL)
subsequently the surfaceandwind
subsequently the surface
stress. In our case, windwind stress.
stress andInthe
ournear-surface
case, wind wind
stress speed
and the
reported [17,34,35], the spatial variations of the SST alter stratification of the marine atmospheric
near-surface
(and windNRCS)
consequently speed over
(and the
consequently
cold side of NRCS) overdecrease
the front the cold relative
side of the front
to the winddecrease
speedrelative
over
boundary layer (MABL) and subsequently the surface wind stress. In our case, wind stress and the
the warm side. This wind field feature leads to coherent step-like changes of the PR, NP- , PD- and of
to the wind speed over the warm side. This wind field feature leads to coherent step-like changes
near-surface wind speed (and consequently NRCS) over the cold side of the front decrease relative
the PR, NP- , over
CPwb-contrast PD- and CPwb-contrast
the front, over thein
as well expressed front,
Figureas well
5. expressed in Figure 5.
to the wind speed over the warm side. This wind field feature leads to coherent step-like changes of
the PR, NP- , PD- and CPwb-contrast over the front, as well expressed in Figure 5.
Figure
Figure SAR
5. 5. SAR images
imagescontaining
containing seasea
surface temperature
surface temperature (SST)
(SST)front: (a)(a)
front: RS-2
RS-2SARSARHH-polarized
HH-polarized
images (dB units) of an area of the East Coast of USA acquired at 22:07 UTC
images (dB units) of an area of the East Coast of USA acquired at 22:07 UTC on March on March 18, 2009.
18, The key
2009. The
Figure
parameters 5. SAR images
associated containing
with the enlargedsea surface temperature
regionregion
of the yellow (SST)
fragment front: (a)
in (a) areRS-2 SAR
estimated HH-polarized
as: (b)as:
PR(b)
key parameters associated with the enlarged of the yellow fragment in (a) are estimated
images
(linear (dB(c)
units); units) of an area
NP contrast; (d)ofPD
thecontrast,
East Coast of(e)
USA acquired at 22:07 UTC on March 18, 2009. The
PR (linear units); (c) NP contrast; (d) PD and
contrast, CPwb
and contrast.
(e) CPwbThe incidence
contrast. Theangle, averaged
incidence angle,
windkey parameters
speed and the associated
angle with
between the
radarenlarged
look region
direction of
andthe yellow
wind fragment
direction are in (a)
about are
33 estimated
degrees, 4 as: (b)
m/s
averaged wind speed and the angle between radar look direction and wind direction are about 33
PR (linear units); (c) NP contrast; (d) PD contrast, and (e) CPwb contrast.
and 112 degrees, respectively. RS-2 data are a product of MacDonald, Dettwiler, and Associates, Ltd. The incidence angle,
All averaged wind speed and the angle between radar look direction and wind direction are about 33
rights reserved.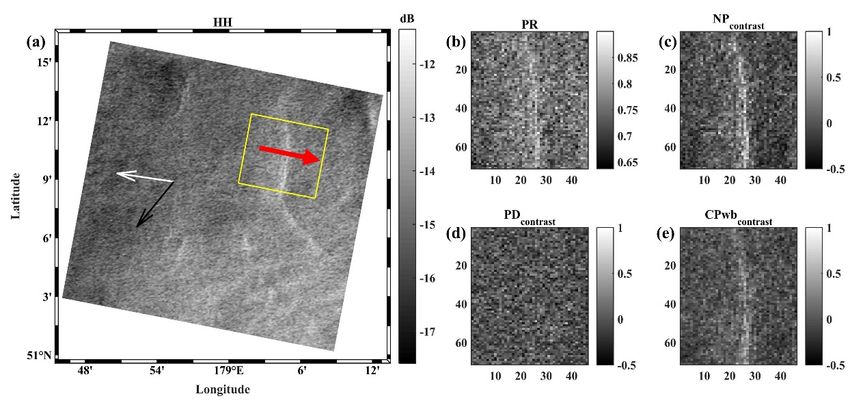
Remote Sens. 2019                                                                                                  8 of 18

       degrees, 4 m/s and 112 degrees, respectively. RS-2 data are a product of MacDonald, Dettwiler, and
Remote Sens. 2019, 11, 2321                                                                             8 of 17
       Associates, Ltd. All rights reserved.

      There is also a noticeable bright line in the PR image that follows the SST frontal line. A possible
     There is also a noticeable bright line in the PR image that follows the SST frontal line. A possible
 origin of this bright PR feature can be interpreted as a result of the local enhancement of wave
origin of this bright PR feature can be interpreted as a result of the local enhancement of wave breaking
 breaking and consequently NP radar component (Figure 5c). This area of enhanced wave breaking
and consequently NP radar component (Figure 5c). This area of enhanced wave breaking traces the
 traces the surface current convergence at the edge of the SST front [10,24]. Surprisingly, modulations
surface current convergence at the edge of the SST front [10,24]. Surprisingly, modulations of CPwb
 of CPwb around the front are much weaker than NP, though both signatures originate from the same
around the front are much weaker than NP, though both signatures originate from the same surface
 surface phenomenon—local wave breaking enhancement. Finally, modulations of PD around the
phenomenon—local wave breaking enhancement. Finally, modulations of PD around the front are
 front are weak and almost negligible.
weak and almost negligible.
      Figure 6b–d display the transects of NP, PD and CPwb contrasts along the red arrow in Figure
     Figure 6b–d display the transects of NP, PD and CPwb contrasts along the red arrow in Figure 5a.
 5a. Each of the transects exhibits step-like changes related to the near-surface wind speed change over
Each of the transects exhibits step-like changes related to the near-surface wind speed change over the
 the SST front. In addition, as mentioned above, NP exhibits a strong peak value around the front,
SST front. In addition, as mentioned above, NP exhibits a strong peak value around the front, whereas
 whereas in the CP signal, this is less pronounced, and almost negligible in PD signal. Therefore, we
in the CP signal, this is less pronounced, and almost negligible in PD signal. Therefore, we conclude
 conclude that the modulation of the wave breaking by the surface currents dominates the co-
that the modulation of the wave breaking by the surface currents dominates the co-polarized SAR
 polarized SAR image contrasts, and the effect of Bragg resonant scattering on SAR image contrasts is
image contrasts, and the effect of Bragg resonant scattering on SAR image contrasts is negligible.
 negligible.

      Figure 6. Transects across the SST front along the red arrow shown in Figure 5: (a) PR, (b) NP contrast,
       Figure 6. Transects across the SST front along the red arrow shown in Figure 5: (a) PR, (b) NP contrast,
      (c) PD contrast, (d) CPwb contrast.
       (c) PD contrast, (d) CPwb contrast.
3.4. Ocean Currents
 3.4. Ocean Currents
      Figure 7 illustrates specific features of a surface current. Again, bright linear features, well
       Figure
delineated   in 7the
                   illustrates
                      HH image,   specific  features
                                     trace the  oceanof   a surface
                                                       surface         current.
                                                                  current         Again,
                                                                           boundary        bright
                                                                                       (front).    linear features,
                                                                                                Enlarged    fragmentswellof
 delineated
this           in the
     typical SAR       HH image,
                     signature        trace the
                                  are shown   in ocean   surface
                                                  plots (7b)       current
                                                              to (7e)       boundary
                                                                      to reveal         (front). Enlarged
                                                                                 the following:  the current fragments
                                                                                                                boundary  of
 this typical  SAR    signature    are  shown   in plots (7b)  to (7e) to reveal  the following:
is well expressed in PR, plot (7b), suggesting that modulation of wave breaking (NP-signal) shouldthe  current   boundary
 is well
again  beexpressed
          much stronger in PR,than
                                plot modulations
                                       (7b), suggesting    that modulation
                                                      associated                of wave
                                                                    with resonant         breaking
                                                                                      Bragg  waves;(NP-signal)       should
                                                                                                       this is confirmed
 again
with    be much
      plots (7c) and stronger    than modulations
                         (7d) illustrating             associated with
                                             strong modulations       of NP resonant   Bragg waves;
                                                                              and negligible            this is of
                                                                                                modulations     confirmed
                                                                                                                   the PD,
correspondingly; breaking wave modulations lead to measurable but smaller (as compare of
 with  plots  (7c)  and   (7d) illustrating   strong  modulations      of NP   and  negligible  modulations         theNP)
                                                                                                                 with   PD,
 correspondingly;       breaking    wave
modulations in the CP signal, plot (7e).   modulations      lead  to measurable     but smaller  (as  compare     with  NP)
 modulations      in theobservations
      These overall       CP signal, plot are(7e).
                                              confirmed by the transects shown in Figure 8. Well expressed
peaks in PR and NP contrasts, around the current boundary, confirm the strong modulations of wave
Remote Sens. 2019 9 of 18
These overall observations are confirmed by the transects shown in Figure 8. Well expressed
Remote Sens. 2019, 11, 2321 9 of 17
peaks in PR and NP contrasts, around the current boundary, confirm the strong modulations of wave
breaking. Similar to the previous case, CPwb exhibits clear modulation, but this is not so well
expressedSimilar
breaking. when tocompared to NP-signal.
the previous case, CPwbSimilar
exhibitstoclear
the previous cases,
modulation, but the
this transect of PD
is not so well contrast
expressed
does not
when correlatetowith
compared either NP
NP-signal. or CPwb,
Similar confirming
to the previousthe absence
cases, of current
the transect ofimpacts on short
PD contrast Bragg
does not
waves.
correlate with either NP or CPwb, confirming the absence of current impacts on short Bragg waves.
Figure 7. SAR images containing ocean current feature: (a) RS-2 SAR HH-polarized images (dB units)
Figure 7. SAR images containing ocean current feature: (a) RS-2 SAR HH-polarized images (dB units)
of an area of the East Coast of USA acquired at 21:30 UTC on April 26, 2009. The key parameters
of an area of the East Coast of USA acquired at 21:30 UTC on April 26, 2009. The key parameters
associated with the enlarged region of the yellow fragment in (a) are estimated as: (b) PR (linear units);
associated with the enlarged region of the yellow fragment in (a) are estimated as: (b) PR (linear units);
(c) NP contrast; (d) PD contrast, and (e) CPwb contrast. The incidence angle, averaged wind speed and
(c) NP contrast; (d) PD contrast, and (e) CPwb contrast. The incidence angle, averaged wind speed
the angle between radar look direction and wind direction is about 39 degrees, 6 m/s and 96 degrees,
Remoteand
Sens.the
2019
angle between radar look direction and wind direction is about 39 degrees, 6 m/s and 96 10 of 18
respectively. RS-2 data are a product of MacDonald, Dettwiler, and Associates, Ltd. All rights reserved.
degrees, respectively. RS-2 data are a product of MacDonald, Dettwiler, and Associates, Ltd. All rights
reserved.
Figure 8. Transects across the current along the red arrow shown in Figure 7: (a) PR, (b) NP contrast,
Figure
(c) 8. Transects
PD contrast, acrosscontrast.
(d) CPwb the current along the red arrow shown in Figure 7: (a) PR, (b) NP contrast,
(c) PD contrast, (d) CPwb contrast.
Comparable to the case shown in Figure 7, Figure 9 illustrates another SAR signature of a surface
current feature. Referring to Figure 9d, although this current feature is not visible in PD contrasts, it
is quite well expressed in variations of NP and CPwb contrasts, Figure 9c,e. Quad-polarized SAR
signatures of this current feature appear to systematically result from enhanced wave breaking,Remote Sens. 2019, 11, 2321 10 of 17
Figure 8. Transects across the current along the red arrow shown in Figure 7: (a) PR, (b) NP contrast,
(c) PD contrast, (d) CPwb contrast.
Comparable to the case shown in Figure 7, Figure 9 illustrates another SAR signature of a surface
Comparable
current to the casetoshown
feature. Referring Figurein9d,
Figure 7, Figure
although this9current
illustrates another
feature SAR
is not signature
visible ofcontrasts,
in PD a surface
current feature.
it is quite Referring toinFigure
well expressed 9d, although
variations of NP and thisCPwb
currentcontrasts,
feature isFigure
not visible
9c,e.inQuad-polarized
PD contrasts, it
is quite well expressed in variations of NP and CPwb contrasts, Figure 9c,e. Quad-polarized
SAR signatures of this current feature appear to systematically result from enhanced wave breaking, SAR
signatures of this current feature appear
significantly contributing to NP and CPwb results.to systematically result from enhanced wave breaking,
significantly contributing to NP and CPwb results.
Figure 9. SAR images containing ocean current feature: (a) RS-2 SAR HH-polarized images (dB units)
Figure 9. SAR images containing ocean current feature: (a) RS-2 SAR HH-polarized images (dB units)
of an area of the West Coast of USA acquired at 01:57 UTC on August 9, 2009. The key parameters
of an area of the West Coast of USA acquired at 01:57 UTC on August 9, 2009. The key parameters
associated with the enlarged region of the yellow fragment in (a) are estimated as: (b) PR (linear units);
associated with the enlarged region of the yellow fragment in (a) are estimated as: (b) PR (linear units);
(c) NP contrast; (d) PD contrast, and (e) CPwb contrast. The incidence angle, averaged wind speed and
(c) NP contrast; (d) PD contrast, and (e) CPwb contrast. The incidence angle, averaged wind speed
the angle between radar look direction and wind direction are about 23 degrees, 12 m/s and 108 degrees,
and the angle between radar look direction and wind direction are about 23 degrees, 12 m/s and 108
respectively.
Remote Sens. 2019 RS-2 data are a product of MacDonald, Dettwiler, and Associates, Ltd. All rights reserved.
11 of 18
degrees, respectively. RS-2 data are a product of MacDonald, Dettwiler, and Associates, Ltd. All rights
reserved.
Transects shown in Figure 10 illustrate the profiles of PR, PD contrast, NP and CPwb contrasts
Transects shown in Figure 10 illustrate the profiles of PR, PD contrast, NP and CPwb contrasts
along red and blue arrows in Figure 9a. The left two columns of transects in Figure 10 refer to the red
along red and blue arrows in Figure 9a. The left two columns of transects in Figure 10 refer to the red
arrow shown in Figure 9a, and the right two columns refer to the blue arrow. Along the two directions,
arrow shown in Figure 9a, and the right two columns refer to the blue arrow. Along the two
distinct peaks of NP and CPwb contrasts are observed around the current boundary. PD variations
directions, distinct peaks of NP and CPwb contrasts are observed around the current boundary. PD
are absent.
variations are absent.
Figure
Figure10.10.Transects
Transectsacross
acrossthe
thecurrent
currentalong
alongthe
thered
redarrow
arrowshown
shownin inFigure
Figure9:9:(a)
(a)PR,
PR,(b)
(b)NP
NPcontrast,
contrast,
(c)
(c)PD
PDcontrast,
contrast,(d)
(d)CPwb
CPwbcontrast.
contrast.Transects
Transectsacross
acrossthe current
the along
current thethe
along blue arrow
blue shown
arrow shownin Figure 9:
in Figure
(e) PR, (f) NP contrast, (g) PD contrast, (h) CPwb contrast.
9: (e) PR, (f) NP contrast, (g) PD contrast, (h) CPwb contrast.
Figure 11 further displays another case of the SAR signature of a current feature. Similar
conclusions can be drawn, with strong NP and CPwb image contrasts (Figure 11c,e). This result is
furthermore supported by the PR image (Figure 11b), with larger PR values around the current which
are well correlated with the enhanced NP component.Figure 10. Transects across the current along the red arrow shown in Figure 9: (a) PR, (b) NP contrast,
Remote(c) PD2019,
Sens. contrast, (d) CPwb contrast. Transects across the current along the blue arrow shown in Figure
11, 2321 11 of 17
9: (e) PR, (f) NP contrast, (g) PD contrast, (h) CPwb contrast.
Figure 11
Figure 11 further
further displays
displays another
another case
case of
of the
the SAR
SAR signature
signature of
of aa current
current feature.
feature. Similar
Similar
conclusions can be drawn, with strong NP and CPwb image contrasts (Figure 11c,e).
conclusions can be drawn, with strong NP and CPwb image contrasts (Figure 11c,e). This This result
result is
is
furthermore supported
furthermore supported byby the
the PR image (Figure
PR image (Figure 11b),
11b), with
with larger
larger PR
PR values
values around
around the
the current
current which
which
are well
are well correlated
correlated with
with the
the enhanced
enhanced NP
NP component.
component.
Figure 11. SAR images containing ocean current features: (a) RS-2 SAR HH-polarized images (dB units)
Figure 11. SAR images containing ocean current features: (a) RS-2 SAR HH-polarized images (dB
of an area of the Aleutian Islands acquired at 18:20 UTC on September 14, 2009. The key parameters
units) of an area of the Aleutian Islands acquired at 18:20 UTC on September 14, 2009. The key
associated with the enlarged region of the yellow fragment in (a) are estimated as: (b) PR (linear units);
parameters associated with the enlarged region of the yellow fragment in (a) are estimated as: (b) PR
(c) NP contrast; (d) PD contrast, and (e) CPwb contrast. The incidence angle, averaged wind speed and
(linear units);
the angle (c) NP
between contrast;
radar (d) PD contrast,
look direction and windand (e) CPwb
direction arecontrast.
about 34The incidence
degrees, angle,
10 m/s averaged
and 60 degree,
wind speed and the angle between radar look direction and wind direction are about 34 degrees,
respectively. RS-2 data are a product of MacDonald, Dettwiler, and Associates, Ltd. All rights reserved.10
m/s and 60 degree, respectively. RS-2 data are a product of MacDonald, Dettwiler, and Associates,
4. Discussion
Ltd. All rights reserved.
Observations and results are summarized in Table 2. Modulations of PD, NP and CPwb
signals caused by wind speed variability, due to either atmospheric gravity waves or atmospheric
boundary layer transformation over the SST front, demonstrate the expected behavior imposed by the
corresponding wind exponents reported in [31].
Table 2. Information on the SAR images and transects.
SAR Observation θ U10 Φ CPwb PD
Feature NP
R1 NP R2
Time (UTC) (deg) (m/s) (deg)
13:53, May 24, 2012 Atmospheric IWs 44 11 59 1.07 0.98 0.48 0.93
IW train 0.25 0.71 −0.05 −0.1
14:35, Aug 15, 2009 29 6 39
solitary IW 0.35 0.96 0.06 0.19
22:07, Mar 18, 2009 SST front 33 4 112 0.39 0.95 0.33 0.92
21:30, Apr 26, 2009 current 39 6 96 0.36 0.79 0.17 0.69
current (red) 0.54 0.97 0.02 0.07
01:57, Aug 9, 2009 23 12 108
current (blue) 0.42 0.92 0.02 0.07
18:20, Sept 14, 2009 current 34 10 60 0.55 0.85 −0.02 −0.07
Note: Φ is radar look direction relative to the wind direction, R1 and R2 are correlation coefficients between CPwb
and NP, and PD and NP, respectively. θ, U10 , and φ are radar incidence angle, wind speed at 10-m height and the
angle between radar look direction and wind direction.Remote Sens. 2019, 11, 2321 12 of 17
However, signatures of the ocean currents in the quad-polarized SAR images (and their derivatives,
PR, PD, NP, and CPwb, see Table 1) are much more complicated. For C-band quad-polarized SAR
measurements, surface currents have negligible impact on short resonant Bragg waves (PD-signal)
which have small relaxation scale and thus do not “feel” the current. This result is in line with the
previous research findings that any radar imaging model based on Bragg scattering theory dramatically
underestimates observed SAR signatures of ocean currents [11,13,15,16].
In our study, additional experimental evidence is provided that the governing mechanism for
radar imaging of ocean currents is the modulations of wave breaking. Significant contributions of wave
breaking to co- and cross-polarized radar scattering (NP and CPwb signals in present notations) [31],
result in quite well detected manifestations of the ocean current features in the SAR image, at arbitrary
polarization configurations.
Unlike dual co-polarized SAR imaging, the manifestation of the current features in cross-polarized
SAR images is not obvious and has rarely been reported [24,25]. However, the unexpected result
found here is that the magnitudes of the current-induced contrasts in the NP-signal greatly exceed,
by factors of 2-to-3, that in the CP-signal. This fact is rather puzzling because both non-polarized and
cross-polarized scattering originate from precisely the same wave breaking events!
To interpret these quad-polarized SAR imaging peculiarities, we adopt the so-called relaxation
approach to describe the wind wave transformation due to non-uniform currents. To that end, it is
necessary to determine the spatial scales of the surface waves responsible for quad-polarized radar
scattering and their differing surface current responses.
Firstly, the scale of Bragg waves, associated with the PD-signal from regular (non-breaking surface),
is prescribed by the radar wavenumber, kR , and may be expressed as kB = 2kR sinθ; for C-band at
moderate incidence angles, it is around 0.06 m. As already discussed, NP- and CPwb-signals are both
associated with radar scattering from enhanced roughness at crests of breaking waves. The NP-signal
is likely governed by quasi-specular radar returns from the roughness elements of large-scale breaking
crests, with k < d·kB , where d
1 is a dividing parameter; in order to be consistent with TSM estimates,
it is specified here as d = 3–4 [36]. However, quasi-specular facets do not provide cross-polarized
scattering. Therefore, we assume that CPwb is governed by quasi-resonant scattering from small-scale
breaking crest roughness, around k = kB .
Indeed, a breaking wave crest generates enhanced isotropic surface roughness with a totally
saturated spectrum ∝ k−4 confined to the localized breaking zone [37]. A local spectrum of this
roughness will peak at a wave number, kp , linked to the wave breaking wavenumber, kwb , defined
as kp = pkwb , with the parameter p varying from 5 to 10. This scale of breaking crests roughness,
kp , imposes the range of breaking waves, providing the CPwb- and NP-signals. For the CPwb
signal, the range of breaking waves is: kwb < kCP ≡ kB /p, and for NP is: kwb < kNP ≡ kB /(pd). Thus,
the breaking waves contributing to NP are longer than those contributing to CP.
Following [17] (see also Equations (11) and (13) from [24]), both NP and CPwb are proportional to
the fraction of the ocean surface covered by the breaking zone
x 1+1/ng
qwb ∝ βBdϕd lnk ∝ cβ u2∗ kwb /g (5)
kRemote Sens. 2019, 11, 2321 13 of 17
To evaluate modulations of PD-, NP-, and CPwb-signals by the currents we define the relaxation
scales of the scattering elements as (see [17] for more details),
τ = m∗ /(2β) (6)
where τ is relaxation time scaled by the wave frequency, m∗ is the wind exponent of the wave spectrum.
Correspondingly, the relaxation scale length kl = (1/2)τ is
kl = cr m∗ g/ku210 (7)
−1
where cr = 4cβ CD ∝ 5 × 10³ is the overall relaxation scale constant.
We then consider wavenumbers kB , kCP , and kNP as typical scales for the scatter for PD, CPwb,
and NP, correspondingly. For the Bragg waves (with k around 102 rad/m for C-band) and m∗ around 1
(see Figure 12 from [31]), the relaxation scale for wind speed from u10 = 3 m/s to u10 = 10 m/s varies in
the range given by lPD =0.05−0.5 m. Since lCP = m∗ P2 lPD and lNP = m∗ P2 d2 lPD (with m∗ = 2/n g =0.4),
the relaxation length scales for CPwb and NP scatterers varies in the range from lCP = 0.4 m to lCP =
4 m, and where lNP = 1 m varying to 100 m, correspondingly. From these rather short relaxation
scales, we anticipate that PD, CRwb and NP should follow wind speed variations on spatial scales
exceeding 100 meters. This is in line with observations shown in Figure 1, where wind speed oscillations
caused by atmospheric gravity waves lead to coherent oscillatory features for any quad-polarized
scattering combinations.
Considering current non-uniformities on a scale, L, from hundred meters to kilometers, condition
L > (lPD , lCP , lNP ) is also fulfilled. The modulation transfer function (MTF), T (k) = e
B/B0 , for the wave
spectrum can be expressed as (see [10,17])
T (k) = τω−1 mk cos2 ϕ·div(u) (8)
where mk is the wavenumber exponent of the wave action spectrum, mk ≈ −9/2, ϕ is wavenumber
direction relative to the wind, and div(u) is the local divergence of the surface current. Indeed, among
the different components of the current velocity gradient tensor, the divergence provides the main
contribution to modulation of any ocean surface quantities integrated over the azimuth (like the total
mean square slopes, or the total fraction of the wave breaking area defined by Equation (5)). Referring
to Equation (8) with (6), one finds that the expected modulation of the Bragg wave spectrum by an
ocean current with gradient of order 10−3 is negligible. This is consistent with observations, confirming
that short scale Bragg waves do not “feel” the current (see see Figures 3, 9 and 11). However, due to
small relaxation scale, PD-signals follow any variations of the near-surface wind speed (Figures 1d
and 5d).
Unlike PD, modulations of NP and CP signals depend on the impact of surface currents over a
rather wide spectral range, forming qwb as defined by (5). As mentioned above, relaxation scales for
the upper limits of the integrals in Equation (5), kNP and kCP , are of order 100 m. Therefore, spectral
modulations at these upper limits due to the currents are expected to be small and to be governed by the
wind speed modulations/changes. Yet, current-induced modulations of the longer wave components
(forming qwb ) due to larger relaxation scales can be significant. Although these longer components do
not likely provide dominant contributions to background (no currents) NP and CP signal values, their
impacts on current-induced modulations of these signals can be significant.
An approximate solution for the modulation of wave breaking by the current can be taken from
([10], their Equation (7)). However, this solution was derived for the Phillips (1985) spectrum [38]
with parameter n g in Equation (5) equal to n g = 2 which differs from the one adopted here (n g = 5).
Therefore, to assess wave breaking modulations by the currents in the present study, we use theRemote Sens. 2019, 11, 2321 14 of 17
asymptotic form of the MTF (Equation (8)). This gives the following expression for the expected
modulations of the ocean surface area covered by breaking zones:
Z Z
qwb = n g + 1 div(u)
e T (k, ϕ)βB(k, ϕ)dϕdlnk ≈ 2mk ω−1
P div(u) (9)
R
kRemote Sens. 2019, 11, 2321 15 of 17
quasi-resonant scattering. Accordingly, routinely observed current signatures in quad-polarized SAR
images essentially originate from wave breaking modulations, and polarized contrast sensitivity can
further help quantitatively retrieve the strength of surface current gradients.
Future investigations will capitalize on the proposed methodology to exploit similar decomposition
to analyze Doppler shifts [5,6]. This approach will help more consistently separate the surface currents
and the wave-induced impacts from the measured polarized Doppler shifts.
Author Contributions: V.K., B.Z. and B.C. conceived the original idea of the study, suggested for the topic, and
contributed to the interpretation of the results; S.F. carried out the RADARSAT-2 data analysis and prepared all of
the figures; B.C., W.P. and A.M. assisted in manuscript revision. S.F., V.K. and B.Z. wrote the manuscript.
Funding: This research received no external funding other than what is acknowledging below.
Acknowledgments: S.F. and B.Z. acknowledge support of National Key Research and Development Program of
China under Grant 2016YFC1401001, National Science Foundation of China for Outstanding Young Scientist under
Grant 41622604, the Excellent Youth Science Foundation of Jiangsu Province under Grant BK20160090, the National
Program on Global Change and Air–Sea Interaction (GASI-IPOVAI-04), and the International Cooperation, CAS,
Chinese–Foreign Cooperation in Key Project under Grant 133337KYSB20160002. V.K. and B.C. acknowledge
support of Russian Science Foundation project no. 17-77-30019. W.P. acknowledges support from the Canadian
Space Agency under SWOT, the Surface Water Ocean Topography program, and GRIP, the Government Research
Initiative Program.
Conflicts of Interest: The authors declare no conflict of interest.
References
1. Lumpkin, R.; Pazos, M. Measuring surface currents with Surface Velocity Program drifters: The instrument,
its data, and some recent results. In Lagrangian Analysis and Prediction of Coastal and Ocean Dynamics;
Cambridge University Press: Cambridge, UK, 2007; pp. 39–67.
2. Lund, B.; Graber, H.C.; Hessner, K.; Williams, N.J. On shipboard marine X-band radar near-surface current
“calibration”. J. Atmos. Ocean. Technol. 2015, 32, 1928–1944. [CrossRef]
3. Weber, B.L.; Barrick, D.E. On the nonlinear theory for gravity waves on the ocean’s surface: Part I. Derivations.
J. Phys. Oceanogr. 1977, 7, 3–10. [CrossRef]
4. Broche, P.; Maistre, J.C.; Forget, P. Measure par radar de´came´trique coh e´rent des courants superficiels
engendre´s par le vent. Oceanol. Acta 1983, 6, 43–53.
5. Chapron, B.; Collard, F.; Ardhuin, F. Direct measurements of ocean surface velocity from space: Interpretation
and validation. J. Geophys. Res. Oceans 2005, 110, 1–17. [CrossRef]
6. Johannessen, J.A.; Chapron, B.; Collard, F.; Kudryavtsev, V.; Mouche, A.; Akimov, D.; Dagestad, K.-F. Direct
ocean surface velocity measurements from space: Improved quantitative interpretation of Envisat ASAR
observations. Geophys. Res. Lett. 2008, 35, 1–6. [CrossRef]
7. Romeiser, R.; Suchandt, S.; Runge, H.; Steinbrecher, U.; Grünler, S. First analysis of TerraSAR-X along-track
InSAR-derived current fields. IEEE Trans. Geosci. Remote Sens. 2010, 48, 820–829. [CrossRef]
8. Romeiser, R.; Runge, H.; Suchandt, S.; Kahle, R.; Rossi, C.; Bell, P.S. Quality assessment of surface current
fields from TerraSAR-X and TanDEM-X along-track interferometry and doppler centroid analysis. IEEE Trans.
Geosci. Remote Sens. 2014, 52, 2759–2772. [CrossRef]
9. Kudryavtsev, V.; Myasoedov, A.; Chapron, B.; Johannessen, J.A.; Collard, F. Joint sun-glitter and radar
imagery of surface slicks. Remote Sens. Environ. 2012, 120, 123–132. [CrossRef]
10. Kudryavtsev, V.; Myasoedov, A.; Chapron, B.; Johannessen, J.; Collard, F. Imaging meso-scale upper ocean
dynamics using SAR and optical data. J. Geophys. Res. Oceans. 2012, 117, 1–13. [CrossRef]
11. Alpers, W.; Hennings, I. A theory of the imaging mechanism of underwater bottom topography by real and
synthetic aperture radar. J. Geophys. Res. Oceans. 1984, 89, 10529–10546. [CrossRef]
12. Holliday, D.; St-Cyr, G.; Woods, N.E. A radar ocean imaging model for small to moderate incidence angles.
Int. J. Remote Sens. 1986, 7, 1809–1834. [CrossRef]
13. Lyzenga, D.R.; Bennett, J.R. Full-spectrum modeling of synthetic aperture radar internal wave signatures.
J. Geophys. Res. Oceans 1988, 93, 12345–12354. [CrossRef]
14. Thompson, D.R. Calculation of radar backscatter modulations from internal waves. J. Geophys. Res. Oceans
1988, 93, 12371–12380. [CrossRef]Remote Sens. 2019, 11, 2321 16 of 17
15. Romeiser, R.; Alpers, W. An improved composite surface model for the radar backscattering cross section of
the ocean surface: 2. Model response to surface roughness variations and the radar imaging of underwater
bottom topography. J. Geophys. Res. Oceans 1997, 102, 25251–25267. [CrossRef]
16. Cooper, A.L.; Chubb, S.R.; Askari, F.; Valenzuela, G.R.; Keller, W.C.; Bennett, J.R. Radar surface signatures for
the two-dimensional tidal circulation over Phelps Bank, Nantucket shoals: A comparison between theory
and experiment. J. Geophys. Res. Oceans 1994, 99, 7865–7883. [CrossRef]
17. Kudryavtsev, V.; Akimov, D.; Johannessen, J.; Chapron, B. On radar imaging of current features: 1. Model
and comparison with observations. J. Geophys. Res. Oceans 2005, 110, 1–27. [CrossRef]
18. Lyzenga, D.R. Effects of Wave Breaking on Sar Signatures Observed Near the Edge of the Gulf Stream.
In Proceedings of the International Geoscience & Remote Sensing Symposium, Lincoln, NE, USA, 31 May
1996.
19. Wetzel, L.B. On Microwave Scattering by Breaking Waves, in Wave Dynamics and Radio Probing of the Ocean
Surface; Phillips, O.M., Hasselmann, K., Eds.; Springer: New York, NY, USA, 1986; pp. 273–284.
20. Chubb, S.; Cooper, A.; Jansen, R.; Fusina, R.; Askari, F.; Lee, J.-S. Radar backscatter from breaking waves in
Gulf Stream current convergence fronts. IEEE Trans. Geosci. Remote Sens. 1999, 37, 1951–1966. [CrossRef]
21. Jansen, R.W.; Shen, C.Y.; Chubb, S.R.; Cooper, A.L.; Evans, T.E. Subsurface, surface, and radar modeling of a
Gulf Stream current convergence. J. Geophys. Res. Oceans 1998, 103, 18723–18743. [CrossRef]
22. Snyder, R.L.; Kennedy, R.M. On the formation of whitecaps by a threshold mechanism: 1. Basic formation.
J. Phys. Oceanogr. 1983, 13, 1482–1492. [CrossRef]
23. Hughes, B.A. The effect of internal waves on surface wind waves: 2. Theoretical analysis. J. Geophys. Res.
Oceans 1978, 83, 455–465. [CrossRef]
24. Kudryavtsev, V.; Kozlov, I.; Chapron, B.; Johannessen, J.A. Quad-polarization SAR features of ocean currents.
J. Geophys. Res. Oceans 2014, 119, 6046–6065. [CrossRef]
25. Zhang, G.; Perrie, W. Dual-Polarized Backscatter Features of Surface Currents in the Open Ocean during
Typhoon Lan (2017). Remote Sens. 2018, 10, 875. [CrossRef]
26. Kudryavtsev, V.; He, Y.; Zhang, B.; Liu, G.; Hu, H.; Perrie, W.; Shen, H. Radar imaging of intense nonlinear
Ekman divergence. Geophys. Res. Lett. 2016, 43, 9810–9818.
27. Jones, C.T.; Sikora, T.D.; Vachon, P.W.; Buckley, J.R. Ocean feature analysis using automated detection and
classification of sea-surface temperature front signatures in RADARSAT-2 images. Bull. Am. Meteorol. Soc.
2014, 95, 677–679. [CrossRef]
28. Kudryavtsev, V.; Hauser, D.; Caudal, G.; Chapron, B. A semiempirical model of the normalized radar
cross-section of the sea surface 1. Background model. J. Geophys. Res. Oceans 2003, 108, 1–24. [CrossRef]
29. Kudryavtsev, V.N.; Chapron, B.; Myasoedov, A.G.; Collard, F.; Johannessen, J.A. On Dual Co-Polarized SAR
Measurements of the Ocean Surface. IEEE Geosci. Remote Sens. Lett. 2013, 10, 761–765. [CrossRef]
30. Hansen, M.W.; Kudryavtsev, V.; Chapron, B.; Brekke, C.; Johannessen, J.A. Wave Breaking in Slicks: Impacts
on C-Band Quad-Polarized SAR Measurements. IEEE J. Sel. Top. Appl. Earth Obs. Remote Sens. 2016, 9, 1–12.
[CrossRef]
31. Kudryavtsev, V.N.; Fan, S.; Zhang, B.; Mouche, A.A.; Chapron, B. On Quad-Polarized SAR Measurements of
the Ocean Surface. IEEE Trans. Geosci. Remote Sens. 2019, 1–9. [CrossRef]
32. Slade, B. RADARSAT-2 Product Description. Issue 1/6, RN-SP-52-1238. Available online: http://gs.
mdacorporation.com/products/sensor/radarsat2/RS2_Product_Description.pdf (accessed on 1 January 2018).
33. Lu, Y.; Zhang, B.; Perrie, W.; Mouche, A.A.; Li, X.; Wang, H. A C-Band Geophysical Model Function for
Determining Coastal Wind Speed Using Synthetic Aperture Radar. IEEE J. Sel. Top. Appl. Earth Obs.
Remote Sens. 2018, 11, 2417–2428. [CrossRef]
34. Beal, R.; Kudryavtsev, V.; Thompson, D.; Grodsky, S.; Tilley, D.; Dulov, V.; Graber, H. The influence of the
marine atmospheric boundary layer on ERS-1 synthetic aperture radar imagery of the Gulf Stream. J. Geophys.
Res. Oceans 1997, 102, 5799–5814. [CrossRef]
35. Kuang, H.-L.; Perrie, W.; Xie, T.; Zhang, B.; Chen, W. Retrievals of sea surface temperature fronts from SAR
imagery. Geophys. Res. Lett. 2012, 39, 1–7. [CrossRef]
36. Voronovich, A.G.; Zavorotny, V.U. Theoretical model for scattering of radar signals in Ku- and C-bands from
a rough sea surface with breaking waves. Waves Random Media 2001, 11, 247–269. [CrossRef]
37. Walker, D.T.; Lyzenga, D.R.; Ericson, E.; Lung, D.E. Radar backscatter and surface roughness measurements
from stationary breaking waves. Philos. Trams. R. Soc. Lond. Ser. A 1996, 452, 1953–1984.You can also read