INVESTOR PRESENTATION - JUNE 2021 - Noodles & Company
←
→
Page content transcription
If your browser does not render page correctly, please read the page content below
JUNE 2021

INVESTOR PRESENTATION
A T A G L A N CE                                                                                                                                                                                                         N O O D L E S & C O M P AN Y I N VE ST OR P R E S E NT AT IO N

                   Disclaimer
                   Forward-Looking Statements                                                                                Note Regarding Non-GAAP Measures
                   This presentation contains forward-looking statements within the meaning of the Private Securities        In this presentation, we include certain supplemental financial measures, including EBITDA,
                   Litigation Reform Act of 1995. All statements other than statements of historical fact included in this   Adjusted EBITDA, restaurant contribution, and restaurant contribution margin, which are
                   presentation are forward-looking statements. Forward-looking statements discuss our current               neither required by nor presented in accordance with generally accepted accounting principles
                   expectations and projections relating to our financial condition, results of operations, plans,           in the U.S. (“GAAP”). The presentation of this financial information is not intended to be
                   objectives, future performance and business. These statements may be preceded by, followed by or          considered in isolation or as a substitute for, or to be superior to, the financial information
                   include the words “may,” “might,” “will,” “objective,” “intend,” “should,” “could,” “can,” “would,”       prepared and presented in accordance with GAAP. We use these non-GAAP financial measures
                   “expect,” “believe,” “design,” “estimate,” “predict,” “potential,” “plan” or the negatives thereof and    for financial and operational decision making and as a means to evaluate period-to-period
                   other words and terms of similar meaning. These statements are not guarantees of future                   comparisons. We believe that they provide useful information about operating results, enhance
                   performance and involve a number of known and unknown risks, assumptions, trends, uncertainties           the overall understanding of past financial performance and future prospects and allow for
                   and factors that are beyond our control, including without limitation, those identified in our annual     greater transparency with respect to key metrics used by management in its financial and
                   report on Form 10-K for the fiscal year ended December 29, 2020 filed on February 26, 2021 and            operational decision making. You are cautioned, however, that these measures, as we calculate
                   our quarterly reports on Form 10-Q, under the sections titled “Risk Factors,” “Cautionary Note            them, are not necessarily comparable to similarly titled measures reported by other companies.
                   Regarding Forward-Looking Statements,” and “Management's Discussion and Analysis of Financial             In addition, these measures have limitations as analytical tools and should be considered only in
                   Condition and Results of Operations.” Should one or more of these risks or uncertainties materialize      conjunction with our financial results reported under GAAP, and not in isolation. See the
                   or should underlying assumptions prove incorrect, actual results may vary materially from those           Appendix for a reconciliation of each non-GAAP financial measure included in this presentation
                   anticipated, estimated or projected. You should not place undue reliance on these statements. We          to its directly comparable GAAP measurement. For more information on why management
                   have based these forward-looking statements on our current expectations and projections about             considers these non-GAAP financial measures to be important indicators of our operational
                   future events. Although Noodles & Company ("we" or the "Company") believes that our                       strength and performance, as well as the limitations on these measures as an analytical tool,
                   assumptions made in connection with the forward-looking statements are reasonable, we cannot              please see our annual report on Form 10-K for the fiscal year ended December 29, 2020 filed on
                   assure you that the assumptions and expectations will prove to be correct. All forward-looking            February 26, 2021 and our quarterly reports on Form 10-Q, under the sections titled “Key
                   statements speak only as of the date of this document. We undertake no obligations to update or           Measures We Use to Evaluate Our Performance.”
                   revise publicly any forward-looking statements in this presentation, whether as a result of new
                   information, future events or otherwise other than as required under the federal securities laws.

                                                                                                                                                                                                                                                                        2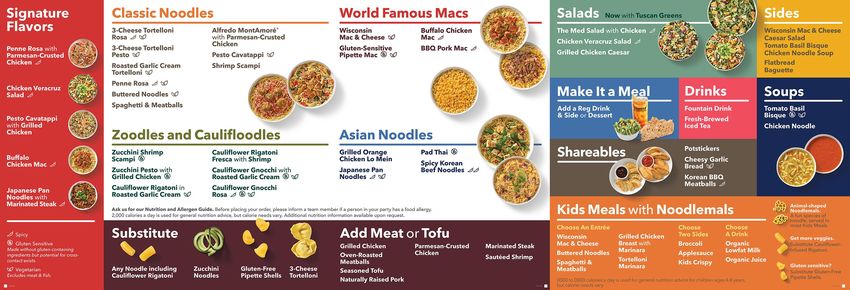
I N V E S TM EN T H I G H LI GHT S                                         N O O D L E S & C O M P AN Y I N VE ST OR P R E S E NT AT IO N

Investment Highlights

    Winning in 2021 and Beyond
   OUR BRAND:
   Fast Casual Leader in a Consumer Favorite: Noodles and Pasta

   OUR MENU:
   Innovative, Varied and Cooked Fresh-to-Order Attracts Today’s Consumer

   OUR GUEST ENGAGEMENT:
   Personalized Digital Connections Puts Guests in Control

   OUR OPERATING MODEL:
   A Robust Model Executed by a High Performing, Passionate Team

   OUR UNIT GROWTH:
   A Deep and Growing Pipeline of Company Locations and
   Recent Southern US Franchise Program Launch

                                                                                                                           3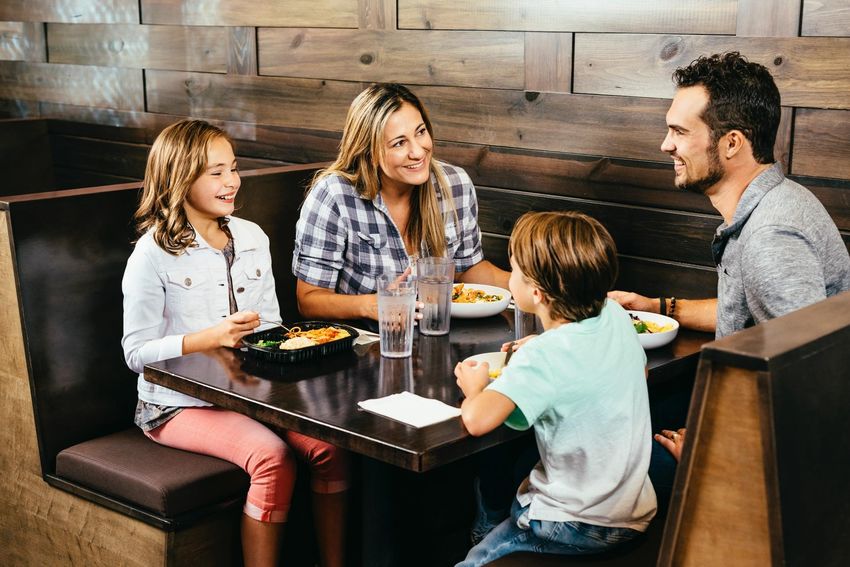
A T A G L A N CE                                                                                                      N O O D L E S & C O M P AN Y I N VE ST OR P R E S E NT AT IO N

Investment Highlights

Built a Strong Foundation for Accelerated Growth

                                                                                                                       New menu innovations
                                                                                                                       – Cauliflower Gnocchi
                                                                                                                       & Tortelloni

                                                                                                                       Steamer introduction
                                                                                     Expanded Noodles native
                                                                                     delivery and curbside pickup      Franchise Initiative launched
                                                                                     Rollout “Kitchen of the Future”
                                                                                     - FOH efficiency acceleration
                                                       Expanded healthy noodle
                                                       options–Cauliflower-infused   New executive leadership –
                                                       noodles                       CFO and CMO
                                                                                     Launched Group Ordering,
                                                       Order ahead and drive thru    Apple Pay and Order Status
                          Introduced healthy-noodle
                                                       addition
                          option – zucchini noodles                                  Expanded inclusion & diversity
                          (“zoodles”)                                                mental health efforts
                                                       Reimagined mobile app and
                          Expanded off-prem model      Rewards platform              Bolstered company &
                          to include Quick Pick-Up                                   franchise teams
       Launched Noodles                                Introduced industry-leading
       Rewards Program                                 team member benefits –
                          Invested in advanced labor   LifeatNoodles
                          management technology
                                                       Launched National delivery

                                                                                                                                                                      4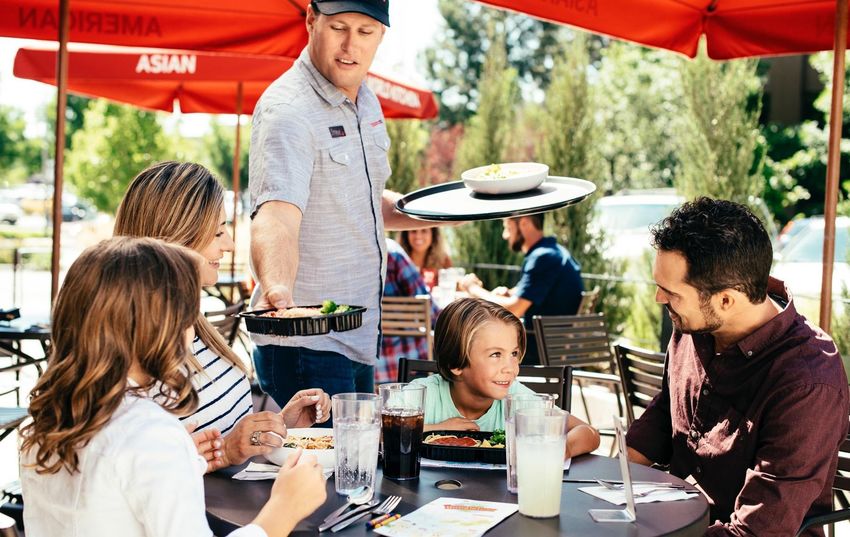
I N V E S TM EN T H I G H LI GHT S                                                         N O O D L E S & C O M P AN Y I N VE ST OR P R E S E NT AT IO N

Investment Highlights

Goal: Become the Premier Restaurant Growth Story

                                                                          Unit Expansion
                                                                   10%+ Systemwide Growth by 2023
                                                                 Superior Economics (30%+ COC Target)
                                                              Ideal Operating Model For Post-Covid World

                                                                           AUV Growth
                                                               Nearly 40% of Units Already >$1.45M AUV*
                                                                      On Trend Culinary Innovation
                                                                     Digital & Off-Premise Strengths

                                                                        Margin Expansion
                                                                       Pricing Power
                                                                  Low Fixed Cost Structure
                                                       Continued Labor / COGS Efficiency Opportunities
                                                   * A p r i l 2021

                                                                                                                                          5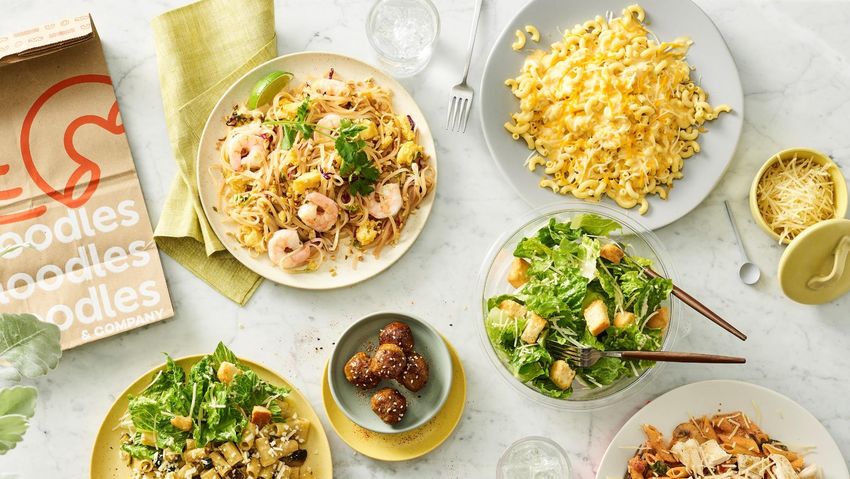
A T A G L A N CE N O O D L E S & C O M P AN Y I N VE ST OR P R E S E NT AT IO N
Our Brand
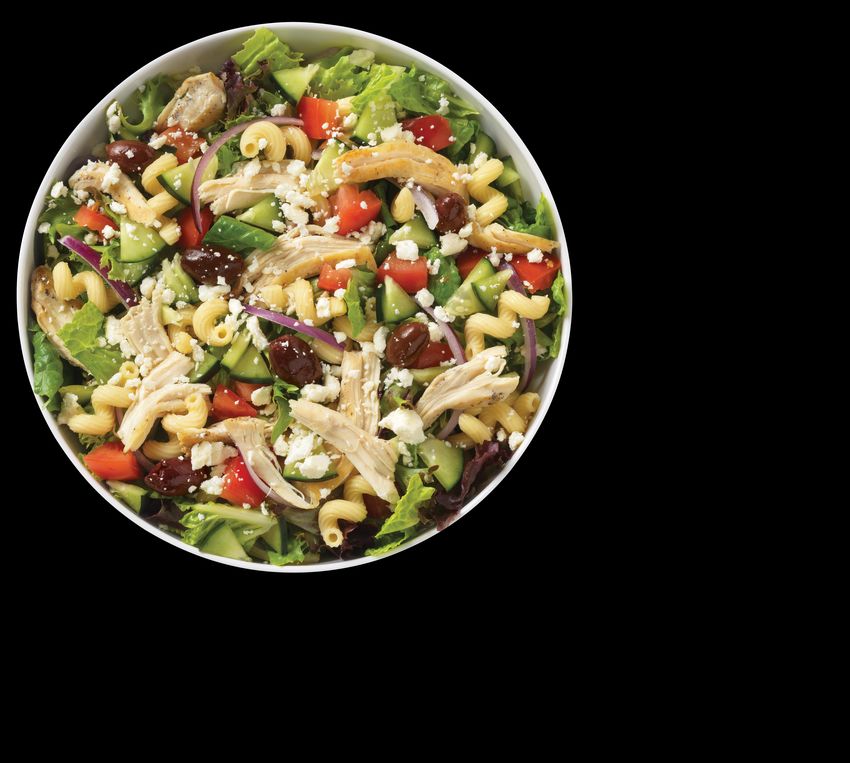
A Brand Unlike Any Other
Welcome to Noodles & Company
Noodles & Pasta are one of America’s
favorite foods – a staple of diets across the
globe and the ultimate comfort food to
bring family and friends together.
From kids to adults, healthy to indulgent,
and familiar to new, Noodles & Company
has something for everyone.
Fresh, inventive, and cooked fresh-to
order by our caring team members, we
offer guests the ability to experience a
world of flavors - however, whenever, and
wherever they would like to.
6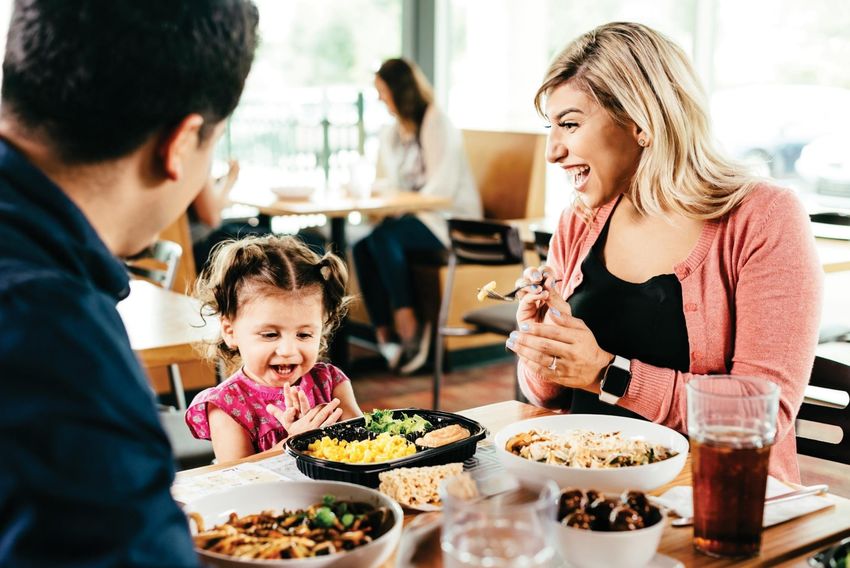
I N V E S TM EN T H I G H LI GHT S                                                      N O O D L E S & C O M P AN Y I N VE ST OR P R E S E NT AT IO N

Our Brand

Unique offering of a consumer favorite
• Only national fast casual chain delivering world flavors through noodles and pasta

• Proprietary sauces and innovative approach to cooking provide high barrier to entry

                                                                                                                                       7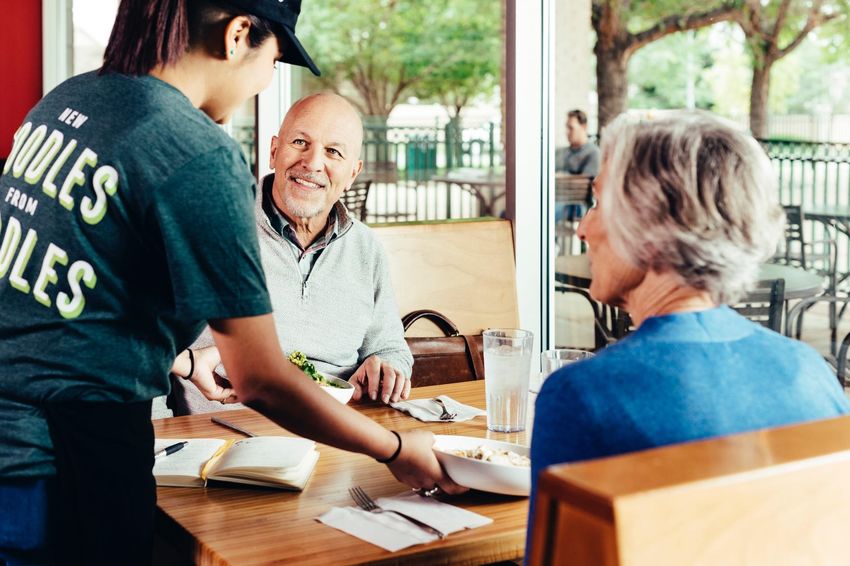
I N V E S TM EN T H I G H LI GHT S                                                                                               N O O D L E S & C O M P AN Y I N VE ST OR P R E S E NT AT IO N

Our Brand

Attractive Target Market With Broad Appeal
• Younger demographic, +7ppt vs industry peers                      Age Distribution of Customers                            Household Distribution
                                                                        (Noodles & Company vs Peers)                                           (vs Peers)
• Particular strength with millennial families
                                                                                                         Peer Average
                                                                                                                              2+                                       1+
                                                                                                                           Household                                Children
                                                                                                 NDLS                          86.5%                                  47.2%
                                                                                                 +7ppt                         +4 ppt                                 +9 ppt

                                                                                                                                 Gender Distribution

                                                                                                                        Source: Coke Dine360, NDLS vs fast casual, Aug ‘20 TTM
                                                 Source: Sense360, surveys collected Q1-Q4 ‘20

                                                                                                                                                                                 8
I N V E S TM EN T H I G H LI GHT S                               N O O D L E S & C O M P AN Y I N VE ST OR P R E S E NT AT IO N

Our Menu

A World of Flavors Under One Roof
• Variety to meet wide range of dietary and flavor preferences

• Strength in both lunch and dinner dayparts

                                                                                                                9
I N V E S TM EN T H I G H LI GHT S N O O D L E S & C O M P AN Y I N VE ST OR P R E S E NT AT IO N
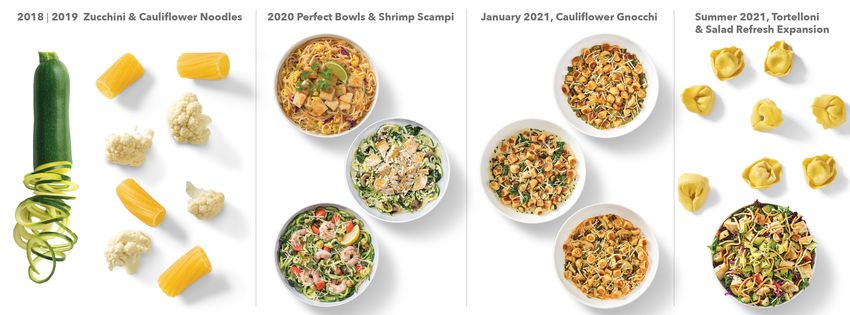
Our Menu
Innovative Approach to Culinary
• Focused on increasing both trial and frequency
• Broadened reach through introduction of healthier alternatives, representing 14% product mix
10I N V E S TM EN T H I G H LI GHT S N O O D L E S & C O M P AN Y I N VE ST OR P R E S E NT AT IO N
Our Menu
Craveable Food, Cooked Fresh
• Real cooking, right when you order it. Customized exactly how you like it.
• Incredibly satisfying, high-quality food experience
11I N V E S TM EN T H I G H LI GHT S N O O D L E S & C O M P AN Y I N VE ST OR P R E S E NT AT IO N
Our Guest Engagement
Best in Class Off-Premise Experience
• Food travels extremely well. Speed and price point matches a wide range of dining occasions
• Continuous innovation in quick-pick up and curbside provides options to make every visit quick
and satisfying
• Introduction of order ahead drive through window for new units
• Nearly 60% off-premise mix even before COVID, currently at 92%
off-premise as in store dining has recently resumed
12I N V E S TM EN T H I G H LI GHT S N O O D L E S & C O M P AN Y I N VE ST OR P R E S E NT AT IO N
Our Guest Engagement
Increasing Digital Sales Even as In Restaurant Sales Return
• Digital sales growth has proven long-standing with continued expansion opportunity
• Continued growth and opportunity for in-restaurant sales
AUV and channel mix
($ in thousands)
Digital In-Restaurant Total
April ‘21 $768 $579 $1,347
1Q ‘21 $724 $446 $1,169
FY2019 $327 $841 $1,168
Digital channel includes Online ordering, curbside and delivery. In -restaurant includes dine-in and To Go.
AUV consists of the average annualized sales of all restaurants for a given time period. AUV is calculated by dividing restau rant revenue by the number of operating days within each time period and multiplying by
the number of operating days we have in a typical year. AUV normalizes for the impact of temporarily closed restaurants.
13I N V E S TM EN T H I G H LI GHT S N O O D L E S & C O M P AN Y I N VE ST OR P R E S E NT AT IO N
Our Guest Engagement
Digital and Delivery Accelerating Brand Awareness
• Prominently shown in delivery platforms for multiple cuisines searches (Asian, Italian, Vegetarian, etc.)
• More effective targeted digital media spend
Average Restaurant Level Sales by channel
($ in thousands)
Significant increase in aided awareness
95 % Delivery In-Restaurant
86 % March ‘21
April ‘21 $379 $579
Sept ‘20
Increase in Delivery
Meaningful improvement in brand trial
1Q ‘21 $361 $446 sales even as In-
Restaurant sales
78 %
increased
$117 $841
61 % March ‘21
FY2019
Sept ‘20 Note: Delivery includes Third Party delivery and owned delivery.
AUV consists of the average annualized sales of all restaurants for a given time period. AUV is calculated by dividing
restaurant revenue by the number of operating days within each time period and multiplying by the number of
Source: Noodles & Company awareness tracker. March ‘21 operating days we have in a typical year. AUV normalizes for the impact of temporarily closed restaurants.
14I N V E S TM EN T H I G H LI GHT S N O O D L E S & C O M P AN Y I N VE ST OR P R E S E NT AT IO N
Our Guest Engagement
Rapidly Growing Rewards Program
• Program combining point-based redemption, experiential “Noodles Rewards
benefits, surprise & delight rewards
named #2 Fast Casual
• Ability to analyze, understand, and predict guest behavior to Rewards Program by
personalize engagement with the brand Newsweek for 2021”
+ 3.6 M
REWARDS
20 %
REWARDS GROWTH
MEMBERS vs. 2019
15I N V E S TM EN T H I G H LI GHT S N O O D L E S & C O M P AN Y I N VE ST OR P R E S E NT AT IO N
Our Operating Model
Team Member Retention Meaningfully Better than Industry Average
• A culture of caring and operational excellence
• Industry leading approach to benefits and employee engagement
Superior Turnover Metrics to Industry
TTM Q1 2021
Fast Casual
Manager 28% 43%
Team member 110% 132%
Source: Black Box Workforce Intelligence
16I N V E S TM EN T H I G H LI GHT S N O O D L E S & C O M P AN Y I N VE ST OR P R E S E NT AT IO N
Our Operating Model
Relentless Focus on Improving Efficiencies
• 7 hours of labor per restaurant per day removed from system from 2018 to 2020
Represents $14 million in annual labor savings / cost avoidance
• 2021 Steamer launch anticipated benefits
Increases efficiency in production by bringing ingredients to temp quickly prior to cooking
~2 hours additional labor savings per restaurant per day
~30 second improvement in cook times
• Supply Chain innovation to improve sourcing and contracting strategy
Disciplined approach to cost management, food safety, and distribution
1Q’19 1Q’21 B / (W)
COGS 26.7% 25.0% 170 bps
Labor 34.1% 31.8% 230 bps
17I N V E S TM EN T H I G H LI GHT S N O O D L E S & C O M P AN Y I N VE ST OR P R E S E NT AT IO N
Our Operating Model
Margin Expansion Levers in Place
Pricing power and low prime costs
mitigates inflationary pressure and
allows for meaningful leverage on fixed
costs
Labor efficiencies found in kitchen,
particularly through introduction of
steamers, and in off-premise sales
model and team retention
COGS efficiencies through vendor
duplicity and commodity management
18I N V E S TM EN T H I G H LI GHT S N O O D L E S & C O M P AN Y I N VE ST OR P R E S E NT AT IO N
Our Unit Growth
National Footprint with Both Infill and New Market Opportunities
• Significant infill opportunities in existing markets
• Contiguous company new market growth
• Recent southern U.S. franchise initiative
Franchise Target Markets
372 76
Existing Markets
(# Company / # Franchised)
COMPANY FRANCHISED
RESTAURANTS RESTAURANTS
1,500+ National Unit Potential
As of 3/30/2021
19I N V E S TM EN T H I G H LI GHT S N O O D L E S & C O M P AN Y I N VE ST OR P R E S E NT AT IO N
Our Unit Growth
Company Infill Growth with >30% Cash-on-Cash Returns
• 2019/2020 new restaurant class is the best in our history, and well ahead of prospective new
New Unit Economic Model
unit economic model
Q1 2021: New Restaurants 109% of Company Avg. Sales; +340 bps Margin Size
(Sq. Ft) 2,000
• Efficient operating model: Reduced square footage, more efficient kitchen
Net Development
Off premise orientation: 70%+ of new units to include order ahead drive through window
Cost $800K
• Disciplined strategy with majority of company growth from infill locations
Majority of company marketsI N V E S TM EN T H I G H LI GHT S N O O D L E S & C O M P AN Y I N VE ST OR P R E S E NT AT IO N
Our Unit Growth
Franchising Poised for Significant Growth
• Early 2021 announcement on expanded franchise program
• Attractive economic and operating model for franchisees
Low build-out cost relative to most QSR / casual dining models
Strong cash on cash returns, inclusive of ~55% prime costs
Infrastructure to support growth & quickly achieve scale
Concept’s digital, off-premise and menu strengths on trend
21APPENDIX
SEC TION TITLE                                                                                                                                                                                                                         P R E S E N T AT IO N N A ME

Restaurant Contribution Margin Reconciliation

                                                                                                                                                             Quarter Ended
                                                                                                     Q1 2021       Q4 2020       Q3 2020        Q2 2020        Q1 2020       Q4 2019      Q3 2019        Q2 2019       Q1 2019

             Income (loss) from operations                                                              ($1,365)      ($3,372)         $722       ($12,525)       ($4,854)        $247        $5,044         $1,238       ($1,090)
             Less: Franchising and Royalty Fees                                                           1,833         1,838          1,569           136          1,632        1,582         1,545          1,332         1,281
             Plus: General and Administrative                                                            10,929        11,461        10,827         10,034         10,554       11,022        10,436        11,848         10,140
             Depreciation and Amortization                                                                5,587         5,436          5,541         5,397          5,335        5,460         5,458          5,661         5,507
             Pre-opening                                                                                     58            60           239             71             73           71           266             65              -

             Restaurant impairments, closure costs and asset disposal                                     1,231         2,557           369          2,558          1,056        4,107           336          2,884           420

             Restaurant Contribution                                                                    $14,607       $14,304       $16,129         $5,399        $10,532      $19,325       $19,995       $20,364        $13,696

             Restaurant contribution margin                                                               13.6%          13.6%         15.4%          6.7%          10.7%        17.2%          17.1%         17.1%         12.6%

                 Not e: Res taurant contribution and res taurant contributi on margin are non -GAAP measures that ar e n eith er required by, n or pres ent ed in accordance wi th GAA P. R estaurant c ontribution repr esen t s
                 restaurant rev enue l es s res taurant o perating cost s which are cos t of sal es, labor, occupancy and o ther restaurant o perating cost s. Res taurant contribution margin repres ents restaurant con tributio n
                 as a percentag e o f restaurant rev enue. Th e calculation of th es e measures may no t be comparable to similar measures report ed by o ther c ompani es. Th e pres entation o f res taurant contribution an d
                 restaurant contribution margin is not intended to b e considered in isolati on or as a substitu t e for, or to be su perior to , the financial information prepared and pres ent ed in accordance with GAAP.
                 Management beli ev es that res taurant contribution and restaurant contribution margin are important to ols for investors and oth er inter est ed parti es becaus e th ey are widely-u sed metrics withi n
                 the r estaurant indus try t o evaluate res taurant-lev el productivit y, effici ency and perf ormance. Management al so u ses res taurant contribution and res taurant contribution margin as metrics t o
                 evaluate the profitability of incremental sales at our restaurants, restaurant performance across periods and restaurant financial performance compared with competitors.

                                                                                                                                                                                                                                                       22
                                                                                                                                                                                                                                              P A G E N U MB ER
You can also read


