INVESTOR PRESENTATION | August 2020 - Granite REIT

Page created by Tracy Garrett
 
CONTINUE READING
INVESTOR PRESENTATION | August 2020 - Granite REIT
INVESTOR
 PRESENTATION | August 2020
INVESTOR
PRESENTATION | August 2021
INVESTOR PRESENTATION | August 2020 - Granite REIT
PRESENTATION OF CERTAIN INFORMATION
•   Unless otherwise indicated in this presentation, all information is presented as of June 30, 2021 and all financial information that is identified as current refers to the period ending June 30, 2021. For definitions of
    certain non-IFRS measures used in this presentation including funds from operations (“FFO”), adjusted funds from operations (“AFFO”), FFO payout ratio, AFFO payout ratio, net operating income calculated on a cash
    basis (“NOI-cash basis”), net leverage ratio, earnings before interest, income taxes, depreciation and amortization (“EBITDA”), unencumbered asset coverage ratio, indebtedness ratio, and interest coverage ratio,
    please refer to Granite’s Management Discussion and Analysis (“MD&A”) in its Q2 2021 report (available on Granite’s website https://granitereit.com/investors/financial-reports-and-filings/).
•   This presentation may contain statements that, to the extent they are not recitations of historical fact, constitute “forward-looking statements” or “forward-looking information” within the meaning of applicable
    securities legislation, including the United States Securities Act of 1933, as amended, the United States Securities Exchange Act of 1934, as amended, and applicable Canadian securities legislation. Forward-looking
    statements and forward-looking information may include, among others, statements regarding Granite’s future plans, goals, strategies, intentions, beliefs, estimates, costs, objectives, capital structure, cost of capital,
    tenant base, tax consequences, economic performance or expectations, or the assumptions underlying any of the foregoing. Words such as “outlook”, “may”, “would”, “could”, “should”, “will”, “likely”, “expect”,
    “anticipate”, “believe”, “intend”, “plan”, “forecast”, “project”, “estimate”, “seek” and similar expressions are used to identify forward-looking statements and forward-looking information.
•   Forward-looking statements and forward-looking information should not be read as guarantees of future events, performance or results and will not necessarily be accurate indications of whether or the times at or by
    which such future performance will be achieved. Undue reliance should not be placed on such statements. There can also be no assurance that: Granite’s expectations regarding the impact of the COVID-19 pandemic
    and government measures to contain it, including with respect to Granite’s ability to weather the impact of COVID-19, the effectiveness of measures intended to mitigate such impact, and Granite’s ability to deliver
    cash flow stability and growth and create long-term value for unitholders; Granite’s ability to implement its ESG+R program and related targets and goals; the expansion and diversification of Granite’s real estate
    portfolio and the reduction in Granite’s exposure to Magna and the special purpose properties; the ability of Granite to accelerate growth and to grow its net asset value and FFO and AFFO per unit; the ability of
    Granite to find and integrate satisfactory acquisition, joint venture and development opportunities and to strategically deploy the proceeds from recently sold properties and financing initiatives; Granite’s intended
    use of the net proceeds of its equity and debenture offerings to fund potential acquisitions and for the other purposes described previously; the potential for expansion and rental growth at the properties in
    Mississauga, Ontario and Ajax, Ontario and the expected enhancement to the yields of such properties from such potential expansion and rental growth; the expected construction of and development yield of the
    site in Houston, Texas; the expected development and construction of an e-commerce and logistics warehouse on the acquired land in Fort Worth, Texas; the expected construction of the distribution/light industrial
    facility on the 13-acre site in Altbach, Germany; the expected construction of a modern distribution facility on the 50.8 acre site in Murfreesboro, Tennessee and the potential yield on the facility; the expected
    development of a multi-phased business park on the 9.2 acre site in Brantford, Ontario, and the potential yield from the project; the timing of payment of associated unpaid construction costs and holdbacks; Granite’s
    ability to dispose of any non-core assets and the potential yield of the facility on satisfactory terms; Granite’s ability to meet its target occupancy goals; Granite’s ability to secure sustainability or other certifications for
    any of its properties; the expected impact of the refinancing of the term loans on Granite’s returns and cash flow; and the expected amount of any distributions and distribution increase, can be achieved in a timely
    manner, with the expected impact or at all.
•   Forward-looking statements and forward-looking information are based on information available at the time and/or management’s good faith assumptions and analyses made in light of Granite’s perception of
    historical trends, current conditions and expected future developments, as well as other factors Granite believes are appropriate in the circumstances. Given the impact of the COVID-19 pandemic and government
    measures to contain it, there is inherently more uncertainty associated with our assumptions as compared to prior periods. Forward-looking statements and forward-looking information are subject to known and
    unknown risks, uncertainties and other unpredictable factors, many of which are beyond Granite’s control, that could cause actual events or results to differ materially from such forward-looking statements and
    forward-looking information.
•   Important factors that could cause such differences include, but are not limited to, the impact of the COVID-19 pandemic and government measures to contain it, and the resulting economic downturn, on Granite’s
    business, operations and financial condition; the risk that the pandemic or such measures intensify; the duration of the pandemic and related impacts; the risk of changes to tax or other laws and treaties that may
    adversely affect Granite REIT’s mutual fund trust status under the Income Tax Act (Canada) or the effective tax rate in other jurisdictions in which Granite operates; economic, market and competitive conditions and
    other risks that may adversely affect Granite’s ability to expand and diversify its real estate portfolio and dispose of any non-core assets on satisfactory terms; and the risks set forth in the “Risk Factors” section in
    Granite’s AIF for 2020 dated March 3, 2021, filed on SEDAR at www.sedar.com and attached as Exhibit 1 to the Trust’s Annual Report on Form 40-F for the year ended December 31, 2020 filed with the SEC and
    available online on EDGAR at www.sec.gov, all of which investors are strongly advised to review. The “Risk Factors” section also contains information about the material factors or assumptions underlying such
    forward-looking statements and forward-looking information.
•   Forward-looking statements and forward-looking information speak only as of the date the statements and information were made and unless otherwise required by applicable securities laws, Granite expressly
    disclaims any intention and undertakes no obligation to update or revise any forward-looking statements or forward-looking information contained in this presentation to reflect subsequent information, events
                                                                                                                                                                                                         August 2021or                      2
    circumstances or otherwise.
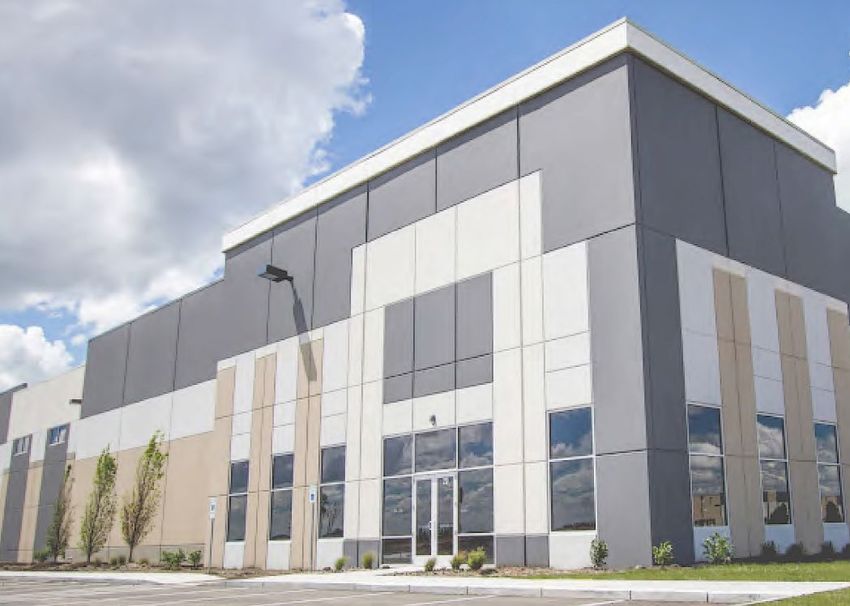
INVESTOR PRESENTATION | August 2020 - Granite REIT
GRANITE HIGHLIGHTS
    ORGANIZATIONAL PRINCIPLES                                                 PORTFOLIO OVERVIEW                  FINANCIAL PERFORMANCE

     Long-term total return focused                                       110 income-producing properties +           78% LTM AFFO POR
                                                                            8 development properties/land

    Conservative and flexible capital                                                                                20% net leverage ratio
                                                                            51.3M square feet with 99.3%
               structure                                                            occupancy

                                                                                                                GRT.UN on TSX and GRP.U on NYSE
    Platform strength and active asset
                                                                               $6.4B in property value
              management
                                                                                                                Market Cap. of ∼$5.7B and EV of
                                                                                                                            ∼$7.0B
     Institutional quality real estate                                       High quality and creditworthy
                portfolio                                                            tenant base                  Investment grade ratings with
                                                                                                                stable outlook (BBB (high) / Baa2)

       Alignment with unitholders                                         6.0 years of weighted average lease   9 consecutive annual distribution
                                                                                         term                              increases

                                                               Global Industrial Real Estate Platform
•   Market capitalization and enterprise value are as of July 30, 2021.                                                                       August 2021   3
•   Granite investment grade ratings are as per DBRS/Moody’s.
INVESTOR PRESENTATION | August 2020 - Granite REIT
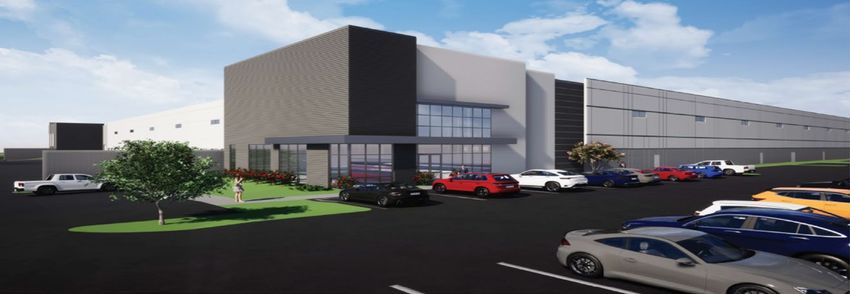
GRANITE HIGHLIGHTS – ESG+R
   ENVIRONMENTAL                        SOCIAL                     GOVERNANCE                      RESILIENCE
 Promote energy efficiency
                                 Promote employee well-        100% independent Board       Program aligned with Task
 and sustainable practices
                                         being                     excluding CEO            Force on Climate-Related
     at our properties
                                                                                               Financial Disclosures
                                                                                               (“TCFD”) framework
 Reduce use of resources and
  promote waste diversion       Financial support for gym      Experienced and diverse
                               memberships & public transit            board                   Assess physical and
                                                                                            transition climate-change
 Exceed required standards
                                                                                            risks in underwriting/due
   where feasible in our
                                                                                                 diligence process
      developments
                                Promote volunteerism and
                                   community support              Internally managed
   Promote use of public
                                                                                           Regular portfolio evaluation
  transit through financial
                                                                                           of climate-change risks and
           support
                                                                                            strategies to mitigate risks
                                 Employee engagement          Robust governance policies
 Encourage the use of local           monitoring                with CGN Committee
  and recycled materials                                              oversight
                                                                                           Work with property teams
                                                                                              to ensure mitigation
   Implement various            Provide a 24/7 support and    Whistle-blower hotline and    measures and emergency
  sustainability projects          counselling resource           reporting process        response plans are in place

                 Committed to enhancing Granite’s ESG+R program and reporting in 2021                                August 2021   4
INVESTOR PRESENTATION | August 2020 - Granite REIT
ESG - $500M GREEN BOND USE OF NET PROCEEDS (AS AT DEC 31, 20201)

   Property                                                                                   Eligible Green Certification        Date        Allocation

 3501 North Lancaster Hutchins Rd, Lancaster, TX, USA                                         LEED Silver Green Building          Mar 1/19            $106.1

 Oude Graaf 15, Weert, NED                                                                    BREEAM “Excellent” Green Building   May 1/20                  31.9

 1201 Allpoints Court, Plainfield, Indiana, USA                                               Two Green Globes Green Building     Jun 15/20                 31.6

 Francis Baconstraat 4, Ede, NED                                                              BREEAM “Very Good” Green Building Jul 1/20                    21.4

 De Kroonstraat 1 & De Poosthoornstraat 2, Tilburg, NED                                       BREEAM “Excellent” Green Building   Jul 1/202                 84.1

 Aquamarijnweg 2, Bleiswijk, NED                                                              BREEAM “Very Good” Green Building Sep 1/203                   66.2
                                                                                              > 15% improvement in energy
 Other LED lighting projects                                                                                                      Various                    1.3
                                                                                             efficiency
 Total Net Proceeds Allocated
                                                                                                                                                      $342.6
 % of Net Proceeds Allocated                                                                                                                                69%

           Granite has allocated $342.6M (69%) of Green Bond net proceeds to Eligible Green Investments
                                                                                                                                              August 2021     5
1Granite   has committed to providing annual updates on green bond allocation
2Expansion completed on December 18, 2020
3Initial acquisition made on March 13, 2020 and development completed on September 1, 2020
INVESTOR PRESENTATION | August 2020 - Granite REIT
GRANITE’S EVOLUTION
                                                                                  Investment Property Summary

                           Then - December 31, 2011                                                                                                        Now - June 30, 2021
                                                                                                                                              0.7M SF
                                                                                                                                            Flex/Office2
            13.8M SF                                                                                                                           $143M
          Multi-Purpose2                                                       14.1M SF
                                                                                                                               5.5M SF
             $802M                                                          Special Purpose                                                                                                      36.2M SF
                                                                                                                        Industrial/Warehouse2
                                                                               $1,089M                                                                                                  Distribution/E-commerce3
                                                                                                                                $813M

                                            $1.9B                                                                                8.9M SF
                                                                                                                                                                 $6.4B                           $4,298M

                                               Value                                                                          Special Purpose                    Value
                                                                                                                                 $1,054M

                                                                                                                  5 Properties Under Development
                                                                                                                  and 4 Land Held for Development
                                                                                                                                $89M

     27.9            94%              11%            $1.5B            $2.14               ∼$700M                          51.3            25%4         20%        $5.7B     $3.88             ∼$1.5B

      GLA          Magna %             Net          Market            FFOPU           Incremental Debt                     GLA           Magna %         Net      Market   LTM FFOPU      Incremental Debt
     (MSF)          of GLA          Leverage         Cap                               Capacity @ 35%                     (MSF)           of GLA      Leverage     Cap                     Capacity @ 35%
                                      Ratio                                                                                                             Ratio

                 Transforming the portfolio while creating value and maintaining financial flexibility
1Market  capitalization and enterprise value are as July 30, 2021.
2Multi-Purpose                                                                                                                                                                         August 2021   6
                 property type has been split and renamed into two new categories: Industrial/Warehouse and Flex/Office as of Q1 2021.
3 Modern warehouse has been renamed to Distribution/E-commerce as of Q1 2021.
4 Pro-forma the sale of Magna’s business operations in Obertshausen, Germany to Mutares SE & Co. KGaA.
INVESTOR PRESENTATION | August 2020 - Granite REIT
PORTFOLIO TRANSFORMATION STRATEGY

                                                                                Invest selectively/opportunistically in
    Target markets with superior         Focus on modern facilities that meet   evolving property types and markets
  economic conditions and market          the demands of E-Commerce and             benefiting from technological
           fundamentals                      traditional distribution users      advancement & E-Commerce trends

        Proximity to major MSAs                 Modern characteristics
                                                                                             Cold Storage
                                                                                           (Food & Pharma)
            Available labour
                                              Lower capex requirements

           Strategic location
                                               Potential for expansion or                     Multi-level
                                                   redevelopment                              fulfillment
          Population growth
                                            Strategic location within market
               Liquidity
                                                                                           Transport facilities
                                                   Captive tenancy
          Major infrastructure

                Focusing on characteristics that meet current and evolving user demand                            August 2021   7
INVESTOR PRESENTATION | August 2020 - Granite REIT
FINANCIAL PERFORMANCE
                                  Historical Operating Performance ($M)                                                                                            Distributions and Payout Ratios

                                                                                                                                                                                                          91%
                                                                                                                            $371
                                                                                                                                                                                    82%                           81%

                                                                                                          $340                                                                                                                                    78%
                                                                                                                                                                                                                                     77%
                                                                                                                                                                      71%

                                                                                                                                   $289                                                                                                           74%
                                                                                                                                                                                                          78%     79%                73%
                                                                                          $274                                                                                           78%                                               3.00
                                                                                                                 $265
                                                                                                                                                                           71%                                                2.90
                                                        $245            $248
                                                                                                                                                68%                                                             2.80
                                                                                                                                                             68%                                   2.72
                                                                                                                                      $228
                                        $223
    $214           $216                                                                                             $216                                                          2.60
                                                                                                 $204
                                               $188            $185            $187                                                                                 2.43
           $183           $181
                                                                                                   $173                                               2.30
                                 $158            $162
            $154                                                                                                                             2.21
                                                                 $145
                                                                                 $138

      2014           2015                 2016             2017           2018               2019           2020           LTM Q2 2021       2014     2015         2016           2017            2018          2019         2020          2021

                                                 Revenue        Adj. EBITDA           Adj. FFO                                                           Distributions per Unit                FFO Payout %             AFFO Payout %

                   Consistent annual revenue and FFO growth. Distribution increase of 3.4% made for 2021.
•   Adjusted FFO and FFO payout ratio may exclude items that can be a source of variance between periods. See Granite’s MD&A in the 2021 Second Quarter Report.                                                               August 2021          8
•   2019 Distributions excludes the special distribution paid in January 2019 of $1.20 per unit.
INVESTOR PRESENTATION | August 2020 - Granite REIT
GRT HISTORICAL PERFORMANCE
                                                        Total Return vs TSX Composite & TSX Capped REIT Indices
                                  Cumulative Total Return %                                                       Annualized Total Return %
                                                                               COVID-19

    320%                                                                                         180%

    295%
                                                                                                 160%
    270%
    245%                                                                                         140%

    220%
                                                                                                 120%
    195%
    170%                                                                                         100%

    145%
                                                                                                 80%
    120%
    95%                                                                                          60%

    70%
                                                                                                 40%
    45%
    20%                                                                                          20%
     -5%
                                                                                                  0%
                                                                                                        1Yr              2Yr                   3Yr                   5Yr

                  Granite REIT              TSX Capped REIT Index          TSX Composite Index          Granite REIT   TSX Capped REIT Index         TSX Composite Index

                      Granite has steadily outperformed the TSX and Capped REIT Total Return indices                                                            August 2021   9
•   Total return data sourced from Bloomberg and is as at June 30, 2021.
GLOBALLY DIVERSIFIED PORTFOLIO

                              7 countries – 118 properties – 51.3 million square feet

                                                                                                                POLAND
                                                                                                              2 properties
                                                                                         GERMANY                0.3M SF
                                                                                        11 properties
                                                                                           3.5M SF
                            CANADA
                          30 properties
                            5.9M SF

                                                                      NETHERLANDS            1
                                                                      12 properties
                                           2                             3.8M SF
                                                                                                        4

             UNITED STATES
              52 properties                                                                                    CZECH
                29.6M SF                                                                                     REPUBLIC
                                                                                          AUSTRIA            1 property
                                                                                        10 properties         0.3M SF
                                                                                           7.9M SF
                                                    Special Purpose
                                                    Properties

             Global footprint with scale in North America & Western Europe                                  August 2021      10
PORTFOLIO SEGMENTATION BY GEOGRAPHY
         By Income Producing Property Fair Value                                             By Annualized Revenue

                                                                                    $54.3M                                 $53.3M
         $1,028M                                                                                               16%
                         16%                                                                      16%
                                      20%       $1,285M

                                                                                                   $330M
                   12%
     $762M                $6.3B                                                  $61.9M
                                                                                          19%

                                                 $3,234M                                                                     $160.1M
                                                                                                               49%
                                51%

                           By Square Feet                                          By Number of Income-Producing Properties

             7.9                   11%          5.9
                          15%                                                        24           22%                         30
                                                                                                                     27%

                   15%
                           51.3M                                                   10
                                                                                             9%         110
       7.9
                                                  29.6
                                      58%                                                                                      46
                                                                                                         42%

                                         Geographically diversified asset base                                                  August 2021   11
PORTFOLIO SEGMENTATION BY CATEGORY
                               Income-Producing Properties by Value Segmented by Category
Distribution/E-commerce Properties                                                             Industrial/Warehouse
67 Properties                                                                                  32 Properties
36.2 M SF (∼541K SF/property)                                                                  5.5 M SF (∼172K SF/property)
$4.3 B Fair Value (∼$119/SF)                                                                   $0.8 B Fair Value(∼$148/SF)
                                                                                               WALT: 4.5 years
WALT: 6.6 years
$204.1 M Annualized Revenue(∼$5.64/SF): 62%                   68%                              $42.4M Annualized Revenue(∼$7.69/SF): 13%
Magna Concentration: 1%                                                                        Magna Concentration: 81%
Concentration in the GTA (rev): 6%                                                             Concentration in the GTA (rev): 50%
                                                                                               Clear Height: 29’
Clear Height: 34’
                                                                                               Average Age: 25Yrs
Average Age: 11 Yrs
Overall Cap Rate: 4.54%                                             $6.3B                      Overall Cap Rate: 5.15%

                                                                                       13%     Special Purpose Properties
Flex/Office                                                                                    7 Properties (2 GTA, 1 Germany, 4 Austria)
4 Properties                                                                                   8.9 M SF (∼1,268K SF/property)
0.7 M SF (∼170K SF/property)                                                                   $1.0 B Fair Value (∼$119/SF)
$0.1 B Fair Value (∼$209/SF)                                                                   WALT: 4.4 years
WALT: 6.8 years                                                     2%       17%
                                                                                               $74.6 M Annualized Revenue(∼$8.40/SF): 23%
$8.6M Annualized Revenue (∼$12.70/SF): 3%                                                      Magna Concentration: 100%
Magna Concentration: 37%                                                                       Concentration in the GTA (rev): 21%
Concentration in the GTA (rev): 49%                                                            Clear Height: 34’
Clear Height: 25’                                                                              Average Age: 37 Yrs
Average Age: 21Yrs                                                                             Overall Cap Rate: 7.25%
Overall Cap Rate: 5.63%                                                                        Cap Rate in Canada: 4.69%
                                                                                               Cap Rate in Europe: 8.47%

                                 Total Fair Value of $6.3B with an overall WALT of 6.0 years                                 August 2021    12
DEVELOPMENT AND EXPANSION PIPELINE

           Altbach, Germany ~0.3M SF                                  Fort Worth, Texas ~0.6M SF

     Mississauga, Ontario (expansion) ~0.1M SF                          Houston, Texas ~0.7M SF

             Active development program to enhance total return & platform value                   August 2021   13
LEASE EXPIRATION PROFILE
                                                            Outstanding Lease Expiries by Annualized Revenue
Annualized                                                           Overall
 Revenue                                   $329.7M                   WALT               6.0 Years                 Occupancy          99.3%
                                     100                                                                                               43.8%
                                                   Canada      USA        Austria        Europe
                                      90
                                      80
          Annualized Revenue (C$M)

                                      70
                                      60
                                                                                             18.4%
                                      50
                                      40
                                                            9.0%                12.8%
                                      30
                                                                                                           7.4%               8.5%
                                      20
                                            0.2%
                                      10
                                       0
                                           2021              2022              2023           2024         2025               2026       2027+
  % of Annualized Rev.                      0.2%             9.0%              12.8%         18.4%         7.4%               8.5%       43.8%

                             % of GLA       0.2%             9.0%              15.0%         18.5%         7.0%               8.9%       40.6%

                 # of Leases                 0                12                24            16           12                  19         49

                                                  Staggered and geographically diversified lease maturity profile
                                                                                                                                         August 2021   14
HIGH QUALITY & CREDITWORTHY TENANT BASE
                                                                                                                                                                Other Tenants
                                                                                     Annualized                                                      Credit
             Top 10 Tenants                                                                                    GLA %               WALT
                                                                                     Revenue %                                                      Rating1,2

             Magna                                                                        34%                   25%3                 4.3                  A-

             Amazon                                                                        6%                     5%                17.7                  AA
             True Value Company                                                            3%                     3%                19.7                  NR
             ADESA                                                                         2%                    —%                  8.1                  NR

             Restoration Hardware                                                          2%                     2%                 6.8                  NR

             Hanon                                                                         2%                     1%                 8.2                  BBB

             Spreetail FTP                                                                 2%                     2%                 5.3                  NR
             Ingram Micro                                                                  2%                     2%                 3.5                  BB-

             Wayfair                                                                       2%                     2%                 4.3                  NR

             Cornerstone Brands                                                            2%                     2%                 3.3                  B+
             Top 10 Tenants                                                               57%                    45%                 6.8

                           Creditworthy non-Magna tenants each comprising less than 10% of Revenue and GLA
1   Credit rating is quoted on the S&P or equivalent rating scale where publicly available. NR refers to Not Rated.                                                       August 2021   15
2   The credit rating indicated may, in some instances, apply to an affiliated company of Granite’s tenant which may not be the guarantor of the lease.
3   Pro-forma the sale of Magna’s business operations in Obertshausen, Germany to Mutares SE & Co. KGaA.
BALANCE SHEET STRENGTH
                                         Capitalization                                                                            Debt Maturity Profile
            Unit Price (07/30/2021)                                                $86.38
            Units Outstanding                                                        65.7            $1,200                                  Weighted average debt term-to-maturity – 5.7 years
                                                                                                                     998
            Market Capitalization                                                  $5,674                                                    Weighted average cost of debt – 1.74%
                                                                                                     $1,000
                                                                                                      $800
            Credit Facility                                                            $0
            Debentures 3.873% due Nov/23                                            $400              $600                                                                                500               500

                                                                                             (C$M)
                                                                                                                                       400
            US$185M Term Loan due Dec/24                                            $229              $400                                                               300
                                                                                                                                                        229
            C$300M Term Loan due Dec/26                                             $300
                                                                                                      $200
            Debentures 3.062% due Jun/27                                            $500
            Debentures 2.378% due Dec/30                                            $500                $0
            Total Unsecured Debt                                                   $1,929                           2021             2023              2024             2026             2027              2030
                                                                                                              Available Liquidity under credit facility which matures in March 2026
                                                                                                              $400M Debentures 3.873% due Nov/23 swapped into Euros with an effective interest rate of 2.43%
            Less: Cash and Cash Equivalents                                           $678                    US$185M Term Loan LIBOR+ due Dec/24 swapped into Euros with an effective interest rate of 0.272%
                                                                                                              $300M Term Loan BA+ due Dec/26 swapped into Euros with an effective interest rate of 1.105%
            Add: Non-controlling Interests                                             $2                     $500M Debentures 3.062% due Jun/27 swapped into USD with effective interest rate of 2.964%
                                                                                                              $500M Debentures 2.378% due Dec/30 swapped into Euros with effective interest rate of 1.045%
            Enterprise Value                                                       $6,927

                                     Available Liquidity                                                                              Available Liquidity
                                                                                                LTM Adj. EBITDA / LTM Interest                                                                             6.0x
                                                                                                Net Debt / LTM Adj. EBITDA                                                                                 4.4x
            Cash and Cash Equivalents                                               $678        LTM FFO / Net Debt                                                                                         19%
            Credit Facility Available                                               $998        Net Debt / Fair Value of Investment Properties                                                             20%
            Total Available Liquidity                                              $1,676       Net Debt / Enterprise Value                                                                                18%
                                                                                                Unencumbered Assets / Unsecured Net Debt                                                                   5.1x
                                                                                                Secured Debt / Fair Value of Investment Properties                                                         0%
                                                                                                Incremental Net Debt Capacity at 35% Net Leverage Ratio                                                  $1.5B
                      Sector leading balance sheet with significant liquidity and fully unencumbered assets
•   Market capitalization and enterprise value are as at July 30, 2021.
                                                                                                                                                                                                  August 2021     16
•   Total Unsecured Debt excludes swap mark-to-market liabilities and lease obligations.
CREDIT METRICS SUMMARY
•       The following table was sourced from DBRS’ North American Real Estate Peer Comparison dated April 2021.

     DBRS North American Real Estate Peer Comparison1:
                                                                                                                                                 Peer Group                                   Granite Rank
                                                                                                Granite2
                                                                                                                                                    Average                               Among Peer Group

    Total Debt to Capital                                                                          33.0%                                                  49.2%                                                       #3

    Total Debt to EBITDA                                                                               7.5x                                                  9.7x                                                     #4

    Cash Flow to Total Debt                                                                            0.1x                                                  0.1x                                                     #2

    Debt Service Coverage                                                                              7.5x                                                  2.6x                                                     #1

    EBITDA Interest Coverage                                                                           7.6x                                                  3.2x                                                     #1

    Distributions to FFO3                                                                          72.2%                                                  81.8%                                                       #7

                           Granite’s balance sheet & access to Euro-denominated debt offers a competitive advantage
1 Source: DBRS North American Real Estate Peer Comparison for 17 issuers as of April 2021. Credit metrics for each issuer are as of the dates indicated in the report (December 31, 2020 for Granite). Certain terms used,
  such as EBITDA and FFO, do not have standardized meanings under IFRS and as such may not be comparable between the North American Real Estate Peer issuers used in the study.
2 Granite’s debt as at December 31, 2020 included the 2021 Debentures that were refinanced on December 18, 2020 and subsequently redeemed on January 4, 2021. All December 31, 2020 debt ratios have been adjusted
  on a pro-forma basis to reflect the redemption of the 2021 Debentures for peer comparison purposes.                                                                                                      August 2021     17
3 Peer Group Average excludes Morguard Corporation.
FINANCIAL FLEXIBILITY & TARGET LONG-TERM LEVERAGE RATIO
• Strong balance sheet provides pathway for measured growth with potential for further diversification and optimization of the portfolio
• Target long term net leverage ratio of ∼30 - 35% while maintaining patient and opportunistic approach to acquisitions and development
• Long term leverage target fully reflected in current credit ratings from Moody’s and DBRS

                                                                Rating Agency Commentary
          Incremental Net Debt Capacity                         Moody’s 03/12/2021: Baa2 (Stable)
                                                                “Granite’s Baa2 senior unsecured rating reflects its commitment to maintaining a conservative capital
                                                                structure, with moderate long-term target leverage of debt/total assets under 35% and a fully
                                 Incremental Debt               unencumbered asset base, as the REIT executes its strategic growth plan and portfolio transformation.
   Net Leverage Ratio
                                   Capital ($ M)                The ratings are further supported by Granite's good liquidity and long-term net-lease contracts with
                                                                minimal rollover that result in stable earnings year over year. It also incorporates the REIT’s success in
                                                                transforming its portfolio over the past few years, effectively improving its asset quality and long-term
      20% (current)                       N/A                   growth profile.”

                                                                DBRS Morningstar 03/22/2021: BBB(high) (Stable)
                                                                “DBRS Morningstar has revised upward its assessment of Granite's asset quality and market position.
            25%                          $455                   These revisions are supported by Granite completing approximately $2.0 billion in acquisitions over the
                                                                last two years, with such acquisitions consisting of modern distribution assets located in key distribution
                                                                markets in Canada, the Netherlands, and the U.S., while continuing to dispose of noncore special-purpose
            30%                          $944                   properties. Furthermore, the Trust collected 100% of its rent during the pandemic while improving
                                                                occupancy and generating robust same property net operating income growth (SPNOI), therefore
                                                                demonstrating the resilience of Granite's assets, tenants, and cash flows. The Stable trends consider DBRS
            35%                         $1,509                  Morningstar's expectations that industrial real estate fundamentals will remain supportive in the near to
                                                                medium term and that Granite will continue to execute its long-term strategy of growing and diversifying
                                                                its asset base through acquisitions and developments as well as funding such growth initiatives with cash
                                                                on hand, incremental debt, and equity, similar to recent years.”

   Commitment to maintaining a sustainable investment grade rating and conservative capital structure                                              August 2021    18
CANADIAN REAL ESTATE DEBT COMPARISON1
                                        Total Debt-to-Capital                                                                                               Total Debt-to-EBITDA
    90%                                                                                                                 19.0x

    80%                                                                                                                 17.0x

    70%                                                                                                                 15.0x

                                                                                                                        13.0x
    60%
                                                                                                                        11.0x
    50%
                                                                                                                          9.0x
    40%
                                                                                                                          7.0x
    30%
                                                                                                                          5.0x

    20%
                                                                                                                          3.0x

    10%                                                                                                                   1.0x

                                   Granite has the lowest leverage within DBRS1 universe of Canadian Real Estate entities
1   Source: DBRS North American Real Estate Peer Comparison for 17 issuers as of April 2021. Credit metrics for each issuer are as of the dates indicated in the report (December 31, 2020 for Granite). Certain terms used,
                                                                                                                                                                                                                   August 2021   19
    such as EBITDA and FFO, do not have standardized meanings under IFRS and as such may not be comparable between the North American Real Estate Peer issuers used in the study.
2   Granite’s debt at December 31, 2020 included the 2021 Debentures that were refinanced on December 18, 2020 and subsequently redeemed on January 4, 2021. All December 31, 2020 debt ratios have been adjusted on
    a pro-forma basis to reflect the redemption of the 2021 Debentures for peer comparison purposes.
CANADIAN REAL ESTATE DEBT COMPARISON1
                                  EBITDA Interest Coverage                                                                             Distributions/Cash Flow from Operations2
    8.0x
                                                                                                                        1.40
    7.0x
                                                                                                                        1.20
    6.0x
                                                                                                                        1.00
    5.0x
                                                                                                                        0.80
    4.0x

                                                                                                                        0.60
    3.0x

    2.0x                                                                                                                0.40

    1.0x                                                                                                                0.20

    0.0x                                                                                                                0.00

                   Granite has leading cash flow coverage metrics among DBRS1 universe of Canadian Real Estate entities
1 Source: DBRS North American Real Estate Peer Comparison April 2021. Credit metrics for each issuer are as of the dates indicated in the report (December 31, 2020 for Granite). Certain terms used,   August 2021   20
  such as EBITDA and FFO, do not have standardized meanings under IFRS and as such may not be comparable between the North American Real Estate Peer issuers used in the study.
2 Peer Group Average excludes Morguard Corporation.
LEADERSHIP TEAM

          Kevan Gorrie                                             Teresa Neto
            • President and Chief Executive Officer                  • Chief Financial Officer
            • Over 20 years of real estate experience in Canada,     • Over 30 years of varied business experience,
              the United States and Germany.                           including ∼10 years as a CFO for publicly-traded
            • Previously served as the President and Chief             real estate investment trusts in Canada.
              Executive Officer of PIRET, where he led the           • Previously served as the CFO of Pure Industrial
              business until its strategic sale to Blackstone          Real Estate Trust and prior to that at Northwest
              Property Partners and Ivanhoé Cambridge in May           Healthcare Properties REIT.
              2018.

          Lorne Kumer
            • Executive Vice President, Head of Global Real        Michael Ramparas
              Estate                                                • Executive Vice President, Global Real Estate and
            • Over 25 years of experience in the real estate          Head of Investments
              industry working for both public and private          • Over 18 years of broad work experience with a
              development companies                                   focus on real estate, equity investments, and
            • Experience includes acquisitions, due diligence,        corporate underwriting.
              leasing, land use and development approvals,          • Previously held senior positions at Fortress
              sales and construction                                  Investment Group and Hexagon Capital Partners

          Witsard Schaper
           • Senior Vice President, Head of Europe based in        Jon Sorg
             Amsterdam                                               • Senior Vice President, Head of U.S. based in Dallas
           • Over 20 years of extensive real estate investment       • 20 years of investment, operations, underwriting
             experience in international private and public real       and valuations experience in a variety of markets
             estate transactions across Europe                         across the central US
           • Prior to joining Granite, Mr. Schaper was a             • Prior to joining Granite, Mr. Sorg spent 12 years at
             Director at CPPIB in London responsible for the           Prologis, where most recently he served as Senior
                                                                                                       August 2021
                                                                       Vice President, Capital Deployment            21
             investment program in Europe
You can also read