Investment Banking and Capital Markets Sector - Financial Services Group WINTER 2022 - Houlihan ...
←
→
Page content transcription
If your browser does not render page correctly, please read the page content below

Financial Services Group
Investment Banking and Capital Markets Sector
U . S . M A R K E T U P D AT E

WINTER 2022
Review and Outlook:
U.S. Investment Banking and Capital Markets Sector
       Introduction   With best wishes for 2022, Houlihan Lokey’s Financial Services Group welcomes you to a new installment of this semiannual
                      report on the U.S. investment banking and capital markets sector.

                      When we published our previous report in summer 2021, the market was at the crest of a broad-based upswing as the
                      economy moved past the depths of the pandemic. While growth continues in certain pockets, and 2021 fee pools will look
                      strong on a year-over-year basis, many areas of the market are trending toward a more “normalized” 2022 outlook.

     M&A Advisory     The overall M&A environment was exceptionally active in a “risk-on” 2021, with favorable macro dynamics encouraging
                      consolidation for both acquirers and targets. However, mega-cap strategic deals trailed off over the course of the year; the
                      number of announced $5+ billion acquisitions declined in every consecutive quarter of 2021. Buyers may be focusing on
                      integration after their transformative acquisitions, while heightened antitrust scrutiny (e.g., Aon/Willis Towers Watson;
                      NVIDIA/Arm) has introduced new risk to strategic M&A. On the other hand, private equity moved upmarket, with the $30+
                      billion club buyout of Medline representing a post-2008 financial crisis high-water mark. The middle market also accelerated
                      throughout the year, as founders eyed potential 2022 capital gains tax hikes, while capitalizing on rebounding post-pandemic
                      financial performance. A continued fee pool shift in favor of the middle market may entice more players traditionally focused
                      upmarket to invest in dedicated coverage groups; Goldman Sachs and Guggenheim reportedly launched major initiatives.

                      While ECM underwriting fees ended 2021 up moderately vs. 2020, the market was truly a story of two halves. Each of the
  ECM Underwriting    core post-COVID-19 ECM drivers—small-cap biotech, SPACs, software, and Chinese cross-border listings—hit its own
                      unique headwind. Equities trading similarly reverted to more normalized levels, after lucrative retail volume shifted from
                      meme stocks in Q1 to crypto by summer and NFTs by fall.

                      On the industry consolidation front, commercial banks continue aggressively adding M&A and fixed income capabilities,
    PE Involvement    though we’d like to highlight the recent proliferation of less traditional acquisitions. PE investors are constant users of
                      investment banking services but rarely acquire investment banks themselves. However, Audax announced its acquisition of
                      Stout in October, and Atlas Merchant Capital made a growth equity investment in MarshBerry several weeks ago. Given the
                      fierce battle for attractive assets in a heated M&A market, we expect further PE activity in the financial advisory space,
                      particularly targets like Stout and MarshBerry that have scale, a well-diversified revenue origination process, and an element
                      of nontransactional revenue.

                      Some expected $0 retail equity commissions would become the death knell for brokers, but 2021 proved that public markets
    Brokerage IPOs    are extremely receptive to new listings. Incumbents and upstarts—including TradeZero, TradeStation, Robinhood, and
                      eToro—announced IPOs through SPACs and regular-way offerings this year. With scale at a premium in a fragmented, low-
                      margin market, newly public brokers will likely use M&A to accumulate accounts, enhance crypto offerings, and add
                      specialized solutions for lucrative day traders.

                                                                                                                                                       2
Review and Outlook:
U.S. Investment Banking and Capital Markets Sector (cont.)
Institutional Equities   Even the institutional equities space, which has been relatively quiet for several years, joined the 2H 2021 dealmaking
                         bonanza. Notably, Citizens Financial acquired JMP Group as the latest step in its aggressive investment banking expansion,
                         and Kazakhstan’s Freedom Holdings acquired MKM as a beachhead in the United States. SVB Financial and Piper Sandler
                         each acquired independent equity research boutiques in Q4, showing that the value of differentiated, independent research
                         can endure in the face of MiFID II upheaval.

 Crypto Dealmaking       While this report focuses on securities, we would be remiss if we didn’t touch on crypto, which reached $3 trillion in
                         aggregate market cap this past fall as the locus of demand continues shifting from enthusiast retail to mass retail to
                         institutional. As institutional investors increasingly view crypto as a critical element of a diversified portfolio, especially in a
                         newly inflationary environment, they will increasingly demand the institutional-grade reporting, clearing, hedging, financing,
                         and execution they rely on in traditional securities markets. Ironically, the infrastructure build-out that will enable the
                         maturation of crypto marketplaces and DeFi applications will heavily leverage these same traditional securities markets.
                         Players that recently raised mega-VC rounds like FTX and BlockFi have publicly discussed potential 2022 IPOs, and a wave
                         of M&A commonly follows a wave of IPOs. Indeed, 2021’s crypto IPO trailblazer Coinbase announced its first acquisition as
                         a public company in January 2022, acquiring FairX to launch a derivatives offering.

                         We hope you’ve been able to enjoy a restful holiday season with family and friends after an incredibly busy 2021, and we
                         welcome the opportunity to discuss trends and strategies with you in the year ahead.

                                                                                  Warmest Regards,

           Our Team                                            Financial Services Group
                                                  Investment Banking and Capital Markets Coverage Team

                              Gagan Sawhney                      Chris Pedone                     Matt Capozzi                     Jeff Nassof
                              Managing Director                    Director                       Vice President                  Vice President
                                  212.830.6165                     212.830.6166                    212.830.6193                     212.830.6170

                               GSawhney@HL.com                  CPedone@HL.com                  MCapozzi@HL.com                   JNassof@HL.com

                                                                                                                                                                3
M&A Advisory Market Review:
Banner Year for M&A Drives Fees +42% to New Record
Though megadeals above $5B in value decelerated somewhat from 1H 2021’s torrid pace, growth continued across virtually all segments of the M&A market throughout 2021, spurred
by post-pandemic optimism, elevated corporate earnings, record stock prices, inexpensive debt financing, potential capital gains tax hikes, and an influx of SPAC capital seeking targets.
The $34B acquisition of Medline by a PE consortium was the largest LBO since the 2008 crisis; in a more hostile antitrust setting, PE may gain an edge vs. strategics on megadeals.
Fees from the industrials sector—a relative underperformer in 2020—nearly doubled in 2021, led by transportation/infrastructure deals (e.g., Kansas City Southern, First Transit) and an
explosion of electric/autonomous vehicle SPAC mergers (e.g., Lucid, Aurora, Joby).
The consumer and retail and natural resources sectors, saddled with significant lingering uncertainly coming out of COVID-19, were the only sectors with declining fee pools.
M&A Advisory Fee Pools ($ billions) Rolling Y/Y Fee Pool Growth
100%
$39.4B
75%
$25.3B $27.8B 50%
$22.0B $23.7B
$20.7B
25% Overall fee pool is
up +42% vs. same
time last year
0%
-25%
'16 '17 '18 '19 '20 '21 '19 '20 '21
Sector Breakdown Deal Size Breakdown Growth by Sector Growth by Deal Size
Industrials 90% Below $0.5B 17%
17% RE and Gaming 73% $0.5B to $2B 75%
28%
40% Financials 64% $2B to $5B 85%
43% 2021: 2021:
19% Technology 56% Above $5B 40%
$39.4B $39.4B
Services 48%
15%
Media and Telecom 43%
14% 24%
Healthcare 34%
Cons. and Retail -4%
Technology Industrials Below $0.5B $0.5B to $2B Natural Resources -11%
Healthcare All Others $2B to $5B Above $5B All Sectors 42% All Deal Sizes 42%
Source: Refinitiv.
Note: Based on announcement date and includes potential fees from pending transactions. 4ECM Underwriting Market Review:
What Next After Two Years of Unprecedented ECM Activity?
The 2021 ECM underwriting fee pool stands at ~2.5x pre-pandemic levels. However, the market is clouded by major question marks entering 2022.
SPAC IPOs recovered modestly from midyear doldrums, but the number of deals and the average deal size in Q4 are each roughly half the Q1 level, resulting in a fee pool roughly one-
quarter as large. With the SEC taking action against Stable Road in July and probing enhanced disclosure requirements, today’s more conservative environment should continue into 2022.
Healthcare/biotech is typically the largest ECM segment (and particularly critical for small-cap investment banks) but lost momentum after a COVID-19-driven surge of demand in 2020.
Unlike SPACs and healthcare, the tech fee pool expanded throughout 2021, but a December sell-off led by inflation fears may create a challenging backdrop for new issues in 2022.
Regulatory pressure slammed the market shut for Chinese listings in the U.S.; these deals generated $600+ million in fees in 1H 2021, compared to just ~$40 million in 2H.
ECM Underwriting Fee Pools ($ billions) Rolling Y/Y Fee Pool Growth
200%
$20.1B
150%
$16.9B
100%
$8.2B $8.7B $8.4B 50%
$5.7B
0%
Overall fee pool is up +19%
vs. same time last year
-50%
'16 '17 '18 '19 '20 '21 '19 '20 '21
Sector Breakdown Structure Breakdown Growth by Sector Growth by Structure
Funds 68% IPO $250M 51%
31%
22% REIT/MLP 29% Flw-On $250M -12%
$20.1B $20.1B
26% SPAC 14% Convertible -12%
2% 42%
13% Healthcare -18%
5% 16%
All Sectors 19% All Deal Sizes 19%
Healthcare Technology IPO $250M
SPAC REIT/MLP Flw-On $250M
Funds Other Convertible
Source: Refinitiv.
Note: Deferred fees on SPAC IPOs fully recognized on IPO date. 5Debt Financing Market Review:
Leveraged Finance Heats Up as Bond Boom Fades
A record $1+ trillion in PE spending in 2021, paired with record CLO issuance (new quarterly records set in Q1, Q2, and Q3 2021) created a perfect leveraged finance supply/demand storm.
The supportive market led to further loosening of terms; a record 33% of loans originated in 2021 had a leverage ratio above 6x EBITDA. However, the reappointment of Janet Yellen as
Fed Chair could potentially cast the regulatory spotlight on highly leveraged loans again, as Yellen oversaw the promulgation of the original leveraged lending guidance in 2013.
Regulatory pressure on bank lending would provide a further boost to the “shadow banking” ecosystem of BDCs, credit funds, and non-BHC investment banks. Already growing quickly,
these direct lenders have captured the attention of acquirers looking to add a platform (e.g., CIFC/LBC), or to scale up to lower funding costs (e.g., Barings BDC/Sierra Income).
On the other hand, investment-grade corporate and agency bond issuance has paused, as rising rates narrow the window of opportunity for institutional and retail borrowers to refinance.
Bond and Synd. Loan Origination Fee Pools ($ billions) Rolling Y/Y Fee Pool Growth
40%
$28.8B $30.1B
30%
$21.2B $22.7B $21.0B $22.4B
20%
10%
0%
Overall fee pool is up +4%
vs. same time last year
-10%
'16 '17 '18 '19 '20 '21 '19 '20 '21
Bond Breakdown Loan Breakdown Bonds by Segment Loans by Segment
Inv. Grade Corp. -31% Leveraged 32%
6%
High-Yield Corp. 5% Nonleveraged 37%
16% 30%
41% Structured Credit 52%
2021: 2021:
Agency -33% PE-Sponsored 64%
$16.1B $14.0B
Nonsponsored 17%
70%
37%
Acquisition-Related 60%
Refi / Other 21%
Inv. Grade Corp. High-Yield Corp.
Leveraged Nonleveraged
Structured Credit Agency
All Bonds -12% All Synd. Loans 33%
Sources: Refinitiv, S&P Global.
Note: Loan fees only include upfront arrangement fees on broadly syndicated loans; excludes directly placed loans, project finance, tax-free munis. 6Securities Trading Market Review:
As Market Settles Post-Q1, Brokers Pursue Deals of Their Own
While equities volumes ticked up in Q4 due to renewed volatility in growth stocks, volumes stayed well below Q1 levels as retail traders shifted from stocks to crypto and NFTs.
However, the market’s growing awareness of the active trading opportunity led to a surge in retail brokerage IPO announcements, including TradeStation, TradeZero, eToro, and Robinhood.
On the institutional side, many questioned the viability of sellside research in a world driven by index funds and algorithmic execution. However, the value of independent, differentiated
research was validated in acquisitions of Zelman, Cornerstone Macro, MoffettNathanson, JMP, and MKM within the last several months.
Like equities, fixed income volumes experienced a Q4 bump from mid-2021 levels; interest rate volatility spiked trading in treasuries to post-March-2020 heights. On the other hand,
more lucrative corporate bond trades trended downward in 2H, with the new issue downturn spilling over to trading volumes.
Equities Monthly ADTV (share volume in billions) Fixed Income Monthly ADTV ($ volume in trillions)
20B $1.2T
ADTV in November down $1.0T
15B -28% vs. TTM peak in $0.8T
Jan. '21 ADTV in November down
10B $0.6T -5% vs. TTM peak in
$0.4T Feb. '21
5B
$0.2T
0 $0
Q4 Q1 Q2 Q3 Q4 Q4 Q1 Q2 Q3 Q4
'20 '21 '21 '21 '21 '20 '21 '21 '21 '21
ADTV by Venue Average Trade Cost ADTV by Product Current vs. TTM Peak
4% Treasuries 17%
18% 2.9
Agency MBS -19%
24%
Corporates -11%
43% Nov. ‘21 Sep. ‘21 Nov. ‘21
11.1B shs 16% 34.4bps $1,031B Munis 8%
Private MBS -14%
71%
23% 31.5 Federal Agency Secs -32%
ABS -13%
NYSE/Arca Nasdaq Commission Treasuries Agency MBS All Fixed Income -5%
Other Exchanges Off Exchange Implementation Shortfall Corporates Other
Sources: Virtu, SIFMA. 7Houlihan Lokey Coverage and Capabilities
Recent Houlihan Lokey Capital Markets Sector Transactions
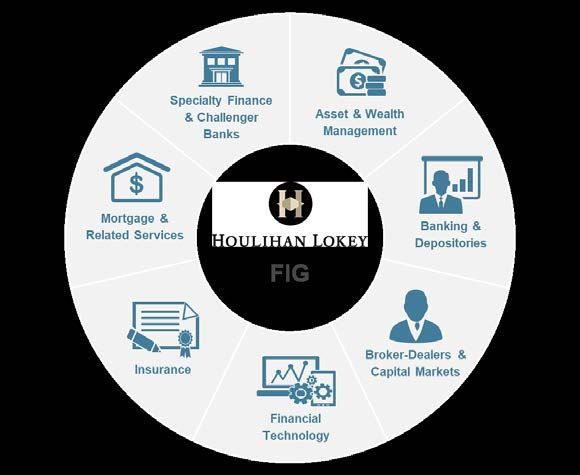
Houlihan Lokey Financial Services Group
Asset and Wealth Banking and Capital Financial Mortgage and Spec. Finance and
Insurance
Management Depositories Markets Technology Related Services Challenger Banks
With the legacy Freeman & Co. team, Houlihan Lokey is the most active advisor in the space, with 20+ deals closed since 2019.
Unmatched reputation as the “banker’s banker” on transactions in the investment banking/financial advisory sector.
The professionals involved in every broker-dealer/capital markets transaction executed by Freeman & Co. are still leading Houlihan Lokey’s
coverage today—an unprecedented 25+ years of continuity.
Five Deals Announced Since December 2021
Transaction Pending Transaction Pending
has been acquired by
has received a growth capital Minneapolis Grain Exchange
investment from has acquired has agreed to be acquired by
has agreed to acquire has been acquired by
has been acquired by
a portfolio company of
Buyside Advisor Sellside Advisor Buyside Advisor Sellside Advisor Sellside Advisor Sellside Advisor Financial Advisor
Multi-Sector Fund Placement Insurance & Wealth Technology Institutional Equities Trading Healthcare
Exchanges
Advisory Advisory Mgmt. Advisory Advisory Equities and TCA Advisory
a portfolio company of
has been acquired by and its wholly-owned subsidiary has been acquired by
has been acquired by has acquired
has been acquired by has been acquired by
has received a minority investment
from
the parent company of have been acquired by
Undisclosed Investor Group
Sellside Advisor Sellside Advisor Sellside Advisor* Sellside Advisor* Sellside Advisor* Buyside Advisor* Sellside Advisor* Sellside Advisor*
Chemicals Private Securities Aerospace and Clearing and Mini- Fund Placement Full-Service Financial FX Liquidity Technology
Advisory Marketplace Defense Advisory Prime Advisory Services Inv. Bank Platform Advisory
*Selected transactions were executed by Houlihan Lokey professionals while at other firms acquired by Houlihan Lokey. 9Case Study: FocalPoint
Houlihan Lokey Advises FocalPoint on Its
Sale to B. Riley Financial
On January 18, 2022, FocalPoint, a leading independent investment bank based in Los
Angeles, agreed to be acquired by B. Riley Financial (NASDAQ:RILY) (B. Riley) for total
consideration of up to $175 million.
Founded in 2002, FocalPoint specializes in M&A, private capital advisory, financial
restructuring, and special-situation transactions. The firm includes approximately 50
investment banking professionals with deep industry specialization in high-growth sectors.
The transaction, which will create revenue synergies for both companies, comes as
FocalPoint is experiencing significant momentum with $17 billion in closed transactions
spanning a successful 20-year history.
B. Riley provides collaborative capital-raising and business advisory solutions spanning
investment banking and institutional brokerage, private wealth and investment management,
financial consulting, corporate restructuring, and more.
The combination is expected to more than quadruple B. Riley’s pro forma M&A advisory
business, while enhancing its debt capital markets and financial restructuring capabilities.
Further, the combination builds on the momentum and execution capabilities of both firms and
is in line with B. Riley’s stated intent to expand in M&A advisory and fixed income.
Strategic and financial sponsor clients will now have access to both firms’ proven execution
capabilities and a full suite of end-to-end services from a single platform.
10Case Study: Mizuho
Houlihan Lokey Advises Mizuho Americas on Its
Acquisition of Capstone Partners
Transaction Pending
On January 11, 2022, Mizuho Americas (Mizuho) has signed an agreement to acquire Dallas-
based Capstone Partners (Capstone), a leading independent, middle-market placement agent
focused on fundraising and advisory services to private equity, credit, real assets, and
infrastructure investment firms.
Founded in 2001, the Capstone team includes 40 experienced professionals globally.
has agreed to acquire
Mizuho is an integral part of the Japan-based Mizuho Financial Group, one of the largest
financial institutions in the world with ~900 offices and 60,000 employees in nearly 40
countries. As of December 31, 2020, its total assets were $2.1 trillion.
The deal underscores Mizuho’s commitment to enhancing its investment banking offering and
furthering the suite of solutions for clients in the alternative investment market, specifically
financial sponsors.
Buyside Advisor
It also reinforces the bank’s leading capital-raising and distribution capabilities through
Capstone’s global network of 1,500+ limited partners across the U.S., Europe, and Asia with
expanded opportunities for cross-selling complementary investment banking solutions.
In recent years, Mizuho has been expanding its investment and corporate banking franchise,
leveraging its flagship investment grade bond and loan businesses to grow its noninvestment
grade and financial sponsors franchise, lead IPO and SPAC transactions, and provide M&A
services on notable transactions.
The deal is expected to close in the first half of 2022, subject to regulatory approvals.
11Case Study: MarshBerry
Houlihan Lokey Advises MarshBerry on a
Growth Investment From Atlas Merchant Capital
On January 10, 2022, MarshBerry, a leading financial advisory, consulting, and analytics firm
serving the insurance distribution and wealth management industries received a significant
growth capital investment from Atlas Merchant Capital (Atlas).
Through a suite of industry-specific services, MarshBerry helps insurance agents and has received a growth capital
brokers, specialty distributors, private equity firms, and wealth management firms build, investment from
enhance, and sustain value.
Based in New York and London, Atlas was founded by Bob Diamond and David Schamis,
who (together with their partners) form a complementary partnership with extensive operating
and investing expertise across the financial services landscape.
The new partnership with Atlas will help MarshBerry accomplish its growth goals by improving Sellside Advisor
and expanding services to create even better outcomes for clients.
Further, this partnership provides access to additional resources to help execute on strategic
growth initiatives, including expanded client solutions and acquisitions domestically and in
Europe.
12Case Study: Regions
Houlihan Lokey Advises Regions Financial on Its
Acquisition of Clearsight Advisors
On December 31, 2021, Regions Financial (Regions) acquired Clearsight Advisors
(Clearsight), a leading M&A advisory firm serving clients in the technology, professional
services, data and information services, and digital and technology-enabled services sectors.
Clearsight follows a research-driven, thematic approach toward building relationships across
the sectors served by the company, enabling it to deliver a deep understanding of market has acquired
trends and business strategies.
With $156 billion in assets, Regions is a member of the S&P 500 Index and is one of the
nation’s largest full-service providers of consumer and commercial banking, wealth
management, and mortgage products and services.
The acquisition represents another avenue for the bank to broaden its specialty capabilities Buyside Advisor
for existing technology sector clients while reaching new clients that can leverage Regions’
experience and resources to help them reach their financial objectives.
Further, the acquisition is the latest example of Regions building additional revenue
diversification by delivering more high-value, fee-based financial services and originations.
13Case Study: MKM Partners
Houlihan Lokey Advises MKM Partners on Its
Sale to Freedom Holding Corp.
Transaction Pending
On December 3, 2021, MKM Partners (MKM), one of the largest trading firms in the U.S.
ranked in the top tier in equity research, agreed to be acquired by Freedom Holding Corp.
(NASDAQ:FRHC) (Freedom).
Freedom, headquartered in Almaty, Kazakhstan, conducts retail financial securities
brokerage, investment research, investment counseling, securities trading, investment has agreed to be acquired by
banking and underwriting services, and consumer banking.
The transaction aligns with Freedom’s commitment to growing U.S. services and expanding
international distribution capabilities and builds on its acquisition of Prime Executions in
January 2021.
MKM’s sales and trading professionals and 1,000+ clients will add to Freedom’s 290,000+ Sellside Advisor
retail clients and nearly 600 brokers.
The transaction demonstrates the power of Houlihan Lokey’s global reach and cross-border
execution expertise.
Completion of the transaction is subject to certain conditions, including FINRA approval.
14Houlihan Lokey Financial Services Group
2016–2021 M&A Advisor Rankings Global: One of the largest, most
North America and Europe Financial experienced and most active financial
Sector(1) Transactions With Disclosed services teams of any independent
Deal Values up to $1.0 Billion investment bank.
Rank Advisor Deals
65+ dedicated financial services/fintech
1 Houlihan Lokey 73 professionals based in New York and
London, with additional offices in Miami,
2 Barclays Capital 65 Financial
Los Angeles, and Boston. Services
3 JP Morgan 55 Group
4 Morgan Stanley 54 Exceptional momentum with 150+
completed transactions since 2019.
5 Piper Sandler 53
6 BofA Securities 49 Deep domain knowledge and
entrenched relationships with marquee
7 Goldman Sachs 47
clients across every sector of financial M&A Advisory
8 Raymond James 43 services.
Private Capital Markets
Product Capabilities
9 Stifel/KBW 42
Long-term, relationship-driven approach Financial Restructuring
10 KPMG 40
toward clients with senior participation on
Source: SNL Financial. all engagements. Illiquid Financial Assets
(1) Rankings exclude depository transactions.
Board and Special Committee Advisory
No. 1 Ranked M&A Advisor to Conflict-free, independent advice hired
nondepository financial services for our intellectual capital and sector Valuation Services
companies cumulatively over the last expertise by the industry’s highest profile
Fairness Opinions
three-, five-, seven-, and 10-year periods. clients despite no lending relationship.
15The Leading Independent, Global Advisory Firm
Houlihan Lokey is the trusted advisor to more top decision-
makers than any other independent global investment bank.
2,200+ 38 $7 Billion+ ~$2 Billion ~25% No
Employees Locations Market Cap Annual Revenue Employee-Owned Debt
Corporate Financial Financial and Financial Sponsors
Finance Restructuring Valuation Advisory Coverage
■ No. 1 Global M&A Advisor ■ No. 1 Global Restructuring ■ No. 1 Global M&A Fairness ■ No. 1 Global Advisor to
Advisor Opinion Advisor Private Equity Firms
■ Leading Capital Markets
Advisor Raising More Than ■ $3.0 Trillion of Aggregate ■ 1,000+ Annual Valuation ■ 1,000+ Sponsors Covered
$100 Billion In Past Five Transaction Value Completed Engagements Globally
Years
2021 Investment Banking 2021 Global Distressed Debt 2002 to 2021 Global M&A 2020 Most Active Global
Rankings All Global M&A & Bankruptcy Restructuring Fairness Advisory Rankings Investment Banks to
Transactions Advisory Rankings Private Equity Firms
Rank Advisor Deals
Rank Advisor Deals Rank Advisor Deals Rank Advisor Deals
1 Houlihan Lokey 952
1 Houlihan Lokey 549 1 Houlihan Lokey 63 1 Houlihan Lokey 153
2 JP Morgan 890
2 Goldman Sachs 511 2 Rothschild 38 2 Lincoln International 103
Duff & Phelps, A Kroll
3 JP Morgan 508 3 Moelis 34 3 882 3 KPMG 99
Business
Source: Refinitiv. Source: Refinitiv.
Source: Refinitiv. Announced or completed transactions. Source: PitchBook.
Excludes accounting firms and brokers.
Combined Global Presence:
Houlihan Lokey acquired GCA in October 2021, significantly
expanding the firm’s geographic reach in Europe and Asia
and creating the most active global M&A advisory firm
16Disclaimer
© 2022 Houlihan Lokey. All rights reserved. This material may not be reproduced in any format by any means or redistributed without the prior written
consent of Houlihan Lokey.
Houlihan Lokey is a trade name for Houlihan Lokey, Inc., and its subsidiaries and affiliates, which include the following licensed (or, in the case of
Singapore, exempt) entities: in (i) the United States: Houlihan Lokey Capital, Inc., and Houlihan Lokey Advisors, LLC, each an SEC-registered broker-
dealer and member of FINRA (www.finra.org) and SIPC (www.sipc.org) (investment banking services); (ii) Europe: Houlihan Lokey EMEA, LLP,
Houlihan Lokey (Corporate Finance) Limited, and Houlihan Lokey UK Limited, authorized and regulated by the U.K. Financial Conduct Authority;
Houlihan Lokey (Europe) GmbH, authorized and regulated by the German Federal Financial Supervisory Authority (Bundesanstalt für
Finanzdienstleistungsaufsicht); (iii) the United Arab Emirates, Dubai International Financial Centre (Dubai): Houlihan Lokey (MEA Financial Advisory)
Limited, regulated by the Dubai Financial Services Authority for the provision of advising on financial products, arranging deals in investments, and
arranging credit and advising on credit to professional clients only; (iv) Singapore: Houlihan Lokey (Singapore) Private Limited and GCA Singapore
Private Limited, each an “exempt corporate finance adviser” able to provide exempt corporate finance advisory services to accredited investors only; (v)
Hong Kong SAR: Houlihan Lokey (China) Limited, licensed in Hong Kong by the Securities and Futures Commission to conduct Type 1, 4, and 6
regulated activities to professional investors only; (vi) India: GCA India Investment Advisers Private Limited, registered as an investment adviser with
the Securities and Exchange Board of India (registration number INA000001217); and (vii) Australia: Houlihan Lokey (Australia) Pty Limited (ABN 74
601 825 227), a company incorporated in Australia and licensed by the Australian Securities and Investments Commission (AFSL number 474953) in
respect of financial services provided to wholesale clients only. In the United Kingdom, European Economic Area (EEA), Dubai, Singapore, Hong Kong,
India, and Australia, this communication is directed to intended recipients, including actual or potential professional clients (UK, EEA, and Dubai),
accredited investors (Singapore), professional investors (Hong Kong), and wholesale clients (Australia), respectively. Other persons, such as retail
clients, are NOT the intended recipients of our communications or services and should not act upon this communication.
Houlihan Lokey gathers its data from sources it considers reliable; however, it does not guarantee the accuracy or completeness of the information
provided within this presentation. The material presented reflects information known to the authors at the time this presentation was written, and this
information is subject to change. Houlihan Lokey makes no representations or warranties, expressed or implied, regarding the accuracy of this material.
The views expressed in this material accurately reflect the personal views of the authors regarding the subject securities and issuers and do not
necessarily coincide with those of Houlihan Lokey. Officers, directors, and partners in the Houlihan Lokey group of companies may have positions in the
securities of the companies discussed. This presentation does not constitute advice or a recommendation, offer, or solicitation with respect to the
securities of any company discussed herein, is not intended to provide information upon which to base an investment decision, and should not be
construed as such. Houlihan Lokey or its affiliates may from time to time provide investment banking or related services to these companies. Like all
Houlihan Lokey employees, the authors of this presentation receive compensation that is affected by overall firm profitability.
17CORPORATE FINANCE
FINANCIAL RESTRUCTURING
FINANCIAL AND VALUATION ADVISORY
HL.com
18You can also read