Information, Incentives, and Goal-Setting: A Field Experiment in Water Usage
←
→
Page content transcription
If your browser does not render page correctly, please read the page content below
Information, Incentives, and Goal-Setting:
           A Field Experiment in Water Usage∗
                       David P. Byrne†              Lorenz Goette‡

                                   December 12, 2022

                             Preliminary and Incomplete

                                          Abstract
          We report results from a 12-week field experiment in residential water us-
      age. We examine how personalized feedback from smart meters and weekly
      goals-based incentives from a digital platform affect water-conserving behavior.
      Our results reveal large, 8% reductions (ITT) in daily water usage in the first
      month of the trial. Daily conservation effects wane over time but persist within
      the 3pm-6pm interval throughout the trial. Treatment households accelerating
      reductions in seasonal outdoor water usage explain the substantial short-run
      daily conservation effects. We further establish that weekly water usage goals
      drive within-week water usage dynamics and explore a “last mile” problem in
      implementing monetary incentives.

      Keywords: D83, C93, L95
      JEL codes: D83, C93, L95

  ∗
     This research is governed by Human Research Ethics Project ID 236663 from the University of
Melbourne and is registered at the AEA RCT Registry with ID AEARCTR-0009028. All errors are
our own.
   †
     University of Melbourne, byrned@unimelb.edu.au
   ‡
     National University of Singapore and University of Bonn, ecslfg@nus.edu.sg

                                               1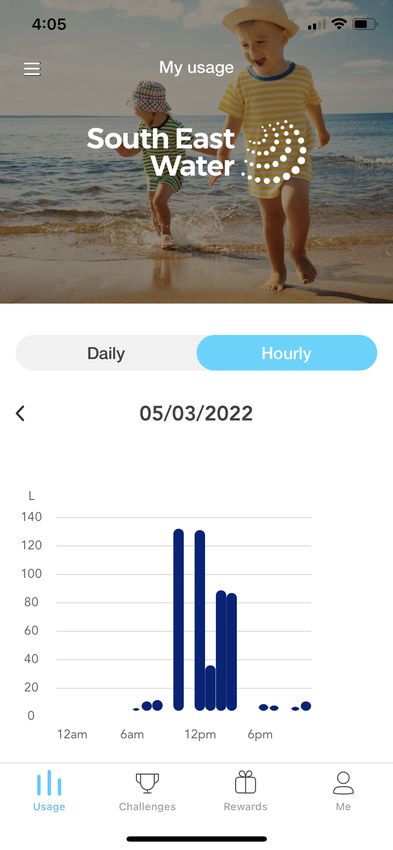
1       Introduction
Nudge-based interventions are now standard tools governments and companies use
to promote behavioral change.1 Whether changing handwashing, retirement savings,
healthy eating, or exercise, nudges have proven popular, complementing price-based
interventions, which can be sensitive politically. Particularly with sustainable resource
consumption, an extensive body of research documents a range of nudge-based im-
pacts on resource usage from repeated monthly or quarterly bill-based interventions
involving social comparisons (e.g., Allcott, 2011; Ferraro and Price, 2013; Costa and
Kahn, 2013; Byrne et al., 2018; Allcott and Kessler, 2019), information provision,
(e.g., Allcott and Rogers, 2014; Wichman, 2017; Andor et al., 2022), and conserva-
tion tips.
    In this paper, we study an intervention in residential water usage that moves from
paper, monthly or quarterly bill-based nudges to digital, daily app-based nudges.
Section 2 describes the intervention, which centers on the WaterSaver app. The app
uses 5-minute smart water meter data to give households daily and hourly feedback
on their water usage and nudges them through a given week to look at this informa-
tion. It also incentivizes water conservation through weekly WaterSaver “challenges”
involving water usage targets. In particular, households can earn a reward in a given
week if they keep their daily average water usage below the target level provided
(and visualized on the app). Through a 12-week field experiment involving ≈ 1000
households and a 2 × 2 research design, we examine the water-conserving impact
of providing weekly monetary ($10) and non-monetary (digital badges) rewards and
varying the difficulty of challenges in terms of the amount of conservation required
to earn a reward (labelled “hard” versus “easy” targets).
    We ran the trial in Australia, a setting with communities approaching “Day Zero”
with dwindling water supplies. Creating digital utilities and behavioral programs like
the one we study is one of the various policies and technologies the government is
experimenting with to facilitate climate change adaptation.
    Section 3 reports treatment effects induced by the trial. In the trial’s first four
weeks, we obtain a 24 L/day Intention-to-Treat (ITT) conservation effect from offering
WaterSaver to households. The corresponding Local Average Treatment Effect is 47
    1
    Examples of “nudge units” include the Behavioural Insights Team (UK), Social and Behavioural
Science Team (USA), Impact and Innovation Unit (Canada), NUDGE (Europe), NudgeRio (Brazil),
Indlela (South Africa), Behavioural Economics Team (Australia), or The Nudge Unit (Japan).

                                               2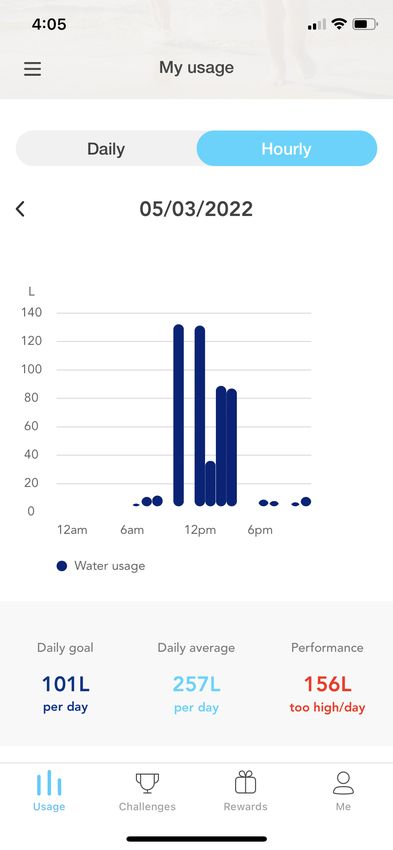
L/day. Respectively, these estimated savings are substantial at 8% and 15% of daily
average water usage. However, beyond the initial month of the trial, the treatment
effects at the daily level wane and become statistically insignificant, similar to previous
findings with bill-based interventions (Ferraro and Price, 2013).
    Leveraging the smart meter data, we refine our analyses to impacts on daily water
usage profiles and break down the impact of incentives and goal difficulty on conser-
vation. We show that the large initial treatment effects stem from water conservation
between 12 pm and 9 pm. Moreover, we find little difference in conservation ef-
fects between providing monetary and non-monterary rewards but a large difference
in easier versus harder goals. In short, when we stretch the households with more
challenging conservation goals, they can meet the challenge and conservation effects
emerge. While the daily treatment effects do not persist, we do find persistent effects
under relatively more challenging goals in the final month of the trial. Quantitatively,
we estimate a 5 L/day (ITT) daily water savings between 3-6 pm in the last month
of the trial, or a 1.6% conservation effect relative to mean daily water usage.
    We investigate underlying behavioural mechanisms in Section 4. Here, we docu-
ment three key sets of results. First, the large immediate impact of the app comes
from households reducing their outdoor water usage, namely from lawn and garden
watering, pools, and spas/hot tubs. These behaviors emerge in a trial that starts
at the end of summer and goes into autumn. In this context, we interpret the app
as shifting seasonal water-conserving behaviors from autumn to summer’s end as the
weather cools and rain starts. An implication of the trial’s large initial treatment
effects is that the app can expedite seasonal water usage reductions heading into
autumn through short, sharp interventions.2
    Second, we document large, statistically significant differences in goal attainment
between our treatment and control groups. Week-to-week, approximately 60% of
the households in our treatment groups (compliers and non-compliers) meet their
conservation goals. In contrast, just 35% of households in the control group would
have (hypothetically) met their goals given their water usage during the trial weeks.
These findings further establish behavioral change from the trial. Moreover, goal
achievement among the treatment households remains much larger and statistically
   2
     Our trial results also suggest high-frequency feedback and rewards can also potentially delay
ramping up of water usage when moving from spring into summer. We do not, however, directly
test for this behavioral change.

                                                3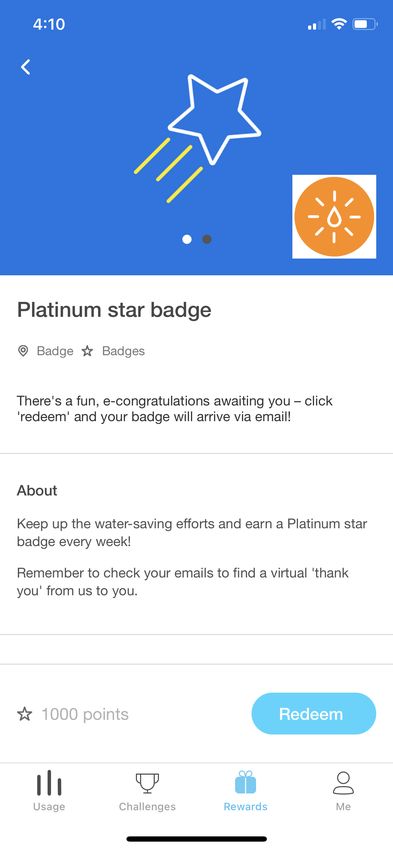
significant from the control households in the final weeks of the trial, further illus-
trating the persistence of behavioral impacts.
Lastly, we examine why monetary rewards have little impact on generating water
conservation. We study one particular channel – reward redemption rates – which
illustrates a “last mile” problem with incentives. We implement monetary incentives
through $10 gift cards that households can use at major retail outlets nationwide.3
Households must click a large “redeem” button on the WaterSaver app, and the re-
ward is automatically emailed and texted to them. Yet just 50 % of all $10 rewards
earned are eventually redeemed. These results underscore the importance of auto-
matic reward payment, through bill reductions, in implementing digital behavioral
programs.4
Section 5 summarizes and concludes the paper.
2 The field experiment
This section describes our field experiment, which we ran in partnership is South East
Water (SEW), a 750,000 water utility in Melbourne. The experiment centers on a
mobile app that provides households with daily water usage information from their
smart water meters. In addition, the app provides incentives to reduce their usage
through weekly “challenges”. We ran the experiment over 12 weeks (involving 12 con-
secutive “challenges”), from February 27 to May 22, 2022. Piloting, trial recruitment,
and baseline data collection ran from November 1 2021, to February 26, 2022.
2.1 WaterSaver app
Our trial examines the impact of providing feedback and incentives through the Wa-
terSaver app. The app provides feedback by visualizing water consumption data
from smart water meters that record household-water usage every 5 minutes. Figure
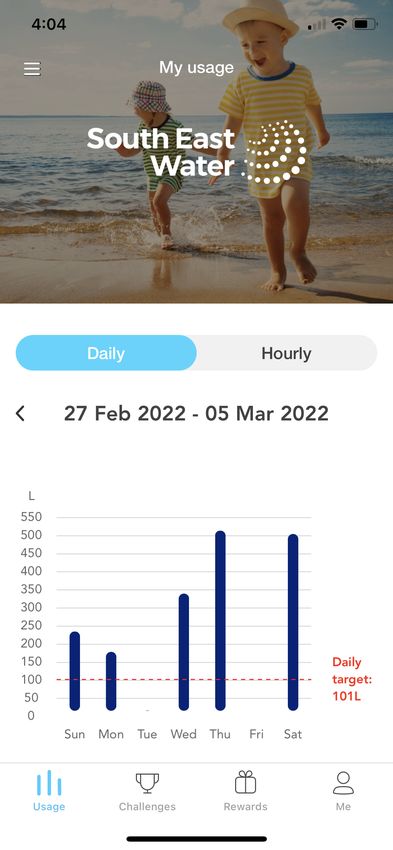
1 illustrates how the app aggregates and visualizes these data. Panel (a) depicts the
app’s “Usage” landing screen. By default, this screen plots total daily water usage by
day of the current week, starting Sunday and ending Saturday. Panel (b) plots half-
3
The cards are $10 Woolworths WISH Cards. See https://giftcards.woolworths.com.au/wish/p/wish0001
for details.
4
Our partner utility does not currently have data warehousing to enable such automatic bill
deductions.
4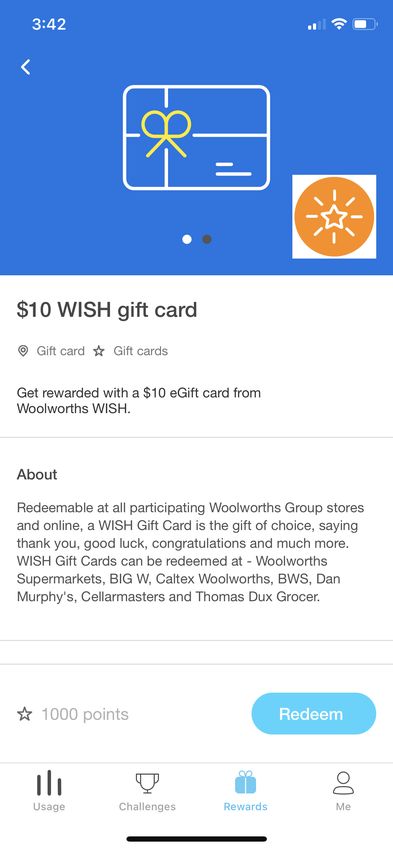
Figure 1: WaterSaver App Feedback
            (a)                         (b)                         (c)
        Daily Total                 Half-Hourly                How Daily Usage
        Water Usage                 Water Usage               Compares to Target

hourly water usage from the previous day if a user touches the “hourly” tab. These
are two key sources of water usage feedback from the app. We emphasize that the
information provided in these tabs do not include the current day’s usage. Present-
ing real-time information is infeasible with the app and smart meter combination we
study.
    The app also implements weekly WaterSaver Challenges that incentivize water
conservation. As mentioned, our field experiment implements 12 consecutive weekly
WaterSaver challenges. Table 1 describes the timeline for a given challenge. In short,
a challenge starts on Sunday, setting a daily average water usage goal for a household
for the upcoming week. The challenge ends the following Saturday, providing the
household with a reward if they meet their goal. Panel (a) of Figure 1 highlights an
example daily average water usage goal (“target”) of 101 L/day. Panel (c) illustrates

                                          5
Table 1: WaterSaver Challenge Weekly Timeline
Time WaterSaver Challenge Activity
Sunday 12:00 am Challenge begins
10:00 am The App nudges the household to inform it about: (1)
the outcome of the previous week’s WaterSaver challenge;
and (2) the upcoming week’s challenge, defined by:
1. Goal: a households’ personalized target daily average
water usage level for the week
2. Incentive: the household’s reward receives if it keeps
its daily average water usage below that week’s target
Wednesday 7:00 am SMS text nudges the household to check the WaterSaver
app and see how their daily average water usage is
tracking against its target
Saturday 11:59 pm Challenge ends
how scrolling down on the app’s screen allows a household to see how their goal
and current daily average water usage compare. The example illustrates data for a
complete seven-day challenge. The household’s 257 L/day consumption level exceeded
101 L/day, meaning it failed to reach its goal.
The app also provided water-saving tips through its Sunday and Wednesday
nudges. These tips emphasize common water savings strategies, including taking
one-minute shorter showers, ensuring full dishwashers and clothes washers, or using
less water for their lawn and garden.
2.2 Design: randomizing goals and incentives
Our field experiment examines how WaterSaver challenge goals (“targets”) and in-
centives (“rewards”) affect water consumption. In particular, we implement a 2 × 2
design with the following variations:
• Goals: relative to predicted water usage, to earn a reward, a household must
reduce their usage by
– 3% (easy goal)
6– 6% (hard goal)
• Incentives: if a household achieves its goal in a given week, they receive one of
two rewards
– digital badge (non-monetary incentive)
– $10 gift card (monetary incentive)
Figure 2 depicts the non-monetary and monetary incentives households access
by touching the “Rewards” tab at the bottom of the app’s screen. Panel (a) shows
that the digital badge provides a “Platinum Star” graphic on the app, and panel (b)
depicts the $10 gift card. The household must touch a “redeem button” on the app
to redeem either reward. Rewards are sent directly to their linked email account as
an image (badge) or a digital gift card ($10). The gift cards are redeemable in-store
or online at major retail chains across the country, including groceries, department
stores, gasoline, and liquor. Households in the monetary reward condition can thus
earn up to $120 in gift cards if they meet their WaterSaver goal for 12 consecutive
weeks. This total is more than one-third of a typical SEW quarterly water bill. 5
With goals, the main implementation issue is predicting a household’s counter-
factual water usage absent the WaterSaver app. One approach to baselining from
Burlig et al. (2020) would be to use pre-trial household-level smart meter data to
train household-specific machine learning models and forecast each household’s water
usage over the trial period. Unfortunately, smart meter data was only available for
four months before our trial, reflecting that we ran the trial in the early stages of
SEW’s utility-wide smart meter rollout. Given this data constraint, we take a much
simpler 3-step approach to forecasting households’ daily average water usage:
1. Using smart meter data, compute household i’s average daily water usage from
Jan-Feb 2022. Denote this ȳi .
2. Specify a forecast for household i’s daily average water usage in month m by:
Mar: ŷim = 0.97 × ȳi
Apr: ŷim = 0.88 × ȳi
5
More ideal would have been to pay the $10 rewards through automatic SEW water bill deduc-
tions. Unfortunately, the utility does not currently have integrated smart water meter usage and
customer billing data to implement automatic bill deductions.
7Figure 2: WaterSaver App Incentives
(a) (b)
Non-Monetary Incentive: Monetary Incentive:
Digital Star Badge Woolworths WISH Card
May: ŷim = 0.85 × ȳi
where the month-by-month reductions in ŷim relative to ȳi correspond to trends
estimated from historical monthly consumption data from our partner utility
from 2010-2021. For instance, relative to January and February, a typical house-
hold exhibits 3% reduction in average daily water usage in March each year.
3. Compute the water usage goal for household i in month m as incremental per-
centage reductions in water usage beyond the forecasted seasonal reductions:
Mar: yim
∗
= (0.97 − z1 ) × ȳi
Apr: yim
∗
= (0.88 − z2 ) × ȳi
May: yim
∗
= (0.85 − z3 ) × ȳi
8where {z1 , z2 , z3 } = {0.03, 0.03, 0.06} if i is faces “easy” goals (3% water us-
age reduction relative to forecasted levels in March and April, 6% in May)
and {z1 , z2 , z3 } = {0.06, 0.06, 0.06} if i faces “hard” goals (6% reduction each
month).6 Week w’s WaterSaver challenge goal is set to yim ∗
, where the start of
week w (Sunday) falls in month m.
We calibrate the easy goal based on the state government of Victoria’s historical
“Target 155” public messaging campaign, which encourages household water usage of
155 L/day per person. Given our partner utility’s average water usage of 161 L/day
per person, Target 155 involves a 3% water usage reduction, which provides a natural
benchmark for our trial.
2.3 Implementation
In total, 7000 unique SEW accounts with smart water metres were emailed between
February 2 and 7, 2022 and invited to participate in the trial and complete a baseline
survey.7 965 (14%) completed the baseline survey and were eligible for the trial.8
Next, we constructed our trial groups from the 965 eligible accounts. We randomly
chose 135 for our control group. We informed them that we could not provide them
with the WaterSaver app due to trial budget constraints. The remaining 815 accounts
were randomly allocated to our four main trial groups. The first two columns of Table
2 describe these allocations.9
We then emailed households in the experimental groups to download and install
the WaterSaver app. After a two-week email campaign to encourage app downloads,
we obtained between 101 and 110 downloads across the groups, as illustrated in the
third column of Table 2. That is, we had approximately a 50% compliance rate with
6
We “ramp up” goals in May under both conditions. Doing so allows us to examine whether
there are differences in conservation rates in May conditional on facing easier (3% reductions) or
harder (6% reductions) goals before May. Intuitively, households previously facing easier goals may
face adjustment costs that limit their ability to meet 6% goals in May. In contrast, households with
harder goals in March and April may have already adjusted to meet 6% water usage reduction goals
in May.
7
We exclude both hardship accounts and accounts associated with SEW employees.
8
We obtained this recruitment rate through non-negligible incentives: customers who completed
the baseline survey were entered into a draw to win one of 50 $200 Woolworths WISH Cards.
9
Our pre-trial power calculations based on a within-subject design revealed that we needed
approximately 80 participants per experimental condition to detect a 3% water usage reduction
(intention-to-treat) with 90% confidence.
9Table 2: Experimental Groups, App Downloads, Attrition
Number of Downloaded Remaining at
Trial Group Accounts the App End of Trial
1: Easy Goal, Badge 203 110 (54%) 107 (54%)
2: Easy Goal, $10 204 102 (54%) 99 (49%)
3: Hard Goal, Badge 204 107 (54%) 103 (52%)
4: Hard Goal, $10 204 101 (54%) 98 (49%)
5: Control 135
app downloads. Lastly, there was minimal attrition after the 12-week trial among
compliers, as illustrated in the last column of the table. Non-compliers and the
control group had similar minimal attrition rates.
2.4 Data
We use four primary data sources to evaluate the behavioural impacts of WaterSaver:
• Water usage: 30-minute level interval data from each (anonymized) household’s
smart water meter
• Engagement: daily data from Google Analytics on household engagement with
the WaterSaver app. These data are the aggregate sum of engagement measures
across all households. Unfortunately, individual-level engagement data are not
available.
• Surveys: baseline and follow-up survey data on household characteristics and
informativeness about water usage. The Appendix lists all baseline and follow-
up survey questions and answers.
• Demographics: information on household demographics, where we anonymously
match each household to their Australian Bureau of Statistics ‘Statistical Area
1’ (SA1) census block and assign them their SA1-level demographic data, e.g.,
annual income, age, education, ethnicity, and so on.10
In total, our raw water usage dataset contains 6,499,466 half-hourly observations
across the 965 households, spanning 18 January 2022 to 22 May 2022, with the trial
10
SA1s contain approximately 200 households and are the most narrow census blocks that are
publicly available.
10starting on 27 February 2022. As mentioned, we use the pre-trial data to construct
baseline water usage and forecast individual water usage at the household level.
Table A.1 in the Appendix summarizes how trial participants compare to a rep-
resentative sample of SEW households. Compared to the representative sample, trial
participants: (1) consume more water per year (15% more); (2) are less likely to be a
low-income subsidy recipient (33% less likely); (3) are more likely to electronic-billing
(28% more likely); and (4) have a higher income (7% higher). Our trial participants
tend to be more water-consuming, tech-savvy, and better-off households.
Appendix Table A.2 reports summary statistics across our four experimental con-
ditions and the control group. Overall, the table confirms balance on observables
from our random assignment of households to groups.
3 Treatment effects
We present the results from the trial in three parts. First, we present visual evidence
of trial engagement and its impacts over time. Second, we estimate treatment effects
on total daily water usage. Finally, we examine trial impacts on households’ hourly
consumption profiles.
3.1 Visual evidence
WaterSaver has an immediate and large impact on household water usage. Figure
3 visualizes this result by plotting daily average water usage for each trial group.
Before the trial, daily water usage tracks closely between the trial groups and control,
further validating our experiment’s design and implementation. However, when the
trial begins on February 27, there is an immediate drop in daily water usage in the
four WaterSaver groups compared to the control. The gap between the control group
water usage (in grey) and the WaterSaver groups (in colour) persists for roughly 5
weeks, until April 1. Beyond April 1, Figure 3 shows daily water usage across all five
groups converges. This convergence points to WaterSaver having a short-lived impact
at the daily level.
Figure 4 provides an initial look into why we see a large initial WaterSaver impact
that wanes over time. The figure plots the daily total WaterSaver screen and page
views, as well as total user engagements from Google Analytics on a per-household
11Figure 3: Daily Mean Water Usage by Trial Condition
400
Mean Daily Water Usage
Water Savers by Trial Condition
Trial Starts
Average Daily Household Water Usage (L)
Easy Goal + Badge
Easy Goal + $10
Hard Goal + Badge
350
Hard Goal + $10
Control
250 300
200
1 Feb 1 Mar 1 Apr 1 May
Date
basis. The regular spikes in engagement tend to be on Sundays when the app nudges
households about the outcome of the previous week’s challenge and presents the
goals and incentives for the upcoming week’s challenge. In the first two trial weeks,
households engage with the app between 1 to 4 times per day on average. Six weeks
into the trial in April, this engagement rate has converged to 0.5 times per household
per day or about 3 times per week.11
3.2 Baseline results
Building from Figure 3, we estimate the impact of WaterSaver on water usage using
fixed effects regressions. Equation 5 presents our baseline OLS regression specifica-
tion, which we work from throughout
yit = β0 + β1 1{W S}it + ηi + δt + ϵit , (1)
where yit is the water consumption for household i in period t (e.g., t is an individual
date or hour), 1{W S}it is a dummy equaling one if household i has been offered the
11
The spike in engagement after the trial ends reflects our follow-up survey, which reminds house-
holds to redeem their rewards before the app shuts down. We return to some of these end-of-trial
incentive effects below.
12Figure 4: Daily WaterSaver App Engagement from Google Analytics
4
Daily Water Savers App
Engagement Measures Per Household Water Savers
Trial Ends
Screen Views
Page Views
User Engagement
Interactions Per Household
3
Daily Water Savers App
1 2 0
1 Mar 1 Apr 1 May 1 Jun
Date
WaterSaver app on or before period t, ηi and δt are household and period fixed effects,
and ϵit is the econometric error. Our coefficient of interest, β1 , measures the impact
of offering the WaterSaver app to a household on water usage. That is, β1 captures
an Intention-to-Treat (ITT) effect.
We can further estimate the local average treatment effect (LATE) among com-
pliers who download the app using the following regression
yit = β0 + β1 1{DownloadW S}it + ηi + δt + ϵit , (2)
where 1{DownloadW S}it equals one if household i downloads the WaterSaver app
on or before date t. Following Angrist et al. (1996), we can estimate the LATE by
estimating equation (2) by 2SLS where we instrument for 1{DownloadW S}it with
1{W S}it .
Our experiment also allows us to test whether differences in goals and incentives
affect water usage. We can identify differential impacts using the following regression
yit =β0 + β1 1{W S}it + β2 1{W S}it × {$10}i + β3 1{W S}it × {Hard}it
+ ηi + δt + ϵit , (3)
13where {$10}i is a dummy equaling one if household i has a monetary $10 gift card
incentive for meeting their WaterSaver goal, and {Hard}i equals one if the household
faces the “hard” goal of reducing their water usage by 6% relative to predicted levels.
In equation (3), β2 quantifies changes in water usage from having a $10 gift card
incentive relative to a digital badge incentive. The β3 coefficient quantifies the impact
of facing a harder goal relative to the easier 3% water usage reduction goal. We can
likewise estimate a LATE from downloading the app based on the specification in (3)
by swapping out 1{W S}it everywhere for 1{DownloadW S}it and instrument for all
the variables with 1{W S}it , 1{W S}it × {$10}i , and 1{W S}it × {Hard}i .
Results
Table 3 reports our ITT and LATE estimates and standard errors clustered at the
household level. Both the ITT and LATE estimates of trial impacts in column (1) in
the first 4 weeks are substantial. Respectively, the estimates imply 24 L/day and 47
L/day reductions in water usage from being offered and downloading the WaterSaver
app. Alternatively, these estimates represent 8% and 15% reductions in daily water
usage relative to a mean baseline usage of 305 L/day. The near doubling of the LATE
relative to the ITT estimate reflects approximately 50% of households download the
app when offered. The estimates in columns (2) and (3) reveal that neither the $10
gift card nor the hard goal yields statistically significant impacts on daily water usage
in the first month of the trial.
A benchmark for these results is the shortly-lived 4.8% reduction in water usage
Ferraro and Price (2013) estimate from providing strong social norm comparisons
via paper quarterly bills. Comparing our findings and theirs highlights how high-
frequency personalized feedback and incentivized goals can enhance short-run water
conservation.12
Columns (4)-(9) Table 3 confirm the visual evidence from Figure 3: app impacts
on water usage drastically wane beyond the first trial month. The $10 incentive for
meeting goals continues to have small, statistically insignificant impacts. In contrast,
we find mixed significance in the impact of hard goals with non-negligible coefficient
estimates. Given this, we continue to explore differences in goal difficulty on hourly
consumption profiles.
12
A caveat when thinking about scaling utility-wide is uptake into the trial itself, which recall was
14% with additional uptake incentives.
14Table 3: Balance Trial Impact Estimates
Trial Weeks 1-4 Trial Weeks 5-8 Trial Weeks 9-12
(1) (2) (3) (4) (5) (6) (7) (8) (9)
Panel (a): Intention-to-Treat Effects (L/Day)
Offered WS -24.09∗∗ -24.72∗∗ -21.56∗ -3.26 -4.68 4.27 1.86 0.31 4.04
(12.16) (12.41) (12.45) (11.92) (12.33) (12.44) (12.54) (13.07) (13.03)
Offered WS + $10 1.24 2.81 3.08
(5.69) (6.75) (8.14)
Offered WS + Hard Goal -5.07 -15.06∗∗ -4.38
(5.69) (6.74) (8.14)
R-Squared 0.481 0.481 0.481 0.457 0.457 0.457 0.453 0.453 0.453
Observations 62753 62753 62753 62276 62276 62276 62559 62559 62559
Panel (b): Local Average Treatment Effects (L/Day)
Downloaded WS -46.93∗∗ -46.27∗∗ -41.56∗ -6.36 -8.74 8.21 3.63 0.59 7.78
(23.75) (23.32) (24.08) (23.23) (23.05) (23.93) (24.45) (24.41) (25.05)
Downloaded WS + $10 -1.36 4.95 6.33
(11.80) (13.38) (16.09)
Downloaded WS + Hard Goal -10.89 -29.53∗∗ -8.44
(11.60) (13.18) (15.93)
R-Squared -0.005 -0.005 -0.005 -0.001 -0.001 -0.001 -0.001 -0.001 -0.001
Observations 62753 62753 62753 62276 62276 62276 62559 62559 62559
Notes: Dependent variable is daily household water usage, which has a baseline mean of 305 L/day (s.d. = 226 L/day). All
regressions include household and date-fixed effects. Standard errors clustered at the household level in parentheses. Statis-
tical significance at the 1%, 5%, and 10% level is indicated by ∗∗∗ p < 0.01, ∗∗ p < 0.05, ∗ p < 0.1, respectively.
3.3 Daily consumption profile impacts
The smart meter data allows us to examine impacts on hourly consumption profiles.
For brevity, we focus on ITT estimates throughout; LATE estimates are roughly
double the magnitude of the ITT effects. Figure 5 provides initial visual evidence of
daily water usage profile effects. To construct the figure, we estimate (5) for each
half-hour interval (so, 48 regressions in total) and interact 1{W S}it with dummies
for the four experimental groups. We plot the mean usage for each interval within
our sample period for the control group (in grey). We then add the 48 coefficients
from the regressions to the control group’s mean usage and plot the adjusted means
15Figure 5: Water Usage Profiles Across Trial Conditions and Control
14
Predicted Half-Hourly
Water Usage Profiles
From Being Offered
Water Savers (L)
12
Easy Goal + Badge
Predicted Mean Water Usage (L)
Easy Goal + $10
Hard Goal + Badge
10
Hard Goal + $10
Control
4 6 8
2
0
00:00 03:00 06:00 09:00 12:00 15:00 18:00 21:00 00:00
30-Minute Interval
for each of the four experimental conditions.13
The midday “belly” in the colored lines in the plot relative to the control group
suggests that WaterSaver induces conservation effects primarily during the day and
early evening, specifically between 12 noon and 6 pm. In the very early (12 am - 6 am)
and late (9 pm - 12 am) hours of the day, we unsurprisingly find no differences in usage
between the control and experimental groups. However, we also find surprisingly
little evidence of conservation effects between 6 am and 9 am. As mentioned, the app
emphasizes shorter showers as an effective strategy, and feedback on shower water
usage can drastically reduce water usage (Tiefenbeck et al., 2018). The patterns in
Figure 5, however, indicate that salience-enhancing feedback from the app, but not
real time, is ineffective in reducing morning shower water usage. When examining
mechanisms, we return to this and other behaviors in Section 4 below.
13
For clarity in visualizing the consumption profiles, we ignore, for the moment, confidence inter-
vals.
16Estimating impacts on consumption profiles
Motivated by Figure 5, we estimate treatment effects by the time of day using regres-
sions that predict household i water usage in a half-hour interval t
4 X
X 8
yit = β0 + βjk 1{W S Group j}it × 1{3 Hr W indow k} + ηi + δt + ϵit , (4)
j=1 k=1
where 1{W S Group i}it equals one of if household i is assigned to experimental group
j and 1{3 Hr W indow k} if half-hour period t falls within three-hour time window
k. We allow for eight windows in total: 12am–3am, 3am–6am,. . .,9pm–12am. The
coefficients in (2) allow us to assess profile effects by experimental condition and part
of the day.14 In light of our findings of waning treatment effect over time, we report
profile effects for the first and last four weeks of the trial.
Figure 5 presents the profile effects. Comparing the left and right columns of
the figure, we again see consistently large treatment effects from the first four trial
weeks and noisier, smaller effects in the last four weeks. Consistent with the visual
evidence in Figure 5, these effects primarily exist between the 9am-12pm and 6pm-
9pm intervals.
Comparing the top four and bottom four panels ((a)-(d) vs. (e)-(h)) illustrates
the impact of setting easy versus hard goals. In short, we consistently obtain larger-
magnitude treatment effects under hard goals. As we will see in Section 4 below,
this stems from households achieving their goals in these groups at similar rates. In
effect, hard goals “stretch” households to achieve higher levels of conservation without
discouraging them.
Finally, focusing on the right column of the figure, we obtain a consistent conser-
vation effect in the 3pm-6pm interval in the last four weeks of the trial. Under hard
goals, these effects are statistically significant and imply a 4.6 L/day conservation ef-
fect.15 This estimate corresponds to a 1.5% reduction in daily water usage relative to
the control group’s mean of 305 L/day. It illustrates how the trial induces persistent
behavioral change beyond the first four weeks. However, aggregated daily data mask
these effects.
14
We have estimated treatment effects at hourly and 30-minute levels. They align with the findings
based on three-hour time windows and do not offer any additional insight.
15
This is the point estimate and significance of the coefficients if we pool the hard goal conditions.
17Figure 6: WaterSaver Impacts on Daily Consumption Profiles
(a) (Badge + Easy Goals) - Weeks 1-4 (b) (Badge + Easy Goals) - Weeks 9-12
10
10
8
8
Daily Water Usage Reduction From
Daily Water Usage Reduction From
Being Offered Water Savers (L)
Being Offered Water Savers (L)
6
6
4
4
2.52 L
2
2
1.59 L 1.56 L
1.19 L
.82 L
0
0
-.33 L -.51 L -.7 L
-6 -4 -2
-6 -4 -2
-2 L
-2.32 L
-2.82 L
-3.4 L -3.4 L
-4.01 L
-5.51 L
-5.83 L
Water Savers Impacts: Weeks 1 to 4 Water Savers Impacts: Weeks 8 to 12
(Easy Goal + Badge) (Easy Goal + Badge)
-8
-8
Daily Water Usage Reduction From Daily Water Usage Reduction From
Being Offered Water Savers (L) Being Offered Water Savers (L)
90% Confidence Interval 90% Confidence Interval
-10
-10
12am-3am 3am-6am 6am-9am 9am-12pm 12pm-3pm 3pm-6pm 6pm-9pm 9pm-12am 12am-3am 3am-6am 6am-9am 9am-12pm 12pm-3pm 3pm-6pm 6pm-9pm 9pm-12am
3-Hour Period of the Day 3-Hour Period of the Day
(c) ($10 + Easy Goals) - Weeks 1-4 (d) ($10 + Easy Goals) - Weeks 9-12
10
10
8
8
Daily Water Usage Reduction From
Daily Water Usage Reduction From
Being Offered Water Savers (L)
Being Offered Water Savers (L)
6
6
5.01 L
4
4
2.36 L
2
2
1.24 L 1.13 L
.39 L
.11 L
0
0
-.36 L
-.82 L -.65 L
-.97 L
-6 -4 -2
-6 -4 -2
-2.85 L -2.75 L -2.69 L
-.6899999999999999 L -3.06 L
-3.53 L
Water Savers Impacts: Weeks 1 to 4 Water Savers Impacts: Weeks 8 to 12
(Easy Goal + $10) (Easy Goal + $10)
-8
-8
Daily Water Usage Reduction From Daily Water Usage Reduction From
Being Offered Water Savers (L) Being Offered Water Savers (L)
90% Confidence Interval 90% Confidence Interval
-10
-10
12am-3am 3am-6am 6am-9am 9am-12pm 12pm-3pm 3pm-6pm 6pm-9pm 9pm-12am 12am-3am 3am-6am 6am-9am 9am-12pm 12pm-3pm 3pm-6pm 6pm-9pm 9pm-12am
3-Hour Period of the Day 3-Hour Period of the Day
(e) (Badge + Hard Goals) - Weeks 1-4 (f) (Badge + Hard Goals) - Weeks 9-12
10
10
8
8
Daily Water Usage Reduction From
Daily Water Usage Reduction From
6
Being Offered Water Savers (L)
Being Offered Water Savers (L)
6
4
4
2.38 L
2.01 L
2
2
.64 L .86 L
.55 L .71 L
.12 L
-6 -4 -2 0
0
-.13 L
-6 -4 -2
-2.16 L
-2.63 L
-2.96 L -2.72 L
-4.24 L
-5.24 L
-5.49 L
-6.85 L
Water Savers Impacts: Weeks 1 to 4 Water Savers Impacts: Weeks 8 to 12
-8
(Hard Goal + Badge) (Hard Goal + Badge)
-8
Daily Water Usage Reduction From Daily Water Usage Reduction From
Being Offered Water Savers (L) Being Offered Water Savers (L)
-10
90% Confidence Interval 90% Confidence Interval
-10
12am-3am 3am-6am 6am-9am 9am-12pm 12pm-3pm 3pm-6pm 6pm-9pm 9pm-12am 12am-3am 3am-6am 6am-9am 9am-12pm 12pm-3pm 3pm-6pm 6pm-9pm 9pm-12am
3-Hour Period of the Day 3-Hour Period of the Day
(g) ($10 + Hard Goals) - Weeks 1-4 (h) ($10 + Hard Goals) - Weeks 9-12
10
10
8
8
Daily Water Usage Reduction From
Daily Water Usage Reduction From
6
Being Offered Water Savers (L)
Being Offered Water Savers (L)
6
4.02 L
4
4
2
2
1.01 L .78 L
.39 L .62 L
-6 -4 -2 0
0
-.29 L
-.7 L
-.85 L
-1.4 L
-6 -4 -2
-2.3 L
-2.94 L
-5.25 L -5.1 L -5.34 L
-5.02 L
-10 -8
Water Savers Impacts: Weeks 1 to 4 -7.48 L Water Savers Impacts: Weeks 8 to 12
(Hard Goal + $10) (Hard Goal + $10)
-8
Daily Water Usage Reduction From Daily Water Usage Reduction From
Being Offered Water Savers (L) Being Offered Water Savers (L)
90% Confidence Interval 90% Confidence Interval
-10
12am-3am 3am-6am 6am-9am 9am-12pm 12pm-3pm 3pm-6pm 6pm-9pm 9pm-12am 12am-3am 3am-6am 6am-9am 9am-12pm 12pm-3pm 3pm-6pm 6pm-9pm 9pm-12am
3-Hour Period of the Day 3-Hour Period of the Day
Notes: Regression coefficients from equation (4) and 90% confidence intervals plotted. All regressions include house-
hold and date fixed effects. Standard errors clustered at household level are reported in parantheses. Statistical
significance at the 1%, 5%, and 10% level is indicated by ∗∗∗ p < 0.01, ∗∗ p < 0.05, ∗ p < 0.1, respectively.4 Behavioral mechanisms
In this section, we document behaviors undertaken by households to reduce their
water usage in response to the trial. We also study how households engage daily with
WaterSaver to meet their weekly goals and redeem incentive payments.
4.1 Survey evidence
The most direct evidence we have on water-conservation behaviors comes from ask-
ing customers. In our follow-up survey, we ask What strategies did you use to reduce
water usage to earn WaterSaver rewards? 16 Households chose from 13 water-saving
strategies, where they are allowed to choose multiple strategies. Figure 7 summarizes
the survey responses. The substantial share of households reporting reduced garden
watering (34%) points to the large, short-run WaterSaver impacts from households
cutting back on their outdoor water usage. There is scope to do so in March, when
the trial begins, as households move from summer into autumn in Melbourne. The
weather becomes wetter, allowing households to reduce external water usage without
killing their lawns and plants. Our substantial week 1-4 estimates of WaterSaver’s im-
pacts and self-reported water-saving strategies suggest WaterSaver accelerates house-
holds’ seasonal reduction in water usage between summer and autumn. Waning
treatment effects over time reflect the control group stopping to water their gardens
in autumn toward winter as the weather gets cooler and wetter.
Other relatively important water-saving strategies - fuller dishwasher (17%), fuller
washing machine (11%), shorter showers (9%) – can also contribute to the large,
short-run water conservation impacts of WaterSaver. However, unlike outdoor water
usage, which is highly seasonal, these behaviours are less likely to exhibit significant
seasonal trends. They can also potentially explain the persistent 4.6 L/day water
usage reduction between 3-6pm in trial weeks 9-12 under hard goals.
16
We asked customers this question in our follow-up survey of 407 customers in trial groups 1-4
who downloaded the app and did not drop out of the trial. 202 (49%) of these customers completed
the survey. As with the baseline survey, we offered survey response incentives with the follow-up
survey. Specifically, we offered customers a chance to win one of 10 $200 Woolworths WISH cards
if they completed the follow-up survey. Appendix ?? contains the follow-up survey questions and
answers.
19Figure 7: Self-Reported Water Usage Strategies to Meet WaterSaver Goals
What strategies did you use to reduce your water usage to earn What strategies did you use to reduce your water usage to earn
Water Saver rewards? (Click all that apply) Water Saver rewards? (Click all that apply)
40
40
34%
Percent of Survey Respondents
Percent of Survey Respondents
30
30
20
20
17%
11%
9%
10
10
7% 8%
4% 3% 4%
1% 2% 2% 1%
0
0
Turned off Turned off Took Took Had baths Had fewer Flushed the Washed clothes Used the Washed dishes Used the Watered the Watered the
tap while tap while shorter fewer with less baths toilet less with a fuller washing with a fuller dishwasher lawn less garden less
lathering brushing showers showers water washing machine dishwasher less
soap while teeth machine less
hand washing
4.2 Treatment effect mediators
We complement the survey results by documenting how treatment effects vary with
baseline water usage behaviors. Our baseline survey (reproduced in Appendix B.1)
has all households in our sample report 11 aspects of their appliance stock and home
(e.g. if they have a lawn). We modify our baseline regression as follows to examine
how WaterSaver treatment effects (ITT) vary with a particular characteristic
yit = β0 + β1 1{W S}it + β2 1{W S}it × 1{Char}i + ηi + δt + ϵit , (5)
where 1{Char}i equals one if a household has a particular water-consuming charac-
teristic. The coefficient of interest, β2 , reveals whether a given characteristic mediates
the WaterSaver treatment effect.17
Table 4 presents β2 mediated treatment effect estimates for each characteristic.
All estimates are from a sample including our control and households with hard goals,
with panels (a) and (b) reporting estimates for trial weeks 1-4 and 9-12, respectively.
Panel (a) reveals that households with rainwater tanks, pools, and spas (hot tubs)
are the key drivers of short-run feedback effects from the trial.18 Households with
extreme water usage appliances and the ability to use rainwater instead of SEW–
supplied water appear best positioned to meet their water usage goals.19
17
Still to develop: mediation analysis in the spirit of the, e.g., Gelbach (2016) decomposition.
18
We find similar results from households with “Easy” goals.
19
We did not offer potential survey responses to pool and spa water usage in our follow-up survey,
20Table 4: WaterSaver Daily Treatment Effect Mediators – Appliance Stock
High Dual Top
Flow Flush Loading Balcony Vegetable Native Drip Rain
Shower Toilet Washer Garden Lawn Garden Plants Irrig. Tank Pool Spa
(1) (2) (3) (4) (5) (6) (7) (8) (9) (10) (11)
Panel (a): Intention-to-Treat Effects (L/Day), Trial Weeks 1-4, Hard Goals Conditions
WS Base Effect -11.01∗ -1.43 -9.98∗ -13.15∗∗ -6.89 -8.09 -11.70∗ -10.58∗ -5.13 -9.72 -9.00
(5.88) (13.35) (5.92) (6.12) (8.33) (5.68) (6.04) (5.95) (5.58) (5.91) (5.54)
WS Interactive Effect -7.47 -11.42 -8.48 5.14 -8.14 -11.19 -2.14 -13.52 -25.70∗∗ -26.39∗∗ -65.62∗
(12.65) (13.35) (10.41) (8.83) (8.58) (9.15) (10.00) (11.43) (10.81) (11.87) (34.83)
R-Squared 0.483 0.482 0.482 0.479 0.479 0.479 0.480 0.479 0.480 0.479 0.480
Observations 75160 75324 75406 75078 75160 75078 75160 75078 75242 75078 75078
Panel (b): Intention-to-Treat Effects (L/Day), Trial Weeks 9-12, Hard Goals Conditions
WS Base Effect -5.21 15.38 -2.76 -7.09 9.27 -2.83 -5.23 -5.87 -4.05 -6.86 -3.63
(7.42) (19.94) (7.74) (7.56) (11.99) (8.31) (7.72) (7.23) (7.54) (7.41) (7.06)
WS Interactive Effect -15.67 -24.37 -17.88 0.07 -25.69∗∗ -11.29 -6.93 -9.63 -11.23 -2.21 -68.02∗
(15.62) (20.20) (12.84) (14.80) (12.46) (11.26) (13.21) (20.79) (13.41) (17.44) (38.19)
R-Squared 0.444 0.444 0.444 0.443 0.443 0.443 0.443 0.443 0.444 0.443 0.443
Observations 75396 75578 75646 75314 75397 75314 75397 75314 75480 75314 75314
Notes: Dependent variable is daily household water usage, which has a baseline mean of 305 L/day (s.d. = 226 L/day). All regressions
include household and date-fixed effects. Standard errors clustered at the household level in parentheses. Statistical significance at the 1%,
5%, and 10% level is indicated by ∗∗∗ p < 0.01, ∗∗ p < 0.05, ∗ p < 0.1, respectively.
With cooling weather from summer to autumn, pools are a particularly season-
based appliance that can enable early conservation in the trial. As control households
stop using pools into autumn, they start looking more like treatment households
whose reduction in pool water usage was accelerated in weeks 1-4 of the trial. Con-
sistent with this interpretation, panel (b) shows pools no longer mediate treatment
effects by weeks 9-12 of the trial. In contrast, spas (hot tubs) and lawn-based water
usage mediate treatment effects in weeks 9-12, both continuing through winter.
4.3 Achieving goals
The survey and experimental evidence on behaviors and trial effects point to Water-
Saver inducing genuine behavioral change. Yet, as with all goals-based trials, there
is the concern that we pay households who, for idiosyncratic reasons: (1) have high
baseline usage before the trial; or (2) have abnormally low usage during the trial (e.g.,
they go on vacation). In this pessimistic scenario, WaterSaver rewards people based
on shocks to individual circumstances, not for behavioral change.
which is why we do not see these self-reported behaviors in Figure 7 above.
21Figure 8: WaterSaver Impacts Goals Success Rates
1 (a) Treatment Groups with All Households (b) Treatment Groups with Compliers Only
1
Easy Goal + Badge Easy Goal + $10
.9
.9
Hard Goal + Badge Hard Goal + $10
Fraction of Households Meeting Their Goal
Fraction of Households Meeting Their Goal
Control - Easy Goal Control - Hard Goal
.8
.8
.7
.7
.6
.6
.5
.5
.4
.4
.3
.3
.2
.2
.1
.1
0
0
1 2 3 4 5 6 7 8 9 10 11 12 1 2 3 4 5 6 7 8 9 10 11 12
Week of Trial Week of Trial
Figure 8 provides evidence that households indeed change their behavior with
WaterSaver to achieve goals. Panel (a) plots the share of households achieving their
water usage goal each week across the treatment and control groups. For the treat-
ment groups, we compare households’ actual water usage to their goal, depending on
whether they face easy or hard goals.20 Panel (a) shows goal success rates initially
range between 60 and 70% in trial groups 1-4 at the start of the trial. These rates
gradually fall to around 50% by the end of the trial. Auxiliary regressions confirm no
statistical differences in weekly goal success rates across treatment groups.
There are, however, large differences in goal success rates between treatment and
control. As with non-compliers, we compute goal success rates for our control group
by comparing households’ actual water usage to what their goals would have been
under our easy and hard goals specifications. Throughout the trial, the success rate
for control households would have been between 30% and 50%. These rates are well
below those of treatment households. We confirm these differences are statistically
significant below.
Panel (b) is analogous to Panel (a), except it plots goal success rates for compliers
only (e.g., treatment households who selected into downloaded the app). We find even
higher success rates, ranging from 70-80% of treatment households achieving goals
early in the trial, falling to 50-60% by the end of the trial. These success rates are,
however, well-above above those of the control group, again pointing to WaterSaver
inducing genuine behavioral change.
20
Importantly, this includes both compliers who downloaded the app and non-compliers who did
not. We can compute the hypothetical easy and hard goals for the latter households from their
baseline water usage. With these hypothetical goals, we can examine their success rate as if they
had downloaded the app.
22Dynamics of reaching goals within weeks
The high-frequency consumption and goals data allow us to examine how households’
average daily water usage evolves day-to-day, and the influence of WaterSaver goals
throughout the week. To identify these dynamics, we estimate the following linear
probability model
6
X
1{success}it = β0 + [βj (1{dowj } × 1{W S}it ) + δj 1{dowj }] + ϵit , (6)
j=1
where δj quantifies the goal success rate among the control group on day of week j
and βj is the increase in this rate among households with the WaterSavers app. We
estimate (6) separately for easy and hard goals. For the former, we include households
in treatment conditions 1 (easy goals + badge) and 2 (easy goals + $10) and control
households under easy goals. For hard goals, we instead include households under
treatment conditions 3 (hard goals + badge) and 4 (hard goals + $10) with control
households under hard goals. We focus on the LATE of WaterSaver on goals success
and not the ITT effect because we are interested in establishing app-induced dynamics
in goal attainment. So, we estimate (6) by 2SLS, with 1{dowj } × 1{Download W S}it
for j = 1, . . . , 6 as the variable of interest, instrumentign with 1{dowj } × 1{W S}it
for j = 1, . . . , 6.
Figure 9 presents our dynamic goal attainment results from Sunday to Saturday,
per the WaterSaver challenge design.21 Two key findings stand out. First, the level
differences in goal attainment between treatment and control are large and statisti-
cally significant, in-line with Figure 8. Second, there is a distinct contrast in the time
path of goal attainment rates during WaterSaver challenges. For the control group,
the path is flat. This pattern establishes that there are no confounding within-week
changes in water consumption that could otherwise be construed as goals-driven dy-
namics.
In stark contrast, there is a clear upward trend in goal attainment for households
with WaterSaver. For example, at the start of a challenge on Sundays, households
have already adjusted behavior such that 63% have average daily water usage below
their weekly target level. However, this rate gradually rises throughout the week
21
We focus on goal success rates among hard goals for brevity. Figure 8 above shows little difference
between hard and easy goals regarding success rates. Statistically, they are indistinguishable.
23Figure 9: Impact of WaterSavers on Goals Achievement by Day of Week
0.8
Share of Households Reaching Their Goal
0.6 0.7
Treatment Control
90% CI 90% CI
0.4 0.5 0.3
Sun Mon Tue Wed Thu Fri Sat
Day of Week
to 76% by the end of the challenge on Saturday, a 13 pp (or 20%) increase in the
goal success rate that is statistically significant (p < 0.05) compared to Sunday’s
success rate. This dynamic, particularly when compared to the control group, further
illustrates that weekly WaterSaver information and incentives induced households to
pursue their goals.
4.4 Redeeming incentives
In this final section, we examine a potential reason the $10 gift card is ineffective in
inducing conservation. In developing the trial with our partner utility, the belief was
that a $10 per week incentive was economically large and would thus matter.
There are, of course, various potential explanations for why the (near) cash in-
centive had little impact. Our reward redemption data sheds light on one particular
mechanism, reflecting a “last mile” problem with incentives. We illustrate this prob-
lem in Figure 10. Panel (a) plots the cumulative number of rewards we should have
paid out in each trial group over time (dashed lines) and redeemed rewards (solid
line). To take a specific example, households in the Easy Goal + Badge group earned
nearly 1000 rewards total, yet only 200 were redeemed.22
22
Recall from Figure 2 above, to redeem a reward, a household must click the “redeem” button
under the rewards tab on the WaterSaver app.
24Figure 10: WaterSaver Rewards Generated and Redeemed by Trial Group
20 30 40 50 60 70 80 90 100
Water Savers
Rewards Redemptions Trial Ends Easy Goal + Badge Water Savers
1000
Easy Goal + Badge Easy Goal + Badge Easy Goal + $10
Trial Ends
Number of Rewards Earned/Redeemed
Easy Goal + $10 Easy Goal + $10 Hard Goal + Badge
Percentage of Rewards Redeemed
Hard Goal + Badge Hard Goal + Badge Hard Goal + $10
Hard Goal + $10 Hard Goal + $10
800
Rewards Earned
400 600
Rewards Redeemed
200
10
0
0
Mar 1 Apr 1 May 1 Jun 1 Mar 1 Apr 1 May 1 Jun 1
Date Date
Panel (b) builds from panel (a) and plots the share of rewards redeemed over the
trial. We find households redeem nearly 50% of $10 rewards under the hard goal
condition and 30% under easy goals, a statistically significant difference (p < 0.01).
In stark contrast, households redeem just 20% of the digital badges under either hard
or easy goals (a statistically insignificant difference). These lower redemption rates
are statistically different from the higher redemption rates with $10 rewards. These
results illustrate that money indeed matters. However, the redemption rates under
$10 rewards are far from 100%, illustrating how small effort costs in clicking an app’s
button to claim $10 rewards hinder uptake. Such small costs potentially undermine
the effectiveness of monetary rewards in incentivizing households to achieve their
goals and reduce water usage.
5 Conclusion
We have reported results from a field experiment in water usage that moves beyond
bill-based nudges to smart meter and app-enabled daily nudges and incentives for
conservation. Our intervention delivers substantial, 8% (ITT) daily conservation
effects in the trial’s first month that wane over time. However, higher frequency data
reveal conservation effects throughout the trial between 3 and 6 pm.
Our examination of underlying behavioral mechanisms highlights how our inter-
vention shifts seasonal water usage. In particular, it accelerates treatment households’
25reductions in outdoor water usage when moving from summer into autumn. We
also establish our weekly goals-based implementation for incentives anchor and affect
within-week consumption dynamics. Lastly, we find significant friction in households’
ability to redeem cash-like rewards despite needing only to touch a button to redeem
them. We view this finding as underlining automatic reward payment to incentivize
behavioral change.
References
Allcott, Hunt, “Social Norms and Energy Conservation,” Journal of Public Eco-
nomics, 2011, 95 (9-10), 1082–1095.
and Judd B. Kessler, “The Welfare Effects of Nudges: A Case Study of Energy
Use Social Comparisons,” American Economic Journal: Applied Economics, 2019,
11 (1), 236–276.
and Todd Rogers, “The Short-Run and Long-Run Effects of Behavioral Inter-
ventions: Experimental Evidence from Energy Conservation,” American Economic
Review, 2014, 104 (10), 3003–3037.
Andor, Mark A., Andreas Gerster, and Jorg Peters, “Information Campaigns
for Residential Energy Conservation,” European Economic Review, 2022, 104094.
Angrist, Joshua D., Guido W. Imbens, and Donald B. Rubin, “Identification
of Causal Effects Using Instrumental Variables,” Journal of the American Statistical
Association, 1996, 91 (434), 444–455.
Burlig, Fiona, Chris Knittel, David S. Rapson, Mar Reguant, and Cather-
ine Wolfram, “Machine Learning from School About Energy Efficiency,” Journal
of the Association of Environmental and Resource Economists, 2020, 7 (6), 1181–
1217.
Byrne, David P., Andrea La Nauze, and Leslie A. Martin, “Tell Me Something
I Don’t Already Know: Informedness and the Impact of Information Programs,”
Review of Economics and Statistics, 2018, 100 (3), 510–527.
26Costa, Dora and Matthew E. Kahn, “Energy Conservation “Nudges” and Envi-
ronmentalist Ideology: Evidence from a Randomized Residential Electricity Field
Experiment,” Journal of the European Economic Association, 2013, 11 (3), 680–
702.
Ferraro, Paul J. and Michael K. Price, “Using Nonpecuniary Strategies to In-
fluence Behavior: Evidence from a Large-Scale Field Experiment,” Review of Eco-
nomics and Statistics, 2013, 95 (1), 64–73.
Gelbach, Jonah B., “When Do Covariates Matter? And Which Ones, and How
Much?,” Journal of Labor Economics, 2016, 34 (2), 509–543.
Tiefenbeck, Verena, Lorenz Goette, Kathrin Degen, Vojkan Tasic, Elgar
Fleisch, Rafael Lalive, and Thorsten Staake, “Overcoming Salience Bias: How
Real-Time Feedback Foster Resource Conservatioj,” Management Science, 2018, 64
(3), 1458–1476.
Wichman, Casey J., “Information Provision and Consumer Behavior: A Natural
Experiment in Billing Frequency,” Journal of Public Economics, 2017, 152 (3),
13–33.
27For Online Publication
A Supplemental figures and tables
Table A.1: Selection - Summary Statistics for Representative and Trial Samples
Random Accounts Accounts in
Sample with Smart Diff. Water Saver Diff. Diff.
of Accounts Shower Metres (2)-(1) Trial (4)-(1) (4)-(2)
(1) (2) (3) (4) (5) (6)
Panel A: 2021-22 Water Usage (KL)
Annual 151.20 175.58 24.38∗∗∗ 181.49 30.29∗∗∗ 5.91
Quarter 1 32.74 36.33 3.60∗∗∗ 38.20 5.46∗∗∗ 1.87∗
Quarter 2 36.54 42.77 6.23∗∗∗ 44.42 7.87∗∗∗ 1.65
Quarter 3 44.84 51.57 6.73∗∗∗ 52.26 7.42∗∗∗ 0.69
Quarter 4 37.08 44.90 7.82∗∗∗ 46.62 9.53∗∗∗ 1.72
Panel B: Account Characteristics
Percent of accounts classified as . . .
Owner occupier 75.99 73.85 -2.14∗∗ 79.93 3.94** 6.08∗∗∗
Concession 22.08 14.75 -7.33∗∗∗ 18.21 -3.87** 3.64∗∗∗
Electronic billing 52.25 66.88 14.64∗∗∗ 76.29 24.04∗∗∗ 9.41∗∗∗
SEW portal users 39.59 47.35 7.75∗∗∗ 55.60 16.01∗∗∗ 8.25∗∗∗
Panel C: Demographics
Average weekly income ($) 623.79 669.04 45.25∗∗∗ 666.56 42.77∗∗∗ -2.48
Average age 53.35 49.98 -3.37∗∗∗ 51.23 -2.12∗∗∗ 1.25∗∗
Percent with higher education 20.02 21.51 1.49∗∗∗ 21.46 1.44∗∗ -0.05
Percent employed 39.01 42.73 3.72∗∗∗ 42.71 3.70∗∗∗ -0.02
Percent with children 65.24 61.73 -3.52∗∗∗ 62.04 -3.20∗∗∗ 0.31
Average number of rooms in home 2.95 2.86 -0.09∗∗∗ 2.87 -0.08∗∗∗ 0.01
Observations 8613 7063 965
Notes: Statistical significance of the difference in means at the 1%, 5%, and 10% level is indicated by ∗∗∗ p < 0.01,∗∗ p <
0.05,∗ p < 0.1, respectively. Demographics correspond to those from an account’s ABS Statistical Area 1 census block
level. All other variables are at the individual account-level.
28You can also read