Climate Change Risk Assessment for Kurunegala, Sri Lanka: Water and Heat Waves
←
→
Page content transcription
If your browser does not render page correctly, please read the page content below

climate
Article
Climate Change Risk Assessment for Kurunegala,
Sri Lanka: Water and Heat Waves
Hanna Cho
 Korea Adaptation Center for Climate Change, Korea Environment Institute, 232 Gareum-ro, Sejong 30121, Korea;
 hncho@kei.re.kr

 Received: 2 November 2020; Accepted: 24 November 2020; Published: 27 November 2020

 Abstract: Sri Lanka is experiencing various social and environmental challenges, including drought,
 storms, floods, and landslides, due to climate change. One of Sri Lanka’s biggest cities, Kurunegala, is a
 densely populated city that is gradually turning into an economic revitalization area. This fast-growing
 city needs to establish an integrated urban plan that takes into account the risks of climate change.
 Thus, a climate change risk assessment was conducted for both the water and heat wave risks
 via discussions with key stakeholders. The risk assessment was conducted as a survey based on
 expert assessment of local conditions, with awareness surveys taken by residents, especially women.
 The assessment determined that the lack of drinking water was the biggest issue, a problem that
 has become more serious due to recent droughts caused by climate change and insufficient water
 management. In addition, the outbreak of diseases caused by heat waves was identified as a serious
 concern. Risk assessment is integral to developing an action plan for minimizing the damage from
 climate change. It is necessary to support education and awareness in developing countries so that
 they can perform risk assessment well and develop both problem-solving and policy-making abilities
 to adapt to a changing climate.

 Keywords: climate change adaptation; climate change risk assessment; climate resilience; Kurunegala;
 risk factors of water; heat waves

1. Introduction
     Sri Lanka is an island located in the Indian Ocean (Figure 1), which is affected by various natural
hazards, including weather-related events, such as cyclones, monsoonal rain and subsequent flooding,
and landslides [1]. Sri Lanka has experienced significant and systematic atmosphere warming in all
regions [2]. Sri Lanka was one of the countries most affected by climate change in 2018 [3]. The year
2018 began with severe monsoon rains from 20 to 26 May, affecting 20 districts, resulting in at least
24 deaths, more than 170,000 people affected, and nearly 6000 people displaced [4].
     Sri Lanka has a total area of 65,610 km2 and a population of 21.8 million, including 3.704 million
urban residents living in 64 municipal areas [5]. It is a lower-middle-income country, with a GDP per
capita of USD 3853 (2019). Following 30 years of civil war that ended in 2009, the economy grew at an
average of 5.3% from 2010–2019 [6]. The country’s propitious location favored rapid development
projects, such as mega cities, airports, harbors, urban beautification projects, and major highways,
during the last ten years [7].
     Kurunegala, located in the north-western province, was once the capital of one of the ancient
Kingdoms of Sri Lanka. The city is now the capital of the Kurunegala District and is experiencing rapid
growth and development [5], with its main economic sectors based on service and industry [8]. This city
is one of the most intensively developed economic and administrative capitals in the north-western
Province of Sri Lanka, and it is one of the central cities directly connected to a number of other major
capital cities and towns.

Climate 2020, 8, 140; doi:10.3390/cli8120140                                    www.mdpi.com/journal/climate
Climate 2020, 8, x FOR PEER REVIEW 2 of 20
north-western
Climate 2020, 8, 140Province of Sri Lanka, and it is one of the central cities directly connected to a number
2 of 21
of other major capital cities and towns.
(a) (b)
Figure
Figure 1.
1. Location
Locationof
ofKurunegala
Kurunegala (a)
(a) and
andthe
theexpansion
expansion in
in Kurunegala
Kurunegala city
city (b)
(b) (1995–2017)
(1995–2017) (The
(The state
state
of
of Sri
Sri Lankan
Lankan Cities,
Cities, 2018).
2018).
Most urban systems
Most systems in inKurunegala
Kurunegalaare arevulnerable
vulnerabletoto the impacts
the impacts of of
climate
climatechange
changeandandthe the
citycity
has
faced
has challenges
faced whilewhile
challenges attempting to adapt
attempting to to climate
adapt change. change.
to climate There is There
an increased need to build
is an increased need with
to
increased risk resilience and develop more and diverse adaptation measures
build with increased risk resilience and develop more and diverse adaptation measures to protect to protect the economic
andeconomic
the social wellbeing
and socialof city dwellers.ofTo
wellbeing develop
city dwellers.a climate changeaadaptation
To develop climate changeplan, several
adaptationprocesses
plan,
are needed,
several i.e., analysis
processes of climate
are needed, changeofimpacts,
i.e., analysis climate vulnerability
change impacts, assessments,
vulnerabilityandassessments,
risk assessments and
are all key processes needed to develop this plan [9–16]. Assessment and analysis
risk assessments are all key processes needed to develop this plan [9–16]. Assessment and analysis of of current and future
climate and
current change risksclimate
future and vulnerabilities
change risksare andrequired for the development
vulnerabilities are required of forrobust climate change
the development of
adaptation
robust policies.
climate change They inform policy
adaptation decision-makers
policies. They inform of the potential
policy effects ofofclimate
decision-makers change,
the potential
such that
effects their results
of climate cansuch
change, be used
thatto choose
their among
results can beavailable
used tostrategies and their
choose among associated
available technical
strategies and
and social
their planstechnical
associated for climateandchange
social adaptation.
plans for climate change adaptation.
Therefore, this
Therefore, this study
study aims
aims to to conduct
conduct aa climate
climate change
change risk
risk assessment,
assessment, the the results
results of
of which
which will
will
be used
be used for
for the
the development
development of of aa climate
climate change
change adaptation
adaptation planplan for
for Kurunegala
Kurunegala City. City. This
This process
process
can also
can also improve
improve the the climate
climate resilience of other local cities that are vulnerable to climate change.
2. Materials
2. Materialsand
andMethods
Methods
Kurunegala city
Kurunegala city is
is aa densely
densely built
built residential,
residential, business,
business, and
and commercial
commercial area,
area, with
with aa constantly
constantly
increasing traffic volume and a significantly decreasing amount of green
increasing traffic volume and a significantly decreasing amount of green space. Kurunegala city space. Kurunegala city is
is
one of the sprawling cities [5]. Urban sprawl is typically defined as unplanned
one of the sprawling cities [5]. Urban sprawl is typically defined as unplanned and uncoordinated and uncoordinated
low density
low density expansion
expansion and andinvolves
involvesrapidrapidland
land consumption
consumption as rural spaces
as rural transition
spaces to urban
transition land
to urban
use [17]. Urban sprawl can be observed in the Kurunegala city, as demonstrated
land use [17]. Urban sprawl can be observed in the Kurunegala city, as demonstrated by satellite by satellite images
from 1995,
images from2001, 2012,
1995, 2017
2001, (Figure
2012, 20171).(Figure
In 1995,1).the
Inimage
1995, shows a very
the image smallaurban
shows space,urban
very small concentrated
space,
in a few areas at the center of the municipal council area. By 2007, we
concentrated in a few areas at the center of the municipal council area. By 2007, we can seecan see significant sprawling
expansion sprawling
significant in urban and semi-urban
expansion areas.and semi-urban areas.
in urban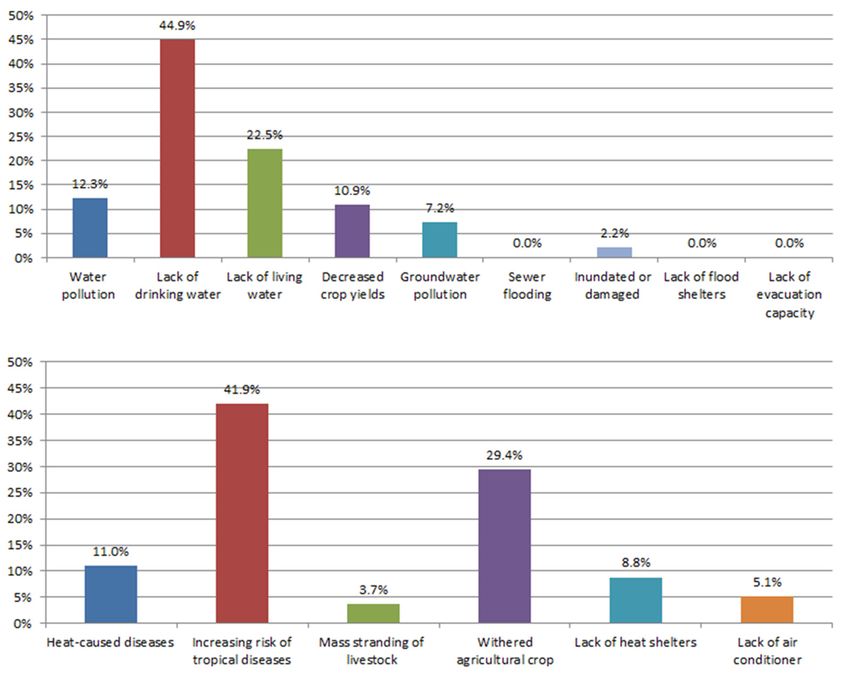
Climate 2020, 8, 140                                                                                3 of 21

     The city’s climate remains hot throughout the year and is exacerbated by the rock outcrops
surrounding the city, which retain heat during the day. Through the data of the past 10 years, the highest
mean monthly temperature was observed during the month of May (26.82 ◦ C), whereas relatively-cooler
temperature was experienced in January (23.45 ◦ C). Similar to the nation-wide trend, air temperature in
Kurunegala exhibited a general increase. In the year 2016, the mean annual temperature in Kurunegala
was 25.92 ◦ C, which is 0.08 to 1.25 ◦ C higher as compared with the previous year [18]. Monsoons occur
from May to August and again from October to January. The average annual rainfall in Kurunegala is
approximately 2000 mm [2,5]. Sri Lanka experienced a nation-wide drought from the beginning of the
year 2016 up to the year 2017. Increase in temperature and lack of rainfall resulted in massive damage
in the agricultural produce of the country, especially in the north-western region. Only 458 mm of
cumulative rainfall was experienced in Kurunegala in the year 2016. This value was almost 45% lower
as compared with the decadal average rainfall experienced in Kurunegala [18]. The city is facing
socio-spatial climate vulnerabilities, with the most crucial being extreme heat conditions, periods of
flooding, disaster-related public health crises, a decrease in drinking water reserves, and groundwater
pollution [9–12].
     Climate change risk assessments are conducted to understand how current and projected risk
factors impact a community and are a key element of climate change adaptation policy development.
They inform policy decision-makers of the potential risks of climate change and provide them with
means to evaluate its impacts, as well as to compare different strategies and policies.
     For the assessment of climate change risk and vulnerability at the community level, various
methods have been studied and performed [10–16,19–22]. In South Korea, both quantitative and
qualitative data, as well as information to characterize socio-ecological systems, are required, as both
current and predicted risks and vulnerabilities caused by climate change should be included in the
assessment [10–12,15,23]. Collecting enough data to understand the impact of climate change in
Kurunegala city is difficult; therefore, the assessment focuses on the qualitative method. Quantitative
assessment using scientific physical parameters is also needed to increase the accuracy of risk
identification in the future.
     The qualitative method is a survey-based assessment approach and includes several steps to solve
the problem. The purpose of the survey-based assessment approach is to prioritize the risk factors that
present the latest problems in Kurunegala city.
     The risk assessment was carried out via the following steps.

2.1. Step 1: Establish the Context
     This stage determines the subject area and purpose. The target area for risk assessment is
Kurunegala city, where the risk assessment is limited to water and heat wave problems and is based on
key stakeholder information and field observations.

2.2. Step 2: Identify the Risks
     This step confirms what the types of risks are. To identify the most serious risk in terms of water
management and heat stress in Kurunegala city, a detailed set of indicators should be established.
Based on Korean examples [23–29], the Kurunegala Municipal Council (KMC) developed their own
indicators considering the current situation within their city. KMC developed the following indicators.
The difference in Korea’s case is that there are no DWR and SDF indicators there. The discovery of
indicators for drinking water and sanitation is solely a reflection of the situation in Kurunegala city,
Sri Lanka.

1.    Drinking water resources risk/vulnerability to drought (DWR); Risk or vulnerability on sources
      of useful or potentially useful portable water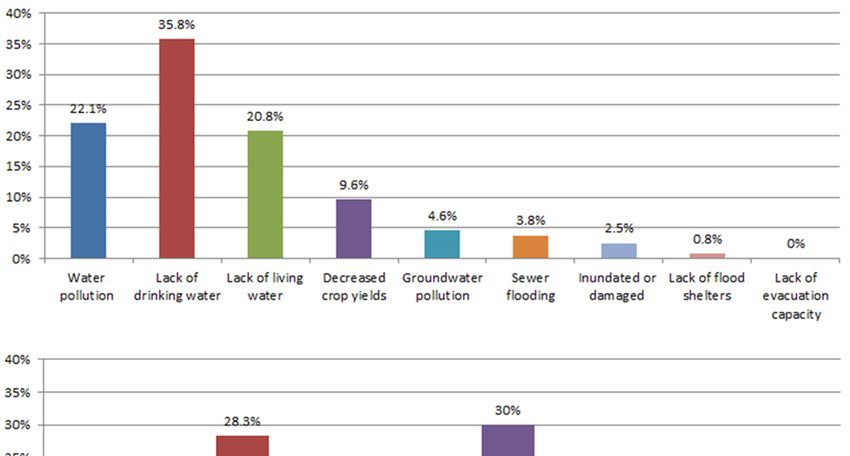
Climate 2020, 8, 140                                                                                     4 of 21

2.    Water management risk/vulnerability (WM); Risk or vulnerability on water management that is
      the control and movement of water resources to minimize damage to life and property and to
      maximize efficient, beneficial use
3.    Water quality and aquatic ecosystems (WQAE); Risk or vulnerability on water quality and the
      condition or health of waterways, like rivers, wetlands
4.    Water resources risk/vulnerability (WR); Risk or vulnerability on resource of water that is useful or
      potentially useful, for agricultural, industrial, household, recreational and environmental activities
5.    Sanitation risk/vulnerability to droughts and floods (SDF); Risk or vulnerability on sanitation,
      which is the process of keeping places clean and healthy, especially by providing a sewage system
      and a clean water supply, due to drought and flood
6.    Health risk/vulnerability to floods (HF); Risk or vulnerability of health that is impacted by flood
7.    Health and infrastructure risk/vulnerability to heat stress (HIH); Risk or vulnerability on health
      and infrastructure that is impacted by heat stress and drought

2.3. Step 3: Analyze the Risks
      Detailed risk factors for each indicator should be analyzed to prioritize the risks of climate change
in Kurunegala city. The 84 risk factors determined to be indicators were collected from the Korean
national and municipal climate change assessment. KMC reviewed the list of risk factors and revised it
to suit their city. Experts and environment ministry officials in the Kurunegala modified and excavated
indicators reflecting the characteristics of the city. A total of 57 risk factors were finalized for Kurunegala
city (Appendix A).

2.4. Step 4: Evaluate the Risks
     For the planning, an adaptation action plan for Kurunegala city, we needed to prioritize the
risks and find the largest and most serious climate change impacts. Basically, it should be evaluated
using objective and quantitative data and information. If quantitative assessment is difficult, it can be
diagnosed and predict regional risks through qualitative methods of collecting opinions and discussing
them at T/F meetings, expert advice, workshops, etc., using data collected through statistical data,
interviews with officials, and surveys. Therefore, a survey was conducted to evaluate the priority of
these risk factors because of the lack of quantitative data.
     Although it is difficult to quantitatively express the risks of climate change, this study attempted
to evaluate climate change with as much objectivity as possible to prepare for its effects. According to
the Intergovernmental Panel on Climate Change 5th Assessment Report (IPCC AR5), risk is correlated
with “Vulnerability”, “Exposure”, and “Hazard”. Risk is often represented as the probability of an
occurrence of hazardous events multiplied by the impacts of these events [30].
     Seven indicators and fifty-seven risk factors related to water and heat waves were agreed upon
through a meeting between key KMC stakeholders and the Sri Lankan Ministry of Environment.
The probability of occurrence and impact of 57 risk factors were each measured on a five-point scale
by 35 experts in Kurunegala city. The expert survey was conducted at the Consultant Workshop on
17–19 July 2019. Experts are water and heat wave experts who have been well aware of the current
state of Kurunegala city for more than five years recommended by the KMC. The criteria for five-point
scale are presented in Tables 1 and 2. Based on the average value of the experts for each indicator,
the score was calculated by multiplying these values, and then each indicator and risk factor were
ranked (Tables A1–A7).
     Generally, adaptation plans should be established in various fields, including water, ecosystem,
land use, agriculture, fisheries, and industry, etc. As cooperation from multiple ministries is needed,
opinions from experts in other areas should also be collected. Therefore, a climate change awareness
survey from stakeholders was conducted. They are 23 experts in the fields of environment, land use,
health and forestry, etc., recommended by the KMC.
Climate 2020, 8, 140                                                                                               5 of 21

                               Table 1. Guidance on possibility of occurrence (Scale).

                              Category                     Score              Evaluation Criteria
                                                       Very Severe (5)        Very likely to occur
                                                         Severe (4)             Likely to occur
                       Possibility of Occurrence        Moderate (3)               May occur
                                                          Low (2)           Low possibility to occur
                                                        Very Low (1)          Not likely to occur

                                           Table 2. Guidance on impacts (Scale).

      Category               Score                                       Evaluation Criteria

                                              •    Severe and repeated damage to infrastructure and property
                                              •    Serious disruption in providing community services
                                              •    Overall impacts on vulnerable classes of the society
                         Very Severe (5)      •    Extensive damage to the ecosystem
                                              •    Influence the personal identity of individuals
                                              •    Detrimental influence on all parts and sectors of the society

                           Severe (4)         •    More severe than ‘Moderate’, yet less intense than ‘Very Severe’

                                              •    Damage to infrastructure or property
    Impact (scale)                            •    Expanded social Inequality
                                              •    Serious disruption in providing community services
                          Moderate (3)        •    Mobilization of emergency services
                                              •    Damage of ecosystems
                                              •    Slight influence the personal identity of individuals
                                              •    Detrimental influence on all parts and sectors of the society

                            Low (2)           •    More severe than ‘Very Low’, yet less intense than ‘Moderate’

                                              •    Mild impacts
                                              •    Minor impacts on the economy
                          Very Low (1)        •    Short-term, recoverable impact on the ecosystem
                                              •    Damage on not many personnel
                                              •    Tolerable damages

     A climate change awareness survey from women was also conducted, aiming to identify the
impact of climate change on residents living there. In developing countries, the gender problem needs
to be considered, and the damage caused by climate change can be more vulnerable to women and
children [31,32]. The survey collected opinions from 40 women on the most serious climate-related
problems in the city and the adaptation measures that the residents think are most needed. They are
people of various occupations, including transportation, sales, self-employed, housewives, and students,
and were conducted on-site surveys led by the KMC. We obtained their perspectives on the impact of
climate change, as well as ideas on how to reduce this impact.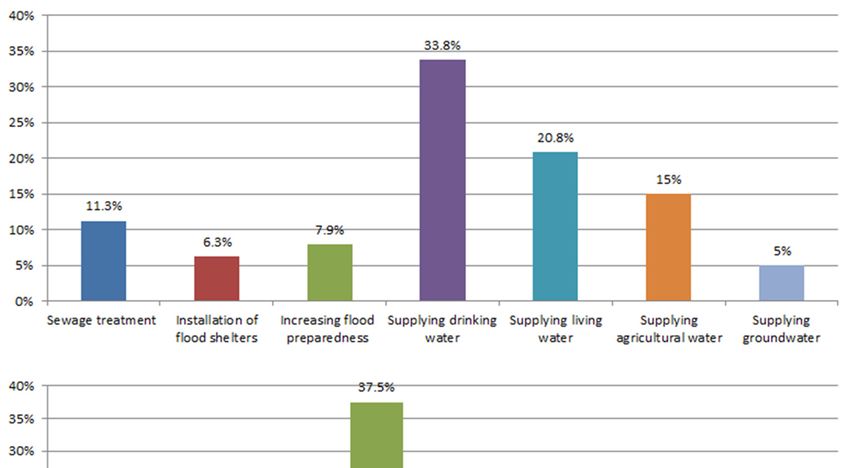
Climate 2020, 8, 140                                                                                  6 of 21

3. Results

3.1. Survey-Based Approach Assessment with Experts
      The top 10 among the 57 risk factors of the seven indicators were analyzed. When all risk factors
are compared, ‘Lack of drinking water resources due to drought’ is considered to be an exceptional
risk factor (Table 3). When comparing DWR01 and WR01, the probability of DWR01 occurrence was
lower than that of WR01, but its impact on the city was significant. This indicates that the lack of water
is a serious problem; securing drinking water is the top priority of the climate change adaptation plan
in Kurunegala city (Figure 1). The risk factors in TOP 10 are in DWR, WR, and HIH; therefore, we can
observe that severe drought, water scarcity, and heat stress are the largest concerns for water and heat
experts and policymakers of Kurunegala City (Table 3, Figure 2).

                                             Table 3. Rank of risk factors.

   Code                Risk Factor            Avg. Possibility of Occurrence   Avg. Impact   Score   Rank
                 Lack of drinking water
  DWR01                                                     3.86                  4.14       15.98    1
                resources due to drought
               Lack of water for building
   WR01            maintenance and                          4.03                  3.91       15.76    2
                     management
               Drying streams and water
  WM08            bodies (natural and                       3.94                  3.83       15.09    3
               artificial) due to drought
               Decrease in national water
   WR07        supply capacity due to the                   3.89                  3.74       14.55    4
               changes in rainfall pattern
               Reduced function of green
               space and increased loss of
  HIH02                                                     3.86                  3.71       14.32    5
                   green cover due to
                       heat stress
                Increased irregularity in
   WR10           water supply among                        3.76                  3.79       14.25    6
                 regions due to drought
               Increase in water demand
   WR05        due to the increase in crop                  3.83                  3.66       14.02    7
                  evapotranspiration
               Increase in water demand
   WR06         for livestock and animal                    3.56                  3.47       12.35    8
               husbandry due to drought
                  Uncontrolled use of
   WR09         groundwater due to lack                      3.6                  3.43       12.35    9
                      of water
                Increased frequency of
  WM11         drought due to persistent                     3.6                   3.4       12.24    10
                non-precipitation days

     Moreover, its impact is of high concern to local experts in Kurunegala. Sri Lanka has been
experiencing an ongoing drought since the beginning of 2016. In recent months, approximately
one million people across the country have been affected by the drought [18]. Kurunegala city was
specifically noted as the most damaged of the nine provincial Sri Lankan capital cities by drought
between 1974 and 2017 [33]. Through interviews with residents, it was understood that as many as
three to four months of severe drought each year have occurred in recent years.
Climate 2020, 8, 140 7 of 21
Climate 2020, 8, x FOR PEER REVIEW 7 of 20
Climate 2020, 8, x FOR PEER REVIEW 7 of 20
Figure Top 10
Figure 2. Top 10 risk
riskfactors.
factors.
AsAsmentioned
mentioned before, there
before, is noisindicator
there of drinking
no indicator
Figure 2. Top 10 of water resources
riskdrinking
factors. in Korea.
water resources in These
Korea.differences
These
relate to the basic
differences relatemanagement of drinkingofwater
to the basic management andwater
drinking the securing of waterof
and the securing resources. In addition
water resources. In
to addition
drought, tothere
drought,
As mentioned there
are also are
problems
before, therealsoisproblems
with
no water with water
supply
indicator of supplywater
facilities
drinking facilities
and water and water
treatment
resources treatment in
in developing
in Korea. These
developing
countries (Table
differences countries (Table
4, Figure
relate to the 3). 4,management
basic Figure 3). of drinking water and the securing of water resources. In
addition to drought, there are also problems with water supply facilities and water treatment in
developing countriesTable Table4.4.4,Rank
(Table Rank of DWR
of
Figure DWR (drinking water
3). (drinking waterresources)
resources)risk
riskfactors.
factors.
Code Risk Factor Avg. Possibility Avg. Possibility
of Occurrence Avg.
Code Risk
Table Factor
4. Rank of DWR (drinking water resources) risk Avg. Impact
factors. Score Rank
Score Rank
of Occurrence Impact
Lack of drinking water
DWR01 3.86 4.14 15.98
DWR01
Code Lack of drinking
resources due towater resources
Factor due to drought
drought
Risk
Avg. Possibility
3.86 Avg.
4.14 15.98
Score 11
Rank
of Occurrence Impact
DWR02 Disruption
Disruption of of drinking water facilities
drinking 2.71 2.74 7.43 2
DWR02 2.71 2.74 7.43 2
DWR01 Lack ofwater
drinking water resources due to drought
facilities 3.86 4.14 15.98 1
DWR03 Hindrance to water treatment efforts 2.37 2.34 5.55 3
DWR02 Disruption
Hindrance to ofwater
drinking water facilities 2.71 2.74 7.43 2
DWR03 2.37 2.34 5.55 3
DWR03 treatment efforts
Hindrance to water treatment efforts 2.37 2.34 5.55 3
Figure 3. Risk to DWR (drinking water resources).
In the “Water resources” category,
Figure Risk “Lack of(drinking
water for building maintenance and management”
Figure 3.3. Risk to DWR
to DWR (drinkingwater
waterresources).
resources).
and “Decrease in national water supply capacity due to rainfall pattern change” are high-effect
factors,
InIn
the which
the“Water indicates
“Water thatcategory,
resources”
resources” Kurunegala
category, cityofinfrastructure
“Lack
“Lack water for
water requires
forbuilding
building the maintenance
maintenance
maintenance andand and local
management”
management”
leaders
and
and to
“Decrease
“Decrease consider climate
in national
in national change
water
water as
supply
supply a high risk.
capacity
capacity duedue In contrast, “Loss
to rainfall
to rainfall pattern
pattern of fisheries
change”
change” because offactors,
the
are high-effect
are high-effect
increase
factors,
which in harmful
which
indicates organisms
indicates
that (i.e.,
cityred
that Kurunegala
Kurunegala tides
city and jellyfish)
requiresdue
infrastructure
infrastructure to
requires
the thethe
increase
maintenance in average
maintenance
and localand water
local to
leaders
temperature”
leaders to and “Fluctuations
consider climate in spawning
change as a high habitat
risk. and
In season of
contrast, fish,ofmollusks,
“Loss fisheries and crustaceans
because of the in
consider climate change as a high risk. In contrast, “Loss of fisheries because of the increase
increase in harmful organisms (i.e., red tides and jellyfish) due to the increase in
harmful organisms (i.e., red tides and jellyfish) due to the increase in average water temperature” and average water
temperature” and “Fluctuations in spawning habitat and season of fish, mollusks, and crustaceans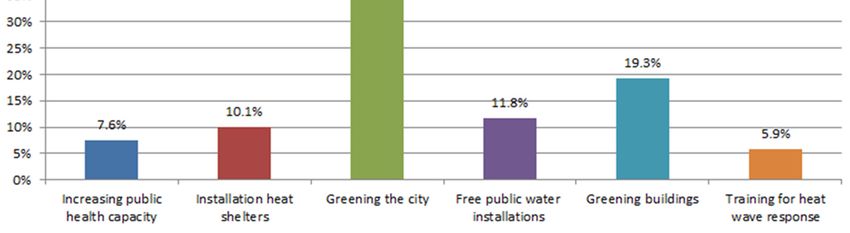
Climate 2020, 8, 140                                                                                               8 of 21

“Fluctuations in spawning habitat and season of fish, mollusks, and crustaceans due to the increase in
water2020,
Climate temperature”  areREVIEW
           8, x FOR PEER  low-effect indicators because Kurunegala is an inland region (Table 5, Figure  4).
                                                                                                    8 of 20

                    Table 5. Rank of WR (water resources risk/vulnerability) risk factors.
due to the increase in water temperature” are low-effect indicators because Kurunegala is an inland
regionCode
       (Table 5, Figure 4).Factor
                     Risk                Avg. Possibility of Occurrence    Avg. Impact     Score Rank
                  Lack of water for building
       WR01            Table 5. Rank
                      maintenance   andof WR (water resources
                                                           4.03risk/vulnerability) risk3.91
                                                                                         factors.    15.76     1
                        management
                                                                    Avg. Possibility    Avg.
Code WR02                      Risk
                    Change in the    Factor
                                   habitat of
                                                             3.14
                                                                                                Score 9Rank
                    aquatic flora and fauna                          of Occurrence 3.06Impact 9.61
           Lack of water
                Loss        for building
                      of fisheries         maintenance and
                                   due to the
WR01                increasemanagement
                              in harmful
                                                                          4.03                3.91     15.76         1
       WR03        organisms (e.g., red tide,                1.91                      2.29          4.37      11
            Change  in thedue
                jellyfish) habitat  of aquatic flora and
                              to average
WR02                                                                      3.14                3.06      9.61         9
                               fauna
                water temperature  rising

     Loss of Fluctuations
             fisheries duein spawning
                              to the increase in harmful
             habitat and season of fish,
WR03   organisms (e.g., red tide, jellyfish) due to                       1.91                2.29      4.37        11
    WR04    mollusks, and crustaceans                2.23                              2.94          6.56      10
           average duewater   temperature rising
                        to rising
      Fluctuationswater
                      intemperature
                         spawning habitat and season
              Increase in water
WR04 of fish, mollusks,         demand
                          and crustaceans due to rising                   2.23                2.94      6.56        10
    WR05        due to increased crop                3.83                              3.66          14.02     4
                      water temperature
                 evapotranspiration
           Increase in water
                Increase       demand
                          in water      due to increased
                                   demand
WR05                                                                      3.83                3.66     14.02         4
       WR06          crop evapotranspiration
                 for livestock and animal               3.56                           3.47          12.35     5
                  husbandry due to drought
           Increase in water demand for livestock and
WR06             Decrease in national water                               3.56                3.47     12.35         5
                animal  husbandry due to drought
       WR07     supply capacity due to the               3.89                          3.74          14.55     2
           Decrease in national
                changes in rainfallwater
                                   patternsupply capacity
WR07                                                                      3.89                3.74     14.55         2
               due Lack
                   to the
                        of changes   in rainfall pattern
                           water for SME
       WR08                                                  3.37                      3.31          11.15     8
                   industries due to drought
             Lack of water for SME industries due to
WR08               Uncontrolled use of                                    3.37                3.31     11.15         8
                             drought
       WR09        groundwater due to lack                    3.6                      3.43          12.35     6
     Uncontrolled use   of groundwater due to lack
                   of water
WR09                                                                       3.6                3.43     12.35         6
                        of waterin
           Increased irregularity
       WR10
        Increasedwater supply among
                  irregularity                      3.76
                                in water supply among                                  3.79          14.25     3
WR10            regions due to drought                                    3.76                3.79     14.25         3
                        regions due to drought
             Change in groundwater
    WR11Change
           level in
                 duegroundwater
                     to the increase level
                                     in    due to the 3.46                             3.31          11.45     7
WR11                                                                      3.46                3.31     11.45         7
                groundwater
              increase         use
                        in groundwater      use

                                          RiskofofWR
                               Figure4.4.Risk
                              Figure              WR(water
                                                     (waterresources
                                                            resourcesrisk/vulnerability).
                                                                      risk/vulnerability).

3.2. Climate Change Awareness Survey
    The purpose of the climate change awareness survey was to understand the actual damage and
impact of climate change that stakeholders and residents actually feel. To analyze the general
Climate 2020,8,8,140
Climate2020,      x FOR PEER REVIEW                                                                          99of
                                                                                                                of21
                                                                                                                   20

population’s climate change awareness, two surveys were conducted. (1) The “Stakeholder survey,”
3.2. Climate Change Awareness Survey
was conducted to determine the views of general residents in Kurunegala. (2) The “Climate change
      The purpose
awareness     surveyoffor
                        thewomen,”
                            climate change   awareness
                                     was aimed           survey was
                                                  at investigating     to understand
                                                                    differences        the actualofdamage
                                                                                in perceptions      climate
and  impact
change        of climate change that stakeholders and residents actually feel. To analyze the general
          by women.
population’s climate change awareness, two surveys were conducted. (1) The “Stakeholder survey”,
3.2.1.conducted
was     Climate Change    Awareness
                  to determine        Survey:
                                the views     Stakeholders
                                          of general  residents in Kurunegala. (2) The “Climate change
awareness    survey for women”,   was  aimed at investigating
       The Climate Change Awareness Survey was taken          differences in perceptions
                                                                 by 23 stakeholders      of climate
                                                                                       who   are allchange
                                                                                                     public
by women.
workers    in Kurunegala.
3.2.1. In  terms of
        Climate      water,Awareness
                  Change    most respondents
                                       Survey: (44.9%)    chose “Lack of drinking water” as the most serious
                                                Stakeholders
 climate change risk while “lack of living water” was the second (22.5%). This result shows that many
      The Climate
 respondents     haveChange   Awareness
                       a significant      Survey
                                      concern  for was
                                                    the taken   byof
                                                         scarcity  23drinking
                                                                       stakeholders  who
                                                                                 water.  Inare all public
                                                                                            contrast,  theworkers
                                                                                                            level of
in  Kurunegala.
 awareness     among those who responded to the flooding and evacuation survey was relatively low
 (0%)In   terms 5,
       (Figure   oftop).
                    water, most respondents (44.9%) chose “Lack of drinking water” as the most serious
climate   change
       Most        risk while(41.9%)
               respondents    “lack ofselected
                                       living water”    was the
                                                “Increasing      second
                                                               risk       (22.5%).diseases”
                                                                     of tropical    This result
                                                                                             as shows   thatserious
                                                                                                 the most     many
respondents      have  a significant concern  for  the  scarcity  of drinking  water.   In contrast,
 climate change risk associated with heat, followed by “Withered agricultural crop” (29.4%).          the  level of
awareness     among   those  who  responded  to the  flooding   and  evacuation  survey   was
 However, as many of the respondents belong to the health department of KMC, they may have a   relatively low  (0%)
(Figure   5, top).
 particular   interest in tropical diseases (Figure 5, bottom).

     Figure
     Figure5.   Most affected
             5. Most affected climate
                              climate change
                                       changerisks
                                              risksininterms
                                                        termsofofwater
                                                                  water(top)
                                                                         (top)and
                                                                               and  heat
                                                                                  heat   (bottom)
                                                                                       (bottom) as as assessed
                                                                                                   assessed  by
     by stakeholders.
     stakeholders.

      Most respondents (41.9%) selected “Increasing risk of tropical diseases” as the most serious climate
       In terms of climate change measures for water, most respondents are concerned with the water
change risk associated with heat, followed by “Withered agricultural crop” (29.4%). However, as many
 supply, with “Supplying drinking water” (42.3%), “Supplying living water” (16.1%), and
of the respondents belong to the health department of KMC, they may have a particular interest in
 “Supplying agricultural water” (16.1%) as their three most critical concerns. People in Kurunegala
tropical diseases (Figure 5, bottom).
 city also ask for increased attention to “Sewage treatment” (16.1%) while there are few demands for
      In terms of climate change measures for water, most respondents are concerned with the water
 the “Installation of flood shelters” (0%) and “Supplying groundwater” (0.7%) (Figure 6, top).
supply, with “Supplying drinking water” (42.3%), “Supplying living water” (16.1%), and “Supplying
       More than half of the respondents chose “Greening the city” (45.4%) as the most desirable
agricultural water” (16.1%) as their three most critical concerns. People in Kurunegala city also ask for
 measure for addressing the heat issue, followed by “Greening buildings” (19.3%). This result shows
 that Kurunegala citizens want to have more green areas in their city (Figure 6, bottom).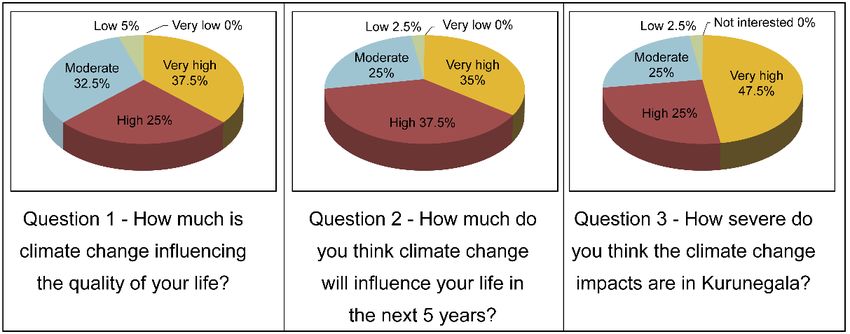
Climate 2020, 8, 140                                                                                  10 of 21

increased attention to “Sewage treatment” (16.1%) while there are few demands for the “Installation of
flood shelters”
Climate             (0%)
        2020, 8, x FOR   andREVIEW
                       PEER  “Supplying groundwater” (0.7%) (Figure 6, top).                   10 of 20

                Most desirable
      Figure 6. Most  desirable climate
                                climate change
                                        change measures
                                               measures for
                                                        for the
                                                            the water
                                                                water (top) and heat (bottom) sectors as
      assessed by stakeholders.

3.2.2.More  thanChange
       Climate   half of the respondents
                         Awareness         chose
                                      Survey:    “Greening the city” (45.4%) as the most desirable measure
                                               Women
for addressing the heat issue, followed by “Greening buildings” (19.3%). This result shows that
      We alsocitizens
Kurunegala     analyzed   climate
                       want        change
                              to have moreawareness
                                            green areasfrom   the city
                                                         in their female  perspective.
                                                                       (Figure         The “climate change
                                                                               6, bottom).
awareness survey for women” was taken by 40 females in Kurunegala, aged 16–75.
3.2.2.Three  main
       Climate      questions
                Change          were Survey:
                          Awareness   utilized Women
                                               to analyze climate change awareness among women in
Kurunegala city. The first question asked about the “level of climate change influence,” where 62.5%
      We also analyzed climate change awareness from the female perspective. The “climate change
of the respondents considered the climate change category as a high risk for their lives (“Very high”:
awareness survey for women” was taken by 40 females in Kurunegala, aged 16–75.
37.5%, “High”: 25%). Meanwhile, climate change is currently considered a huge risk; 72.5% of the
      Three main questions were utilized to analyze climate change awareness among women in
respondents are concerned about climate change in the near future (Question 2, “Very high”: 35%,
Kurunegala city. The first question asked about the “level of climate change influence”, where 62.5%
“High”: 37.5%). Moreover, most of the respondents identify the impacts of climate change as a
of the respondents considered the climate change category as a high risk for their lives (“Very high”:
severe risk to their society in Kurunegala. Almost half of the respondents, 47.5%, believe that the
37.5%, “High”: 25%). Meanwhile, climate change is currently considered a huge risk; 72.5% of the
impacts of climate change are a “Very high” risk and 25% agreed that it is a “High” risk (Figure 7).
respondents are concerned about climate change in the near future (Question 2, “Very high”: 35%,
“High”: 37.5%). Moreover, most of the respondents identify the impacts of climate change as a severe
risk to their society in Kurunegala. Almost half of the respondents, 47.5%, believe that the impacts of
climate change are a “Very high” risk and 25% agreed that it is a “High” risk (Figure 7).
      Similar to our stakeholder survey, most of the women selected “Lack of drinking water” (35.8%)
as the most serious climate change risk, followed by “Lack of living water” (20.8%). In terms of heat,
most women selected “Withered agricultural crop” (30%) as the most serious climate change risk while
“Increasing risk of tropical diseases” (28.3%) (Figure 8) was their second most important concern.

                        Figure 7. Women’s awareness of local climate change impacts.
of the respondents considered the climate change category as a high risk for their lives (“Very high”:
37.5%, “High”: 25%). Meanwhile, climate change is currently considered a huge risk; 72.5% of the
respondents are concerned about climate change in the near future (Question 2, “Very high”: 35%,
“High”: 37.5%). Moreover, most of the respondents identify the impacts of climate change as a
severe2020,
Climate risk8,to
140their society in Kurunegala. Almost half of the respondents, 47.5%, believe that
11 ofthe
21
impacts of climate change are a “Very high” risk and 25% agreed that it is a “High” risk (Figure 7).
Climate 2020, 8, x FOR PEER REVIEW 11 of 20
Similar to our stakeholder survey, most of the women selected “Lack of drinking water” (35.8%)
as the most serious climate change risk, followed by “Lack of living water” (20.8%). In terms of heat,
most women selected “Withered agricultural crop” (30%) as the most serious climate change risk
while “Increasing risk of tropical diseases” (28.3%) (Figure 8) was their second most important
concern. Figure 7. Women’s awareness of local climate change impacts.
Figure 7. Women’s awareness of local climate change impacts.
Figure 8. Most important climate change risks with respect to water (top) and heat (bottom) sectors as
Figure 8. Most important climate change risks with respect to water (top) and heat (bottom) sectors
assessed by the women respondents.
as assessed by the women respondents.
The women surveyed viewed the water management policy priorities to be “Supplying drinking
The women surveyed viewed the water management policy priorities to be “Supplying
water” (33.8%), “Supplying living water” (20.8%), and “Supplying agricultural water” (15%). Women in
drinking water” (33.8%), “Supplying living water” (20.8%), and “Supplying agricultural water”
Kurunegala also saw “Sewage treatment” (11.3%), “Installation of flood shelters” (6.3%), and “Supplying
(15%). Women in Kurunegala also saw “Sewage treatment” (11.3%), “Installation of flood shelters”
ground water” (5%) as important. Their responses to flood and underground water measures show
(6.3%), and “Supplying ground water” (5%) as important. Their responses to flood and
that women have more realistic responses than the stakeholders (Figure 9, top).
underground water measures show that women have more realistic responses than the stakeholders
Regarding heat, a large number of women (37.5%) chose “Greening the city” as the most desirable
(Figure 9, top).
measure, followed by “Greening buildings” (18.8%) and “Free public water installations” (17.9%).
Regarding heat, a large number of women (37.5%) chose “Greening the city” as the most
In addition, “Increasing public health capacity” and “installation of heat shelters” have approval
desirable measure, followed by “Greening buildings” (18.8%) and “Free public water installations”
ratings of over 10% from the women respondents. This result shows that the women in Kurunegala
(17.9%). In addition, “Increasing public health capacity” and “installation of heat shelters” have
city want to have more green areas in their city and public facilities to provide both water and heat
approval ratings of over 10% from the women respondents. This result shows that the women in
protection (Figure 9, bottom).
Kurunegala city want to have more green areas in their city and public facilities to provide both
water and heat protection (Figure 9, bottom).Climate 2020, 8, 140 12 of 21
Climate 2020, 8, x FOR PEER REVIEW 12 of 20
9. The
Figure 9. Themost
mostdesirable climate
desirable change
climate measures
change with with
measures respect to the to
respect water
the(top)
waterand heatand
(top) (bottom)
heat
sectors assectors
(bottom) assessed
as by the women
assessed by therespondents.
women respondents.
4. Discussion
4. Discussion
The biggest
The biggest limitation
limitation to to implementing
implementing this this risk
risk assessment
assessment relatedrelated to to water
water andand heat
heat waves
waves in in
Kurunegala city
Kurunegala citywaswasthe thelack of quantitative
lack of quantitative datadata
on their current
on their status.status.
current This typeThisof type
data is ofcritically
data is
important for identifying the effects of climate change and establishing measures
critically important for identifying the effects of climate change and establishing measures against against it. These data
it.
are necessary for developing the ability to collect, organize, and interpret
These data are necessary for developing the ability to collect, organize, and interpret varied varied information that can
identify and that
information predict
can climate
identifychange.
and predict climate change.
There were several
There were several other otherlimitations
limitations to to conducting
conducting thetheriskrisk assessment
assessment for Kurunegala
for Kurunegala city.
city. The
The local
local government
government is aware
is aware of the
of the problem;
problem; however,
however, theythey areare notaware
not awareofofthetheprocesses
processesrequired
required toto
analyze the situation and determine specific solutions. It is important to
analyze the situation and determine specific solutions. It is important to grasp the current problemgrasp the current problem and
to accurately
and identify
to accurately and analyze
identify the current
and analyze situation
the current throughthrough
situation both political and scientific
both political methods.
and scientific
Adapting to climate change is not something that one department can solve; it requires the
methods.
recognition
Adapting andtocooperation
climate change of related
is not departments
something that andone stakeholders
departmentascan it requires
solve; itjoint workthe
requires in
various sectors
recognition andofcooperation
the ministry. of Therefore, various stakeholders
related departments and stakeholders need to as be itaware of climate
requires joint workchangein
and promote capacity building.
various sectors of the ministry. Therefore, various stakeholders need to be aware of climate change
The process
and promote of listening
capacity building. to and gathering the opinions of residents is necessary for planning
and Theestablishing
process ofpolicies
listeningtotoprotect what isthe
and gathering considered
opinions of vulnerable. When collecting
residents is necessary opinions
for planning and
from stakeholders or women, it is necessary to gather opinions
establishing policies to protect what is considered vulnerable. When collecting opinions from from as many diverse groups as
possible. In this study, field surveys and stakeholder meetings were
stakeholders or women, it is necessary to gather opinions from as many diverse groups as possible. conducted to verify risks and
establish
In adaptive
this study, measures
field surveys andbased on the climate
stakeholder meetingschange risk assessment
were conducted to verifyresults.
risks andWe establish
engaged
different stakeholders so that we could incorporate different opinions
adaptive measures based on the climate change risk assessment results. We engaged different from water and heat experts,
technical experts,
stakeholders so thatandwe policymakers,
could incorporate as welldifferent
as relevant authorities.
opinions As a result
from water of our
and heat risk assessment
experts, technical
of climate change, and the ongoing discussions through various stakeholder
experts, and policymakers, as well as relevant authorities. As a result of our risk assessment meetings, the most urgent of
issue appears
climate change, to and
be securing
the ongoingdrinking water during
discussions throughdrought
various periods. In 2019,meetings,
stakeholder the drought the period lasted
most urgent
issue appears to be securing drinking water during drought periods. In 2019, the drought periodClimate 2020, 8, 140 13 of 21
from June to August, but there was a rise in the ambient temperature beginning in April. In 2018,
the dry period lasted only two months. The duration of hot, dry weather appears to extend each year.
The principal issue in water availability is that there is no reliable water source. The Deduru Oya
reservoir had been utilized all of these years to provide paddy irrigation but the irrigation department
built a weir in Deduru Oya to provide additional water for agricultural purposes. During the
dry periods, the KMC and other related organizations have monthly discussions with the District
Secretariat to assess the drought situation and the availability and distribution capacity of water
sources. They desperately need to establish measures to manage water shortages during these
increasing dry periods.
The other serious water availability issue is the high percentage of non-revenue water
(NRW) consumption [34]. On a three-year average (2014–2016), the NRW is approximately 50% in
Kurunegala [35]. The primary reason for the loss of NRW is frequent leaks within the aged pipe
distribution network and defective domestic meters. As there is no digitized system for data collection
and data storage at the KMC, it is necessary to formally design databases for continuous data collection
and dissemination of information. The amount of bulk water bought from the Water Supply and
Drainage Board, which categorizes (e.g., household, commercial) how the water units are being utilized,
needs to be digitized. The distribution of wells, groundwater wells, and common bathing wells need
to be mapped and monitored for whether they are in use or not during droughts and during normal
capacity and use. Based on the data collected through an updated and modernized digitized system,
it will be possible to determine which area has a leak and perform pipe network maintenance for
that area.
Rainwater can be used to secure drinking water in the short term. Using the right efficiency
membrane, drinking water can be secured in the current extreme situation. Water can be secured through
large storage facilities in government facilities, such as city hall and school buildings, among others,
or small storage containers in each household [36]. In the long term, better sustainable urban planning
is needed in Kurunegala, such as the types now practiced at a global scale. The growing threat of
climate change and environmental degradation has led to actions worldwide that have created resilient
communities based on the principle of Natural Based Solution [37–39]. By applying new technologies,
grey infrastructures are slowly being transformed to perform ecosystem services, aside from their
conventional functions. Recent trends in urban design and planning involve the concept of water
circulation cities, which involve the efficient utilization of all water resources by promoting natural
water circulation and water reuse within the city area. For this to work, it is necessary to prepare
proper water circulation measures in the city in advance.
Despite the fact that there are constant and increasing complaints of heat stress and related
discomfort, this has not been fully or formally documented in Kurunegala. There are no factual reports
connecting heat stress to health problems. We found that there is a slight increase in the incidence of
dengue fever; however, no mortality statistics have been reported. There are several organizations
involved with heat stress, but individual responsibilities are unclear. It is necessary to do physical
and quantitative research on heat waves [40,41]. Based on the quantitative research, it needs to define
the impact and damage status of heat stress and design databases for continuous data collection and
dissemination of information to manage this factor. Due to the lack of a current database, it is necessary
to manage the problem first, and then establish action plans for reducing the impact. In the short term,
the installation of green and shade curtains in areas where damage is severe can reduce the damage
from heat waves. Appropriate green-oriented landscape management mitigates the effects of heat
waves [42,43]. Measures that can be formulated need to be implemented immediately.
Especially in the case of water shortage, the actual impact on residents can be substantial.
As international climate-related funds have risen recently, it is also necessary to take advantage of
them immediately to implement urgent policies and plans. Developing countries will need mid- to
long-term support, rather than fragmentary and short-term support.Climate 2020, 8, 140 14 of 21
5. Conclusions
This study covered the process of risk assessment in Kurunegala city and its results. Risk assessment
is an important component of the urban planning process to improve resilience against climate change.
Among the various methods of climate change risk assessment, a survey-based assessment approach
was conducted in line with the current status of Kurunegala city.
The climate change risk assessment was carried out through various stages. The major problems
were determined to be water and heat waves after discussions with key stakeholders. Various impact
indicators that could have a significant impact on water and heat waves were drawn up with KMC
experts and stakeholders. Based on the water and heat wave indicators, two surveys were conducted
with experts, stakeholders, residents, and local women to prioritize the risks that should be addressed.
The climate change awareness survey is important in establishing plans for adaptation to climate change.
This can help identify the experiences of local residents and what they actually need. The residents of
Kurunegala city are highly concerned about climate change; however, most lack an awareness of water
resources and health issues, including heat waves and tropical diseases.
As a result of the climate change risk assessment of experts and awareness survey of stakeholders
and women, the major overall problem was determined to be the lack of drinking water. Water scarcity
due to prolonged drought, which may be exacerbated by anthropological interventions, is also not
properly documented. The problem of a lack of drinking water was found to be more serious due
to the effects of severe drought caused by climate change, as well as a lack of water resource and
water leak management. The impact of the heat wave is also understood to be significant. Residents
have experienced heat stress in their communities, but there is no published information related to
heat stress health hazards. No records are available from the Medical Officer of Health indicating
the relationship between heat stress and health, such that it was not possible to fully understand the
current situation. The climate change risk assessment results show that action plans are urgently
needed to solve problems caused by the lack of drinking water and heat waves. Several adaptation
measures are suggested: recirculating city water, rainwater utilization, effective use of existing water
resources, including a reduced NRW rate, response to heat stress, data establishment for identifying
and managing the impact of heat stress, and the installation of green and shade curtains.
These climate change risk outcomes play an important role in the development of climate change
adaptation action plans. It is also important that the information being delivered to general residents
about climate change and its associated risks is correct and clear. Policymakers in Kurunegala city
should select and implement these policies in full consideration of the current situation, so the city will
gradually grow into a climate-resilient city.
Funding: This study was conducted by the Korea Adaptation Center for Climate Change (KACCC) at the Korea
Environment Institute (KEI) as part of the “Sri Lanka, Technical support for climate smart cities (2018-115)” project.
This project is a pro-bono Technical Assistance project of the Climate Technology Centre Network (CTCN),
entitled “Developments of an urban adaptation plan for Kurunegala.” This project was funded by the Korea Ministry of
Science and ICT, “Sri Lanka: Technical support for climate smart cities” (grant number NRF-2018M1A2A2080813).
Conflicts of Interest: The author declares no conflict of interest.
Appendix A Risk Factors for Each Indicator for Survey-Based Approach Assessment and Experts
Survey Result
Table A1. DWR risk factors and assessment result of Kurunegala.
Experts Survey Result
Code Cause Risk Factor
Possibility of Occurrence Impact Score Rank
Lack of drinking water resources due
DWR01 Drought 3.86 4.14 15.9804 1
to drought
DWR02 Flood Disruption of drinking water facilities 2.71 2.74 7.4254 2
DWR03 Flood Hindrance to water treatment efforts 2.37 2.34 5.5458 3Climate 2020, 8, 140 15 of 21
Table A2. WM risk factors and assessment result of Kurunegala.
Experts Survey Result
Code Cause Risk Factor
Possibility of Occurrence Impact Score Rank
Disruption and
functional
WM01 Flood degradation of river 2.23 2.26 5.0398 9
facility (e.g.,
embankment, bridge)
Influence on the
operation of
waterworks facilities
WM02 Flood 2.5 2.39 5.975 7
(e.g., less access to
operational
mechanism)
Economic loss due to
impact from
interruption of
WM03 Flood 2.11 1.97 4.1567 11
transportation and
industry related with
rivers and canals
Increase of damaged
WM04 Flood irrigation facilities 2.23 2.17 4.8391 10
due to flood
Increase of property
assets loss due
WM05 Flood 2.48 2.33 5.7784 8
to increased frequency
of flood
Damage to drainage
facilities (e.g., storm
sewer system) due to
WM06 Flood increase in urban 2.77 2.46 6.8142 6
sediment drainage
and high volume
of water
Increased cost risk
due to lack of
industrial water and
WM07 Drought/Flood 3.03 2.91 8.8173 3
water treatment due
to water quality
deterioration
Drying streams and
water bodies (natural
WM08 Drought 3.94 3.83 15.0902 1
and artificial) due
to drought
Decrease of safety and
increase of destruction
WM09 Flood 2.94 2.89 8.4966 4
risk of water supply
and repair facilities
Change in flooding
occurrence and
WM10 Flood 2.76 2.73 7.5348 5
floodplains due
to flood
Increased frequency
of drought due to
WM11 Drought 3.6 3.4 12.24 2
persistent
non-precipitation daysClimate 2020, 8, 140 16 of 21
Table A3. WQA risk factors and assessment result of Kurunegala.
Experts Survey Result
Code Cause Risk Factor
Possibility of Occurrence Impact Score Rank
Water quality
deterioration due to
WQAE01 Drought 3.34 3.17 10.5878 4
pathogenic bacteria by
temperature rising
Increase of water
pollution risks due to
excessive inflow of
WQAE02 Storm land pollution source 3.11 3.2 9.952 5
(e.g., living sewage,
industrial wastewater)
by heavy rain
Fluctuations in water
Drought, ecology according to
WQAE03 3.29 3.26 10.7254 3
Flood rainfall pattern
change
Water quality
Drought, deterioration due to
WQAE04 3.41 3.29 11.2189 2
Flood rainfall pattern
change
Increase of algal
blooms and
Ambient deterioration of
WQAE05 3.46 3.46 11.9716 1
Temperature aquatic ecosystem
due to average water
temperature rising
Increase of diseases
and new pathogenic
Avg. water microorganisms
WQAE06 3.11 3.14 9.7654 6
temp. rising occurrence due to
water temperature
rising
Acceleration of
extinction of
Avg. water
WQAE07 endangered species 2.51 2.6 6.526 9
temp. rising
and endemic species
by climate change
Effluence increase due
to fertilizer, pesticides
WQAE08 Storm and animal wastes 2.89 2.94 8.4966 7
according to rainfall
intensification
Increase of abnormal
WQAE09 Temp. rising reproduction of alien 2.66 2.6 6.916 8
invasive species
Fluctuations in
Avg. water species composition
WQAE10 2.53 2.52 6.3756 10
temp. rising and spawning season
of fish
Fluctuations in
species composition
Avg. water
WQAE11 and spawning season 2.4 2.4 5.76 11
temp. rising
of mollusca and
crustaceansClimate 2020, 8, 140 17 of 21
Table A4. WR risk factors and assessment result of Kurunegala.
Experts Survey Result
Code Cause Risk Factor
Possibility of Occurrence Impact Score Rank
Lack of water for building
Heat stress,
WR01 maintenance and 4.03 3.91 15.7573 1
drought
management
Avg. water Change in habitat of
WR02 3.14 3.06 9.6084 9
temp. rising aquatic flora and fauna
Loss of fishery according to
increase of harmful
Avg. water
WR03 organisms (e.g., red tide, 1.91 2.29 4.3739 11
temp. rising
jellyfish) due to average
water temperature rising
Fluctuations in spawning
habitat and season of fish
Avg. water
WR04 and molluscs and 2.23 2.94 6.5562 10
temp. rising
crustaceans due to water
temperature rising
Increase of water demand
WR05 Drought due to increase of crop 3.83 3.66 14.0178 4
evapotranspiration
Increase of water demand
WR06 Drought for livestock and animal 3.56 3.47 12.3532 5
husbandry due to drought
Decrease of national water
WR07 Drought supply capacity due to 3.89 3.74 14.5486 2
rainfall pattern change
Lack of water for SME
WR08 Drought 3.37 3.31 11.1547 8
industries due to drought
Un-controlled use of
WR09 Drought groundwater due to lack of 3.6 3.43 12.348 6
water
Increased gap of water
WR10 Drought supply among regions due 3.76 3.79 14.2504 3
to drought
Change in groundwater
WR11 Drought level due to increase of 3.46 3.31 11.4526 7
groundwater use
Table A5. SDF risk factors and assessment result of Kurunegala.
Experts Survey Result
Code Cause Risk Factor
Possibility of Occurrence Impact Score Rank
Increase of
SDF01 Drought, flood 3.11 3.09 9.6099 2
waterborne diseases
SDF02 Flood Overflow of toilet 2.83 2.69 7.6127 3
Lack of water for
SDF03 Drought 3.37 2.94 9.9078 1
toilet usage
Table A6. HF risk factors and assessment result of Kurunegala.
Experts Survey Result
Code Cause Risk Factor
Possibility of Occurrence Impact Score Rank
Increase of mortality
HF01 Flood 2.18 2.3 5.014 7
rate due to disaster
Increase of injury rate
HF02 Flood 2.29 2.5 5.725 5
due to disasterYou can also read