In this issue LATEST DUBLIN ECONOMIC DATA IHS MARKIT DUBLIN PMI MASTERCARD SPENDINGPULSE IS THE ECONOMY READY TO ROAR? - AWS
←
→
Page content transcription
If your browser does not render page correctly, please read the page content below
ISSUE 26
      SEPTEMBER 2021

                     in this issue
   LATEST DUBLIN ECONOMIC DATA
          IHS MARKIT DUBLIN PMI
    MASTERCARD SPENDINGPULSE
IS THE ECONOMY READY TO ROAR?
WELCOME

   Highlights
                                           The September 2021 issue
       The number of recipients of
       the Pandemic Unemployment
       Payment in Dublin reduced
       by over 20,000 MoM to just
       over 60,000 in August 2021          of the Dublin Economic
       as restrictions on economic
       activity were eased.                Monitor
       Business activity in Dublin
       ramped up in Q2 2021 with           The Dublin Economic Monitor is                                      The Monitor is divided into
       the strongest PMI reading           a joint initiative on behalf of the                              the following themes for Dublin:
       (60.2) since late 2015 as growth    four Dublin Local Authorities,
       was recorded across each of         and is designed to be of interest                                        Economy
       the three monitored sectors of      to those living and doing business                                       Business Developments
       services, manufacturing and         in Dublin or considering locating                                        Retail
       construction.                       here. The report is produced by                                          Hospitality
                                           Grant Thornton with inputs from                                          Labour Market
       Consumer retail spending rose       IHS Markit and MasterCard.                                               International Rankings
       by 5.1% QoQ and 17.1% YoY              There are two special feature                                         Housing
       (SA) in Q2 2021 with strong         articles this quarter. The first                                         Transport & Travel
       recoveries in the Entertainment     is from Caeman Wall, Head of
       and Discretionary categories as     Research at Fáilte Ireland, and                                  For more data and insights see:
       a return to bricks-and-mortar       provides an overview of the                                      www.dublineconomy.ie.
       outlets was in evidence.            ongoing recovery in tourism in                                     The next edition will be
                                           the Capital. The second article is                               published in December 2021.
       New house commencements             by Eoghan O’Mara-Walsh, Chief
       surged to over 5,000 in Q2          Executive Officer at the Irish
       2021, the highest quarterly level   Tourism Industry Confederation,                                          www.dublineconomy.ie
       since the mid-2000s.                and     centres     on    Dublin’s
                                                                                                                    @DCCEconDev
                                           international air connectivity in
       Dublin hotel occupancy rates        the context of recovery in overseas
       rallied to 43.1% in July 2021,      tourism.
       up considerably from the low
       point of 5.9% in June 2020,         Dublin City             South Dublin County                   Fingal County               Dún Laoghaire Rathdown
                                           Council                 Council                               Council                     County Council
       as domestic and international
       visitors returned to the Capital.   This document provides general information on the Dublin economy. It is not intended to be used as a basis for any par-
                                           ticular course of action or as a substitute for financial advice. The document is produced independently by Grant Thornton
                                           and Packed.House; the views and opinions expressed are those of the relevant author, and do not necessarily reflect the
                                           views of the Dublin Local Authorities. The Dublin Local Authorities disclaim all liability in connection with any action that
                                           may be taken in reliance of this document, and for any error, deficiency, flaw or omission contained in it.

2 //
ECONOMY

Is the economy ready to roar?
Always wary of false dawns, the economic mood does            consumer expenditure, as more opportunities to spend
feel more firmly upbeat than for some time. The roll          return. The buoyant consumer trends are further
out of the vaccine after a shaky start, and the lifting of    supported by a seemingly resilient labour market, which
restrictions is driving this more optimistic feeling.         is now seeing job vacancy levels back at pre-pandemic
   Supporting this sense of growing optimism, new             levels, and the release of a significant proportion of the
research from Grant Thornton Ireland has revealed that        savings that were accumulated by many during lockdown
76% of Irish businesses are optimistic about the outlook      restrictions. The outcome of this upbeat assessment is a
for the economy over the coming 12 months as domestic         projection that the Irish economy will grow by 7.2% in
and international markets recover and the world reopens       2021. More moderate GDP growth of 5.1% is expected
post-pandemic. The research carried out in the first half     in 2022, on the back of the partial unwinding of the
of 2021 for the Grant Thornton International Business         very large household savings accumulated during the
Report put Ireland ahead of countries including the           long and very strict lockdowns, and the continuously
UK, France and Germany for levels of optimism among           improving external environment.
local businesses. Ireland ranks fourth of 29 economies
surveyed on business optimism and is highest of all
the European countries surveyed. Not only are firms
increasingly optimistic, they are raising their heads and
looking outward. More than a third (38%) expect to
grow exports over the coming year and 30% expect to
increase the number of countries they sell to with the
United Kingdom and the United States identified as
countries of priority for Irish businesses.
   Continuing in this positive vein, Irish businesses
are also focusing on their workforce to support their
domestic and international sales strategies. Close to         An eye on inflation
four in ten Irish businesses are expecting to increase        Amid the increasingly optimistic view on how the
employment as society returns to normal.                      economy will perform, there has been considerable
                                                              discourse on inflation. Global inflationary pressures,
Raising expectations
                                                              particularly evident in oil prices and construction
While Ireland seems to be displaying more optimism
                                                              materials, coupled with service sector inflation as the
than many other countries, we are not alone in feeling
                                                              economy reopens have driven the Irish consumer price
more positive. The improving health situation and
                                                              inflation rate to 2.2% in July. The overriding expectation
ensuing continued easing of virus containment measures
                                                              is that these current rates are transitory and reflect base
have led to an uplift in the EU Commission’s economic
                                                              effects (recalling that consumer prices were declining
forecasts since the spring. The Commission's summer
                                                              during the same period a year ago) and bottlenecks
forecast report notes that the contraction of EU GDP in
                                                              caused by strong ‘revenge spend’ demand. While the
the first quarter of the year turned out to be marginal,
                                                              inflation rate appears transitory, it is an important metric
and milder than expected. Falling numbers of new
                                                              to monitor in the coming months as the economy looks
infections and hospitalisations have allowed economies
                                                              set to roar back to life.
to reopen across the EU, to the benefit of service sector
businesses, in particular. It appears, from flash estimates
of economic activity across Europe that economies are
roaring back to life.                                                    The optimistic mood feels more
   GDP is now forecast to grow by 4.8% in 2021 and
4.5% in 2022 in both the EU and the eurozone area. The
                                                                               secure at last, with growth
volume of output is projected to return to its pre-crisis             projections being revised upwards.
level in the last quarter of 2021, which is one quarter
earlier than expected in the EU’s spring forecast for the
eurozone. Growth is expected to be led by sustained

                                                                                                                      // 3
Business Developments

Economic re-opening stimulates dublin
businesses, yet uncertainty remains
The third quarter of 2021 has been dominated by re-
opening and initial recovery in the Dublin economy. The                            TikTok’s recent agreement
combination of the resumption of indoor dining, plus
the re-emergence of domestic and international travel                              to rent all of the 18,000m2
has provided a much needed boost for many Dublin                          Sorting Office in Dublin 2 is a vote
businesses – with hospitality and retail to the fore. The
quarter has also been positive for swathes of the Dublin
                                                                              of confidence in the traditional
labour market, as thousands of employees – mainly in                        office model, yet the anticipated
the services sector – returned to work.                                 staggered return to offices for many
   Notable developments and setbacks in specific sectors
of the labour market were also apparent in the quarter,                    employees is likely to continue to
including:                                                                  affect the commercial market for
• Deutsche Bank’s announcement of plans to cut up to                                  some quarters to come.
   450 full-time and contractor roles in the Capital. The
   jobs which will be lost are in back office and support,
   primarily in its operations and technology operations,
   as the bank seeks to simplify its business model and      arrangements which apply for many employees. As
   reduce costs;                                             shown in the chart below, office rents remained stable in
• Gap’s closure of all of its retail stores in Ireland       the south suburbs in the quarter, but declined by 2.5%
   by the end of 2021. Its three Dublin stores in            QoQ and a remarkable 11.6% YoY in the city centre.
   Blanchardstown, Dundrum and Henry Street will             According to CBRE, vacancy rates remain higher than
   be shuttered in another blow for the Capital’s retail     pre-pandemic times – particularly in the Dublin suburbs
   sector; and                                               where vacancies have increased from 6.8% in Q2 2019
• The expansion of Liffey Valley Shopping Centre’s           to 10.3% in Q2 2021. TikTok’s recent agreement to
   retail and leisure offering, with the creation of 130     rent all of the 18,000m2 Sorting Office in Dublin 2
   jobs.                                                     is a vote of confidence in the traditional office model,
                                                             yet the anticipated staggered return to offices for many
Labour Market Supports
                                                             employees is likely to continue to affect the commercial
The Pandemic Unemployment Payment (PUP) has
                                                             market for some quarters to come.
been a vital support for many businesses and employees
through the pandemic. The scheme has been closed
                                                             Dublin Office Rents Index (2006 = 100)
to new applicants since early July as the worst of the
Covid-19 restrictions were eased. From September 7th,
PUP rates commenced a gradual reduction which will
continue up to the start of February 2022. At that point,
recipients still on the PUP may apply for jobseeker’s
payments as an alternative support to assist in returning
to the workforce. This phased approach is designed to
encourage a return to employment (where possible), and
will reduce the sizeable fiscal burden which the State has
carried for the past 18 months.
Commercial Market Uncertainty
The market for commercial space in Dublin continued                             South Suburbs   City Centre
to be affected in Q2 2021 by the working-from-home           SOURCE: CBRE.

4 //
Business Developments

Business activity rebounds as pandemic
restrictions are lifted
Overall Dublin IHS Markit PMI (SA)
                                                                               The loosening of Covid-19
                                                                           restrictions helped to breathe
                                                                      life back into the Dublin economy
                                                                           over the course of the second
                                                                          quarter, with the recovery from
                                                                         the pandemic now underway in
                                                                                                 earnest.

                 Rest of Ireland   Dublin

Business activity in Dublin ramped up in Q2 2021            five-quarter sequence of decline and was the strongest
as Covid-19 lockdown restrictions were eased and the        expansion for six years. New order growth was marginally
economy reopened. The robust expansion in activity          more robust outside the Capital at 61.2.
(index reading of 60.2) was the strongest since the final      Employment levels amongst Dublin companies also
quarter of 2015. Growth was recorded across all three       expanded in Q2. An index reading of 54.4 was the
of the monitored sectors of services, manufacturing and     strongest since Q1 2019 and indicated solid job creation
construction. An overall YoY increase of 35 index points    in the Capital. It must be highlighted that employment
underlines the significant progress made since the depths   levels in Dublin suffered a deep contraction in one
of the pandemic. Output also surged across the Rest of      quarter (Q2 2020) since the onset of the pandemic, but
Ireland, and at a slightly stronger pace (61.3) than seen   have been stable or increasing since – no doubt assisted
in Dublin.                                                  by the Government's financial supports. As with the
   The reopening of the economy not only boosted            overall PMI, employment across the Rest of Ireland
activity but resulted in a steep expansion of new orders    increased at a swifter rate than in Dublin in Q2. This
(index = 60.1) during Q2 which bodes well for future        may be partly related to the deeper contractions suffered
quarters. The marked increase in new business ended a       outside Dublin during the worst of the pandemic.

Overall PMI New Orders (SA)                                 Overall PMI Employment (SA)

                 Rest of Ireland   Dublin                                    Rest of Ireland   Dublin

                                                                                                                 // 5
RETAIL

Dublin retail spending stages modest fightback
in second quarter of 2021
MasterCard Total Retail Sales Index (SA)

                                                                                                                                                                                        136
                                                                                                                                                                                       +31.6%
                                                                                                                                                                                        YoY

                                                                                                                                                                                                129
                                                                                                                                                                                                +17.1%
                                                                                                                                                                                                 YoY

                                                                                 Dublin                    Ireland

Dublin’s retail sector experienced a modest recovery in                                                exceptionally strong, rising by 20.6% QoQ. This is, in
Q2 2021, following an exceptionally difficult start to the                                             ways, the most significant shift in Q2 as it underlines the
year. Retail spending rose by 5.1% QoQ (SA) and was                                                    continued confidence of Dublin consumers to spend on
no doubt aided by the lifting of restrictions on domestic                                              ‘big ticket’ items – in spite of increased opportunities to
travel and commercial activity. The main trends were                                                   spend elsewhere in the economy.
towards bricks-and-mortar outlets with expenditure                                                        Necessities spending increased by 5.3% QoQ,
in the Discretionary and Entertainment categories                                                      yet a notable QoQ decline of 2.6% was recorded in
expanding QoQ by 61% and 21.3% respectively – albeit                                                   eCommerce.
from historically low bases. Such increases underline the                                                 The YoY uptick in retail spending in Dublin was more
willingness of Dublin consumers to return to physical                                                  marked as growth of 17.1% was recorded, though the
outlets, hotels, bars and restaurants post-pandemic, and                                               same quarter in 2020 was the lowest ebb for the domestic
these trends will be expected to strengthen as vaccination                                             economy. The substantial YoY expansion was mainly
numbers rise and tourism gathers momentum.                                                             driven by Household Goods (+77.6%), Entertainment
   Growth in Household Goods expenditure was also                                                      (+75.2%) and Discretionary (+53.4%) spending.

Dublin Retail Sales Value Index (SA) Q2 2021

    +0.4%                                     +53.4%                                      +77.6%                                    +75.2%                                        +7.5%
          YoY                                           YoY                                     YoY                                         YoY                                        YoY

  Necessities                              Discretionary                                Household                               Entertainment                                 eCommerce
                                                                                          Goods

   METHODOLOGY
   A macro-economic indicator, SpendingPulse™ reports on national and Dublin retail sales and is based on aggregate sales activity in the MasterCard payments network, coupled with estimates for
   all other payment forms, including cash and cheque. This information has been grossed up to present an estimate of the total retail sales of retail businesses in Ireland and Dublin to both resi-
   dents and tourists. Data is seasonally adjusted but is not adjusted for inflation. MasterCard SpendingPulse™ does not represent MasterCard financial performance. SpendingPulse™ is provided by
   MasterCard Advisors, the professional services arm of MasterCard International Incorporated. See www.dublineconomy.ie for more info on methodology.

*ALL VALUES ARE SEASONALLY ADJUSTED BY GRANT THORNTON

6 //
RETAIL

Dublin tourist spending shows first signs of
revival
                                   Dublin and Ireland Tourist Spend by Origin - Q2 2021 (SA)

                              Overall

            +80.2%                 +184.4%               +97.5% +158.2%                               -38.6%            -46.0%
             YOY OVERALL CHANGE    YOY OVERALL CHANGE     YOY CHANGE               YOY CHANGE          YOY CHANGE         YOY CHANGE
             IN TOURSIM SPEND IN   IN TOURSIM SPEND IN   IN SPENDING IN           IN SPENDING IN      IN SPENDING IN     IN SPENDING IN
                   IRELAND               DUBLIN
                                                             IRELAND                  DUBLIN              IRELAND            DUBLIN

            +35.3%                 +58.9%                +81.2%                +123.4%              +138.6% +46.3%
               YOY CHANGE            YOY CHANGE           YOY CHANGE               YOY CHANGE          YOY CHANGE         YOY CHANGE
              IN SPENDING IN        IN SPENDING IN       IN SPENDING IN           IN SPENDING IN      IN SPENDING IN     IN SPENDING IN
                  IRELAND               DUBLIN               IRELAND                  DUBLIN              IRELAND            DUBLIN

                                                                   Ireland           Dublin

                                                              SOURCE: MASTERCARD SPENDINGPULSE

 133.8
Spending by overseas tourists in the Dublin economy                              strong rebounds recorded in spending by tourists from
showed signs of revival in Q2 2021. International air                            the UK (+158.2% YoY), France (+123.4%) and Germany
travel has been decimated since early 2020 but the easing                        (+58.9%). The US market, which is so crucial for tourism
of travel restrictions and quarantining requirements will                        in Ireland, showed initial signs of spending recovery but
have boosted overseas access to Ireland as the summer                            remained down by 46% YoY. This market will be one of
approached.                                                                      the last to recover given the summer season is the focal
   Expenditure by all overseas tourists in Dublin                                point for American visits. Spending by Chinese tourists,
increased by 25.6% QoQ in Q2 – with growth recorded                              as expected, remained at a low level in Q2.
in spending by tourists from each of the main markets.                              A similar picture emerged across Ireland, though
The YoY recovery in overseas spending in Q2 2021 was,                            the recovery in tourist spending was less pronounced.
unsurprisingly, very strong when compared to the low                             Total expenditure increased by 166% QoQ and 80.2%
point of 2020 with an expansion of 184.4%.                                       YoY. This was primarily driven by visitors from Europe.
   European markets were the key drivers for this with                           Spending by tourists from the US was down but to a
                                                                                 lesser extent than in Dublin at -38.6% YoY.
Annual Growth Rates in Loans for Consumption                                     Consumer Financing
to Irish Households                                                              It is evident that the nascent recovery in retail sales
                                                                                 has been largely driven by savings built up by Irish
                                                                                 households during the pandemic – as opposed to new
                                                                                 lending to consumers.
                                                                                    As depicted in the chart, loans for consumption
                                                                                 purposes (non-housing) released to Irish households
                                                                                 followed negative annual rates of growth in every
                                                                                 month between April 2020 and June 2021. This will
                                                                                 have somewhat limited consumers’ ability to spend,
                                                                                 yet household savings and a recent rise in consumer
                                                                                 confidence have combined to drive up retail expenditure
                                                                                 levels. This trend may be expected to continue as bank
                                                                                 lending recovers and the economy further re-opens in
SOURCE: CENTRAL BANK OF IRELAND.
                                                                                 time.

                                                                                                                                          // 7
HOSPITALITY

Capital's hotel sector stages initial fightback

Dublin Hotel Average Daily Rates (SA)                                                                                                    JUL '21
                                                                                       HOTEL OCCUPANCY RATE (SA)                           43.1%
                                                                                       YEAR ON YEAR % AGE POINT CHANGE                     +27.0
                                                                                       INDEX OF HOTEL ROOM SUPPLY (SA, JULY 2013=100)       115.0
                                                                                       YEAR ON YEAR % CHANGE                                +5.7

                                                                                       The Dublin hotel market staged an initial fightback in the
             €168                                                                      summer of 2021 as Covid-19 restrictions on the sector
                Max
                                                                                       were finally eased. The critical measure of occupancy
                                                                                       rates rose to 43.1% in July, up considerably from the
                                                                                       low point of 5.9% in June 2020. July's occupancy rate
                                                                                       represented increases of 9.2 percentage points (pp) MoM
                                                                                       and 27pp YoY (SA) as domestic and international visitors
                                                                                       started to return to the Capital. Further recovery will be
                                                                                       anticipated as international travel recovers further in the
                                                                                       coming quarters. Average Daily Rates, which reached a
                                                                                       low of just €75 in Q1 of this year, also rebounded in July
                                                                                       (to €114) with 7.1% MoM and 35.5% YoY increases.
                         Average Daily Rate €                  Index of Supply

SOURCE: STR GLOBAL. SEASONALLY ADJUSTED BY GRANT THORNTON.

Easing of restrictions boosts Dublin restaurant
sector
Seated Diners at Dublin Restaurants                                                                                                      AUG '21
(YoY % Change)                                                                         YEAR ON YEAR % CHANGE IN SEATED DINERS IN
                                                                                                                                           +45.4
                                                                                       DUBLIN
                                                                                       YEAR ON YEAR % CHANGE IN SEATED DINERS IN
                                                                            45.4%                                                          +110.4
                                                                                 Max   IRELAND

                                                                                       The Dublin restaurant sector experienced a robust
                                                                                       recovery across June, July and August of 2021 as
                                                                                       Covid-19 restrictions were gradually eased. This followed
                                                                                       five months of limited activity in which both indoor and
                                                                                       outdoor dining were prohibited. The volume of seated
                                                                                       diners at the Capital's restaurants increased markedly
                                                                                       from June 7th as outdoor dining was permitted, while a
                                                                                       further significant bounce occurred with the resumption
                                                                                       of indoor dining on July 26th. As of August, seated diner
                                                                                       numbers were up by 45.4% YoY in Dublin and by over
                                                                                       110% across Ireland. The stronger national rate may
                                                                                       reflect the influence of staycations on restaurants outside
                                                                                       the Capital.
SOURCE: OPENTABLE. NOTE: DATA ONLY INCLUDES SATURDAY DINERS.

8 //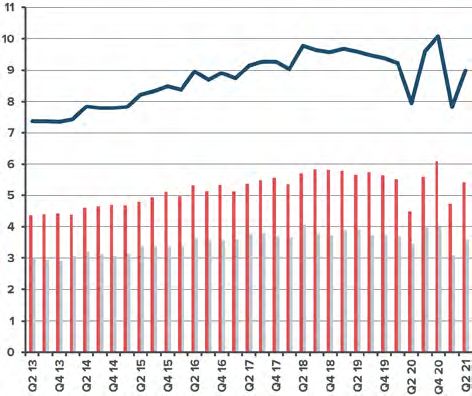
SPECIAL REPORT

The long road back for Dublin’s
tourism industry has started

                         Eoghan O’Mara Walsh                                         Research shows that the
                         CEO, Irish Tourism Industry                            fundamental appeal of Dublin
                         Confederation                                      remains as strong as ever to the
                                                                            international visitor – a compact
                                                                               European capital city, steeped
It is an indisputable fact that Ireland’s tourism and                         in history and heritage, nestled
hospitality industry has been one of the hardest hit
economic sectors as a result of the Covid-19 pandemic.
                                                                            between the mountains and the
An industry that had been worth €9.2 billion annually,                                                    bay.
and supported one in ten jobs nationally, has been utterly
devasted by both Covid-19 and rolling lockdowns. Initial
estimates for 2021 identify that - even though the sector       attitude and commitment to international connectivity.
has haltingly reopened in recent months - the value of             Despite the recent mauling for Dublin’s tourism
the tourism economy will be down a whopping 74% on              industry, there is hope.
2019 levels.                                                       According to a recent report by property advisors
    And it might be worse again in Dublin. Whereas the          Savills Ireland, 24 hotels are currently under construction
west coast and Wild Atlantic Way benefit from domestic          in Dublin. This will add a further 2,400 bedrooms to
tourists looking to enjoy a staycation, the Capital city        Dublin’s hotel stock by the end of 2023 meaning that
has long since depended on international visitors who           there will be significant capacity to enable recovery and
are in short supply this year. Since mid-July, and the          growth. In fact supply will outstrip demand for some
lifting of the ban on non-essential travel, international       time but that can only mean really excellent value for the
visitors have slowly been making a return but only in           visitor thereby further stimulating interest.
modest numbers. Air access into Dublin Airport has                 Crucially though, as an island-nation, air access is
been massively reduced and getting planes up in the sky         critical and Ireland currently lags well behind the rest
again is critical not just to the airport and aviation sector   of Europe in the recovery of its international traffic.
but also to the city’s tourism industry.                        To that end there has to be a huge economic focus by
    Back in 2017, in a pre-Covid world, the then Taoiseach      Government to incentivise airlines to add new routes,
Leo Varadkar committed to doubling Ireland’s global             increase frequency, and grow capacity. Dublin Airport
footprint by 2025. He boldly stated that Ireland would          had become a key strategic hub between North America
be “an island at the centre of the world” and the growth        and the European Continent and it must strive for that
in aviation connectivity at Dublin Airport made that            once more.
claim very credible indeed. Sadly the pandemic has put             With strong airline access, and a tourism sector that
a stop to such an ambition – whether it is a temporary          remains competitive, the future can be bright once more.
pause or a permanent halt depends on the Government’s

                                                                                                                       // 9
LABOUR MARKET

Live register remains stable through to July
2021
Dublin Live Register (SA)                                                                                    JUL '21
                                                               DUBLIN LIVE REGISTER (SA)                      47,354
                                                               YEAR ON YEAR % CHANGE                             -2.7
                                                               IRELAND LIVE REGISTER (SA)                    191,493
                                                               YEAR ON YEAR % CHANGE                            -15.4

                 104,839                                       The number of people on the Live Register in Dublin
                     Max                                       remained relatively stable over the first seven months
                                                               of 2021 as Government income supports continued
                                                               to limit the full labour market impacts of Covid-19.
                                                      44,685   Over 47,300 people (SA) were on the Live Register in
                                                       Min     the Capital in July, up 3.4% MoM but down by 2.7%
                                                               YoY. Supports such as the PUP have ensured that the
                                                               number on the Live Register exceeded 50,000 in only
                                                               two months (September and October 2020) since the
                                                               pandemic struck. At the national level, the number on
                                                               the Live Register rose by 5.1% MoM but declined by
                                                               15.4%YoY to just under 191,500 in July.

SOURCE: CSO, SEASONALLY ADJUSTED BY GRANT THORNTON.

Demand for PUP supports continues steady
descent
Dublin Pandemic Unemployment Payment                                                                        AUG '21
Recipients                                                     TOTAL DUBLIN PUP RECIPIENTS                   60,730
                                                               MONTH ON MONTH CHANGE                        -20,098
                                  175,506
                                     Max
                                                               The number of recipients of the Government's Pandemic
                                                               Unemployment Payment (PUP) in Dublin continued to
                                                               steadily descend in the weeks through to early August
                                                               2021. Just under 61,000 people were in receipt of the
                                                               PUP at the start of the month, down considerably from
                                                               the peak of over 175,000 in May 2020. The August
                                                               total was the lowest since the support was introduced
                                                               in March of 2020 and represented a MoM decline of
                                                               some 20,000 recipients. From September 7th, PUP rates
                                                               have commenced a gradual reduction with the payment
                                                               scheduled to be discontinued in early February 2022.

SOURCE: CSO. DATA IS WEEKLY.

10 //
LABOUR MARKET
Economic reopening boosts labour market
Employment by Broad Sector '000s (SA) Q1 '21
SERVICES EMPLOYMENT '000s (SA) 625.4
YEAR ON YEAR CHANGE '000s (SA) -12.6
INDUSTRY & CONSTR. EMPLOYMENT '000s (SA) 87.4
718,948
Max YEAR ON YEAR CHANGE '000s (SA) +6.4
Although Q2 2021 employment figures for the Capital
have yet to be released by the CSO, it is evident that
the Dublin and national labour markets have undergone
a recovery as the summer progressed. The IHS Markit
PMI data in this issue shows that Dublin firms have
been expanding their workforces at a solid rate. The
July Bank of Ireland Economic Pulse echoes this at the
national level, and goes further as 27% of Irish firms
were reported to be struggling with labour shortages
and 44% were planning to increase basic wages in the
next 12 months. The anticipated easing of remaining
Covid-19 restrictions up to Christmas will be expected
Construction Industry to provide an additional stimulus for the labour market
Public Sector Private Services over the rest of the year.
SOURCE: CSO. SEASONALLY ADJUSTED BY GRANT THORNTON.
NOTE: DATA RE-ADJUSTED SINCE LAST ISSUE.
INDIVIDUAL SECTOR VALUES MAY NOT SUM TO TOTAL DUE TO ROUNDING.
Dublin job postings recover to exceed pre-
pandemic levels
Job Postings on Indeed AUG '21
(Feb 2020 = 100) PERCENTAGE POINT CHANGE VERSUS FEB 2020 -
+7.6
DUBLIN
PERCENTAGE POINT CHANGE VERSUS FEB 2020 -
+42.9
IRELAND
Job postings in the Dublin economy recovered to exceed
pre-pandemic levels in July and August 2021. According
to Indeed, postings for jobs in the Capital in August
stood 7.6% above the baseline of pre-pandemic February
2020. Across the rest of Ireland, the rebound has been
-56.4 far swifter with a full recovery recorded in March 2021.
Min
Postings outside of Dublin in August stood 42.9% above
the pre-pandemic baseline. It is evident that the Dublin
labour market suffered a more severe contraction in
terms of new opportunities in mid-2020 and has been
slower to regather momentum ever since.
National Dublin
SOURCE: INDEED
NOTE: DATA RE-ADJUSTED SINCE LAST ISSUE.
NOTE: 7 DAY MOVING AVERAGE, INDEXED TO 01/02/2020.
// 11DUBLIN'S INTERNATIONAL RANKINGS
Rankings balance Dublin's strengths
against affordability issues
Internationally published benchmarks are a useful means Anywhere Index. Digital nomad visas, which are not
of measuring a city’s performance relative to its peers, currently available in Ireland, were a differentiator for
and recent indicators for Dublin confirm the city’s a number of the top-ranked cities across the world
strong showing across a range of dimensions (see table including Melbourne (1st), Sydney (3rd) and Tallinn
opposite). (4th).
Tech City A Student City
Dublin has retained its position of third in the Financial Dublin featured in 39th position in QS’s Best Student
Times fDi European Tech Cities of the Future rankings, Cities rankings for 2022. This was down two places on
behind only London and Paris. The Irish Capital’s 2019 (last available) yet represented a strong showing for
performance improved from 2020 in terms of innovation the Capital relative to 114 other locations worldwide.
and attractiveness where it placed in 7th position, having Dublin was rated highly in terms of desirability (30th
failed to make the top 10 last year. Dublin displayed globally) which is inclusive of factors such as liveability,
particular strength in the areas of economic potential and safety and globalisation. Employer activity (36th
FDI performance (3rd in Europe for both categories), globally) was another strong point for the Capital, and
while Enterprise Ireland and companies including reflected the reputations of Dublin third level institutions
MasterCard and Microsoft were praised for their recent amongst employers. Affordability was Dublin’s weak
investments in the city region. point, with a ranking of 103rd globally underlining the
high cost of living in the Capital.
Remote Working
A new survey from online housing platform, Nestpick, Pandemic Implications for Liveability
has ranked Dublin in mid-table of the world’s best cities The Economist magazine has reported that Dublin has
to live and work remotely. This is in spite of very strong fallen in terms of its ‘liveability’, though results have
performances by the Capital in the areas of: been severely impacted by the pandemic. Dublin ranked
• Legal frameworks for remote work; in 51st place in the 2021 Global Liveability Index –
• Proportion of jobs that are teleworkable; and down 22 places in six months – as declining ratings
• Air, noise and light pollution. for many European cities were linked to the stressed
High rents and a lack of affordable housing were the states of healthcare systems, along with the curtailment
weak points for Dublin which contributed to a ranking of culture, entertainment and educational activities
of 32nd out of 75 global locations in the Work-From- during Covid-19. This will be expected to change as the
pandemic eases.
12 //DUBLIN'S INTERNATIONAL RANKINGS
DUBLIN'S LATEST INTERNATIONAL RANKINGS
Source Benchmarking Criteria Year Ranking
Votes by readers of Condé Nast Traveller
Condé Nast Friendliest Cities in
magazine based on experiences in European 2020 2 -
Europe
cities
Eden Strategy Institute Top 50 Smart 10 key factors covering governance, resourcing,
2021 26 ▲
City Governments smart programmes, policies and ecosystem
Economic and technological factors, and citizens’
IMD Smart City Index 2020 34 ▼
perceptions of "smart" city credentials
FDI performance, connectivity, cost
fDi x TNW European Tech Cities of
effectiveness, economic potential, innovation & 2021 3 -
the Future
attractiveness
fDi Market Top Headquarter Weighting of fDi Markets data (since 2015)
2020 1 ▲
Locations (Financial Times) against locations' population size
FDI performance, connectivity, cost
fDi Global Cities of the Future effectiveness, economic potential, innovation & 2021 5 ▼
attractiveness
Movement of services and staff at financial
EY Financial Services Brexit Tracker services firms in the UK since the Brexit 2021 1 -
referendum in 2016
Regulatory, market and business/labour
landscape, external and international openness,
Global Talent Competitiveness Index 2020 13 ▲
education and access to growth opportunities
and sustainability and lifestyle
Mercer Cost of Living City Rankings Cost of consumer goods and services 2020 46 ▼
PwC-ULI Emerging Trends in Real Outlook for investment and development, and
2020 12 ▼
Estate Europe the scale/liquidity of the city's market
Economist Intelligence Unit Global Stability, healthcare, culture and environment,
2021 51 ▼
Liveability Index education and infrastructure
Attractiveness to digital nomads in terms of
Nestpick Work-From-Anywhere Index 2021 32 -
legislation and liveability factors
Startup Genome Global Startup Performance, funding, market reach,
2020 36 ▼
Ecosystem Report 2020 connectedness, talent, experience
Desirability, affordability, student mix, student
QS Best Student Cities 2022 39 ▼
perceptions and employer activity
QS World University Rankings University quality 2021 101* ▲
332 competitiveness criteria related to
IMD World Competitiveness Ranking competitiveness, digital competitiveness and 2020 12 ▼
talent
‡ CHANGE ON PREVIOUS PUBLICATION OF THE RELEVANT BENCHMARK. AN UPWARD-POINTING ARROW DENOTES AN IMPROVEMENT. *TCD.
// 13HOUSING
High levels of residential property
transactions sustained through to June 2021
Dublin Residential Property Transactions (SA) JUN '21
DUBLIN RESIDENTIAL PROPERTY TRANSACTIONS (SA) 1,668
YEAR ON YEAR % CHANGE +57.7
2,531
Max IRELAND RESIDENTIAL PROPERTY TRANSACTIONS (SA) 5,802
YEAR ON YEAR % CHANGE +93.5
The volume of residential property transactions in Dublin
remained at a high level through the second quarter of
2021, having reached a new peak in January. Over 1,500
properties (SA) were sold in each of April, May and
June - no doubt aided by the return to activity of the
construction industry and real estate service providers.
For June 2021 alone, property transactions increased
YoY (+57.7%) but also, more notably, rose relative to
the same month in pre-Covid 2019 (+6.4%). Mortgage
lending is 'normalising' following the pandemic and may
spur further property market activity as 2021 proceeds.
SOURCE: CSO. SEASONALLY ADJUSTED BY GRANT THORNTON.
House prices continue to climb, supported by
consumer savings
Residential Property Price Index (2015 = 100) JUN '21
PROPERTY PRICE INDEX DUBLIN 131.6
YEAR ON YEAR % CHANGE +6.4
PROPERTY PRICE INDEX NATIONAL EXCL. DUBLIN 156.4
YEAR ON YEAR % CHANGE +7.3
House prices in Dublin remained on an upward trajectory
in the second quarter of 2021. The house price index
131.6
Max for the Capital reached its highest point since 2008 in
June, rising by 1.3% MoM and by 6.4% YoY to stand
at 131.6. June was the eleventh consecutive month in
which prices increased, and this is evidence of heightened
consumer savings combined with the pent up demand
which currently exists for the limited housing stock in
the Capital. Prices rose at an even stronger rate outside
of Dublin in June as respective MoM and YoY increases
of 1.6% and 7.3% were recorded.
National excl. Dublin Dublin
SOURCE: CSO.
NOTE: 2015 = 100.
14 //HOUSING
Dublin residential rents increase to reach new
peak
Residential Rents € Per Month Q1 '21
DUBLIN AVG RESIDENTIAL RENT € PER MONTH 1,816
YEAR ON YEAR € CHANGE +110
Residential rents in Dublin reached a new peak of over
€1,800 in Q1 2021. Rents increased by 6.5% or €110
€1,816 YoY in the quarter. This reflected QoQ growth of 5.1%
Max
or €88, and followed a dip in the final quarter of 2020
which was the first such decline in 5 years. Rents rose
at a faster pace both in the Greater Dublin Area (GDA,
+8.3% YoY) and outside the GDA (+7.9% YoY) in Q1.
According to the RTB, this may be the start of a trend of
people moving outside of urban centres such as Dublin
as remote working continues beyond the worst of the
pandemic.
Dublin Greater Dublin Area Outside GDA
SOURCE: RTB
Housing commencements surge in Dublin in Q2
Dublin House Commencements & Completions Q2 '21
TOTAL HOUSE COMMENCEMENTS 5,013
YEAR ON YEAR CHANGE +3,859
5,013 TOTAL HOUSE COMPLETIONS (SA) 1,624
Max YEAR ON YEAR CHANGE +740
Housing commencements in the Dublin region
experienced a boom in Q2 2021 as the construction
2,007 sector kicked back in to life. Commencements exceeded
Max 5,000 in Q2, the highest quarterly level since the mid-
2000s. The Q2 figure represented sizeable QoQ and YoY
jumps from the respective commencement levels of 395
in Q1 2021 and 1,154 in Q2 2020.
Housing completions also rebounded in the quarter,
rising by 38.6% QoQ and 83.6% YoY to stand at
1,624 (SA). It will be expected that the sharp increase
in commencements will feed through to much needed
supply to the Dublin rental and owner-occupier markets
Commencements Completions (SA) over the coming quarters.
SOURCE: CSO, DHLGH
NOTE: DATA FROM JANUARY TO MARCH 2021 HAS BEEN REVISED. THE FIGURES FOR THOSE MONTHS WERE ORIGINALLY
UNDER-STATED DUE TO A DHLGH DATA PROCESSING ERROR.
// 15TRANSPORT & TRAVEL
Public transport usage recovers from Q1
trough
Public Transport Million Trips (SA) Q2 '21
PUBLIC TRANSPORT MILLION TRIPS (SA) 23.2
YEAR ON YEAR % CHANGE +65.0
Passenger numbers on Dublin's public transport system
recovered from a trough in Q1 2021 to stand at 23.2
million (SA) in the second quarter of the year. This
reflected QoQ and YoY increases of 57.3% and 65%
respectively, and will have been aided by the return of
many staff to workplaces and the lifting of economic
and travel restrictions in the Capital. Dublin Bus was
the principle driver of the quarterly uplift as passenger
journeys on the service rose from 10.9 million in Q1 to
16.2 million in Q2. Further increases are anticipated
across all modes over the remainder of the year as the
hospitality sector and offices re-open fully, and public
transport returns to 100% capacity.
Luas Irish Rail
Bus Éireann Dublin City Bus
SOURCE: NTA. SEASONALLY ADJUSTED BY GRANT THORNTON.
NOTE: PROVISIONAL DATA VERIFIED BY ALL OPERATORS.
Road traffic volumes remain stable through
summer 2021
Dublin Average Daily Traffic Count '000s (SA) AUG '21
AVERAGE DAILY TRAFFIC COUNT (SA) 580,200
YEAR ON YEAR % CHANGE +10.5
PEAK VOLUME COUNT (AM) (SA) 40,247
YEAR ON YEAR % CHANGE +15
PEAK VOLUME COUNT (PM) (SA) 47,252
YEAR ON YEAR % CHANGE -4.1
Traffic volumes on the Dublin road network were
relatively stable through the summer months of 2021.
Average daily traffic counts on the eight thoroughfares
analysed increased rapidly in April with the easing of
Level 5 travel restrictions and remained steady thereafter.
By August, traffic levels stood 10.5% above the same
Storm
Emma period in 2020, but considerably below pre-pandemic
201,469 averages. Notably, peak volumes in the morning on
Min
the road network were up by 15% YoY yet the evening
equivalent was down by 4.1% compared to the same
timeframe in 2020.
SOURCE: TII. SEASONALLY ADJUSTED BY GRANT THORNTON. DATA IS WEEKLY.
16 //TRANSPORT & TRAVEL
Dublin airport throughput rises with further
significant increases anticipated
Dublin Airport Passengers '000s (SA) Q2 '21
TOTAL PASSENGERS '000s (SA) 605
YEAR ON YEAR CHANGE '000s TRIPS +449
Total passenger throughput at Dublin Airport edged
up in Q2 2021, but still remained down by over 92%
8.22m
Max from its 2019 peak. Just over 600,000 passengers (SA)
arrived at and departed from the airport in the second
quarter of the year as travel restrictions within Europe
and further afield were eased. Although at low levels
relative to pre-pandemic times, passenger numbers grew
by 119,000 or 24.5% QoQ. Further, sizeable increases
will be anticipated for Q3 and beyond, especially as
the Digital Covid Certificate eases travel between EU
member states.
SOURCE: CSO & DUBLIN AIRPORT. SEASONALLY ADJUSTED BY GRANT THORNTON.
NOTE: DATA RE-ADJUSTED SINCE LAST ISSUE
Dublin port throughput recovers from latest
trough
Dublin Port Tonnage Million Tonnes (SA) Q2 '21
DUBLIN PORT EXPORTS MILLION TONNES (SA) 3.58
YOY CHANGE MILLION TONNES (SA) +0.12
10.1 DUBLIN PORT IMPORTS MILLION TONNES (SA) 5.41
Max
YOY CHANGE MILLION TONNES (SA) +0.92
Throughput at Dublin Port recovered in Q2 2021,
following a historical low in Q1. Total cargo handled
increased by 14.9% QoQ to reach 9 million tonnes
(SA). This represented a 13% YoY increase though
volumes remained below the peak of 10.1 million
tonnes recorded in Q4 2020. Imports were the main
driver in Q2, rising by 920,000 tonnes YoY (+20.4%).
Exports also increased, but at a slower rate of 3.6% YoY
(120,000 tonnes). Brexit continues to affect the pattern
of trade as 40% growth on Ro-Ro and Lo-Lo services to
Continental Europe has been recorded since the UK left
the EU, compared to a decline of 19% on services with
Total Tonnage Exports Imports ports in the UK.
SOURCE: DUBLIN PORT. SEASONALLY ADJUSTED BY GRANT THORNTON.
NOTE: DATA RE-ADJUSTED SINCE LAST ISSUE.
// 17SPECIAL REPORT
Strong Dublin tourism recovery
expected from the depths of 2020
The impact in Dublin has been greater than the
Caeman Wall national average. Pre-Covid-19, the city attracted more
Head of Economic & overseas tourists and much of its domestic business was
event based. Average revenue per available room was
Industry Analysis, Fáilte
down 78% last year.
Ireland
2021 More Challenging Than Expected for Tourism
2021 has not developed as expected for tourism. Actions
taken to contain Covid-19 and mitigate the risks to
2020 Was A Challenging Year public health continue to affect the tourism industry
There is strong evidence of the trading difficulties more than any other economic sector. For example:
tourism operators experienced last year. Owing to • Tourism relies on face-to-face interactions. The
their much larger scale and significant capital costs, we experience cannot shift to virtual service delivery.
have much better data from the hotels sector, but the • Travelling to destinations is an inherent part of
challenges are the same for all accommodation formats tourism. And travel restrictions choke off tourism
and across tourism. demand.
Nationally, hotel occupancy fell from 78% in 2019 to • Highly interlinked business eco-system. Tourism
33% in 2020. While the fall in average daily rates was services are interdependent and a problem in one
less dramatic at 20%, the combined effect of reduced sub-sector has knock-on effects on others. The
occupancy and room rates meant that average revenue delayed reopening of indoor dining pushed back the
per available room was down two-thirds overall. reopening of the wider tourism economy.
• Reduced operating capacity. Of the almost 80% of
HOTEL PERFORMANCE 2019 2020 YOY Δ
tourism businesses that planned to trade over the
RESULTS FOR DUBLIN summer the majority are running at limited capacity,
OCCUPANCY 82% 25% -70%
with 37% of accommodation providers and 61% of
non-accommodation businesses working at less than
AVERAGE DAILY RATE €142.2 €103.5 -27%
50% capacity.
REVENUE PER AVAILABLE ROOM €116.7 €25.5 -78% • Staffing challenges: Tourism’s delayed reopening
SOURCE: STR means that businesses still find it difficult to staff-up
so as to meet demand.
18 //SPECIAL REPORT
Domestic tourism has restarted, and it is helping pre-pandemic levels and domestic tourism is expected to
to mitigate the impact on jobs and businesses in some be well ahead of pre-pandemic levels by then.
destinations. However, a real recovery will only be STR, a global leader in accommodation performance
possible when international tourism returns because monitoring and reporting, have produced forecasts for
Ireland’s tourism sector is, compared with most other Dublin taking into account new properties coming on
EU member states, highly dependent on overseas travel. stream, estimating:
They account for some 70% of spending in Ireland by • Over the next three years, occupancy is expected to
tourists. Since the pandemic there has been a complete expand at an average annual rate of 40.9%, while
collapse in overseas travel to Ireland. For example, over average daily rate is expected to expand at an average
the first six months of 2021 overseas arrivals were down annual rate of 8.2%.
95% on 2019 levels. • By 2023, average daily rate will be close to 2019 levels
and room occupancy will be close to 70%.
But Tourism Always Recovers
• By 2025, the results will be better again, with
Looking at the bigger picture, tourism always recovers
occupancy at 76% and rates at over €140.
stronger and more resilient from each shock. As the long-
term view shows, the upward trend is robust, sustained The strong pipeline of new tourist accommodation
and persistent. stock, especially hotels, that has come on stream in
Demand will return once peoples’ freedom to travel recent years, and with more to come, will be put to good
returns. The Irish Tourist Industry Confederation’s use once public health conditions allow.
outlook is that by 2025 overseas tourists will return to
Overseas Tourism to Ireland 1960-2020 ('000s)
9,674
Max
SOURCE: FÁILTE IRELAND
// 19Dublin Economic Scorecard
ECONOMY
IHS Markit Business Live Register SpendingPulse
PMI Q2 2021 Jul 2021 Sales Index Q2 2021
3 MONTH MOVING AVERAGE (SA) TOTAL NUMBER OF PEOPLE (SA) INDEX (2014 = 100) (SA)
60.2 47,354 129
25 63 44,700 105,143 108 134
TRAVEL
Hotel Occupancy Rate Seaport Cargo Public Transport Trips
Jul 2021 Q2 2021 Q2 2021
% OF TOTAL ROOMS (SA) MILLION TONNES/QUARTER (SA) MILLION TRIPS/QUARTER (SA)
43.1 9.0 23.2
6 84 6.8 10.1 14.0 61.6
RESIDENTIAL PROPERTY
Average Residential Residential Property Housing Completions
Rents Q1 2021 Price Index Jun 2021 Q2 2021
€/QUARTER INDEX (2015 = 100) UNITS/QUARTER (SA)
1,816 131.6 1,624
1,037 1,816 65 132 438 2,007
COMMERCIAL PROPERTY
Dublin City Centre Dublin 2/4 Office Dublin Suburbs Office
Office Rent Q2 2021 Vacancy Rate Q2 2021 Vacancy Rate Q2 2021
INDEX (2006 = 100) % %
105 6.3 10.3
50 118 4 18.4 6 24
SOURCES: CSO, PMI IHS MARKIT; SEAPORT CARGO DUBLIN PORT; PUBLIC TRANSPORT NTA; RESIDENTIAL RENTS RTB; COMMERCIAL PROPERTY CBRE RESEARCH, HOTEL OCCUPANCY STR GLOBAL. NOTE: THESE
"PETROL GAUGE" CHARTS PRESENT THE PERFORMANCE OF THE PARTICULAR INDICATOR RELATIVE TO A RANGE OF PERFORMANCES FROM MOST POSITIVE (GREEN) TO LEAST POSITIVE (RED). EACH GAUGE PRESENTS
THE LATEST VALUE COMPARED TO THE PEAK VALUE AND THE TROUGH VALUE OVER THE LAST DECADE (EXCEPT FOR PUBLIC TRANSPORT TRIPS, MASTERCARD SPENDINGPULSE AND STR GLOBAL WHICH COVER
THE PAST 5 YEARS, HOUSING COMPLETIONS WHICH COVER THE PAST 6 YEARS, AND THE LIVE REGISTER WHICH COVERS THE PAST 9 YEARS). THE COMMERCIAL PROPERTY GAUGES ARE RED AT THE HIGH AND LOW
EXTREMES, IN RECOGNITION OF THE UNDESIRABILITY OF RENTS THAT ARE EITHER TOO HIGH OR TOO LOW AS WELL AS VACANCY RATES.You can also read