Quarterly Property Market & Economic Update - New Zealand | Quarter 2, 2021 - Data to June 2021 - CoreLogic
←
→
Page content transcription
If your browser does not render page correctly, please read the page content below

Quarterly
Property Market &
Economic Update
New Zealand | Quarter 2, 2021

Data to June 2021
1

Contents

About CoreLogic                                    3

Executive Summary                                  4

Macro Economic & Demographic Indicators            5
New Zealand Asset Classes                          6
New Zealand and Australia GDP Growth               7
New Zealand Population                             8
Migration                                          9
Regional Building Consents                        10
Consumer Confidence                               10
Employment                                         11
Interest Rates                                    12

Housing Overview                                  14
Early Property Market Indicators                  15
Listings                                          15
Lending Conditions                                16
Sales Volumes                                     18
Values                                            19
Rent                                              20
House Price Index                                 23
Buyer Classification                              24

Main Cities Housing Market Indicators             25
Auckland Market Activity                          26
Auckland Values                                   27
Auckland Suburb Value Change                      28
Current Auckland Suburb Values                    29
Hamilton Market Activity                          30
Hamilton Values                                    31
Tauranga Market Activity                          32
Tauranga Values                                   33
Wellington Market Activity                        34
Wellington Values                                 35
Christchurch Market Activity                      36
Christchurch Values                               37
Dunedin Market Activity                           38
Dunedin Values                                    39

CoreLogic Data and Analytics                      40
Legal Disclaimer                                   41

New Zealand
Quarter 2, 2021

2   © 2021 CoreLogic, Inc. All Rights Reserved.

About CoreLogic

CoreLogic is a leading property information, analytics and            Call us
services provider in the United States, Australia and New Zealand.    0800 355 355

CoreLogic helps clients identify and manage growth                    Wellington Office
opportunities, improve performance and mitigate risk, by              Level 14, 10 Brandon St
providing clients with innovative, technology-based services          Wellington 6011
and access to rich data and analytics.
                                                                      Auckland Office
Whilst all reasonable effort is made to ensure the information in     Level 5, 41 Shortland Street
this publication is current, CoreLogic does not warrant the           Auckland 1010
accuracy, currency or completeness of the data and commentary
                                                                      Email
contained in this publication and to the full extent not prohibited
                                                                      reports@corelogic.co.nz
by law excludes all loss or damage arising in connection with the
data and commentary contained in this publication.

3 © 2021 CoreLogic, Inc. All Rights Reserved.
Executive Summary

The NZ residential property market upswing has                            However, as the months pass, we would anticipate the tax changes
continued in the past three months, with mortgage                         to have a greater effect, and certainly push investors towards new-
                                                                          builds rather than existing properties – especially if the ability to
lending activity and sales volumes remaining pretty
                                                                          claim interest as a tax deduction applies indefinitely for the first
strong, and property values continuing to rise.                           owner (investor) of a new-build.
However, there is also now evidence that we’re close to (or at) a         On the flipside, there are signs that first home buyers (FHBs) have
turning point – mainly on the back of affordability pressures and         become more successful in accessing the market in the past few
the 40% deposit requirement for investors – and over the coming           months, after a struggle in the first quarter of the year. However,
months sales activity and the pace of value growth are likely to          they’ve traditionally been quite keen on new-builds, so an influx of
ease. That is simply reinforced by the fact that the Government’s         investors may not be ideal from a FHBs’ perspective.
tax changes at the end of March, while not having a major impact
yet, will start to have a greater effect as the months pass and the       Another notable development in the past few months is that the
ability to claim interest deductions is slowly phased out for current     Reserve Bank (RBNZ) has been given permission to design and
landlords.                                                                implement a system for capping debt to income (DTIs) ratios for
                                                                          mortgages, potentially at seven for owner occupiers and perhaps
After a hot start to 2021, sales volumes have eased back a little,        six for investors. However, given the process required to get DTIs up
running at about the same levels as 2019 (with 2020 not a fair            and running, they seem unlikely to be introduced before November
comparison due to lockdown this time last year). To be fair, the          this year. And more importantly, the RBNZ wants to sit back and
continued lack of listings is still a restraining influence on achieved   assess the effects of rule changes already made before taking
sales volumes – you can’t buy what’s not for sale. But our data on        further steps – we think the market will have slowed of its own
valuations ordered by banks (as an early indicator of borrowers           accord by the end of the year, hence DTIs won’t be required in this
applying for loans) also suggests that demand has eased too. Of           cycle.
course, that shouldn’t come as a surprise, especially since a number
of deals would have already been pulled forward from later in the         The outlook for the economy and inflation will also of course have a
year to beat the tighter LVR rules on 1st March and 1st May (but          large bearing on the housing market, and the good news is that
imposed by the banks themselves much earlier than that).                  NZ’s GDP expanded strongly (1.6%) in Q1 2021 and the
                                                                          unemployment rate has now fallen for two consecutive quarters (to
In the mortgage market, there are also tentative signs of a               4.7%). However, solid demand hitting up against supply/capacity
slowdown, on the back of low-deposit investor lending cooling off.        pressures (e.g. due to COVID-related shipping delays) is starting to
However, activity has still held up better than might have been           create speculation about higher inflation, which in turn would see
anticipated – with our analysis suggesting that’s likely to be due to     the official cash rate (OCR) rise and so too mortgage rates. Indeed,
‘other’ lending, such as top-up loans, bank switches, and possibly        it’s now anticipated that the OCR could even be increased this year,
early breaks of fixed loans (rather than mortgage events related to       and longer dated mortgage rates have already risen – with the
property transactions).                                                   likelihood for more to come. Given that mortgages are larger than
So far, property values haven’t shown clear and obvious signs of a        before in dollar terms, any given rate rise will likely tend to have a
slowdown, however the monthly gains on the CoreLogic House                greater impact on household finances.
Price Index have at least eased a little in recent months – from 3.1%     Overall, 2021 has certainly been ‘the year of property politics’ so
in April, to 2.2% in May, and 1.8% in June. As sales activity dips over   far, and it seems set to stay that way too. However, as the market
the months, it’s also likely that a slowdown for values will become       cools over the coming months and into 2022, the political element
more evident, albeit house price falls still seem unlikely in this        should ease as ‘normality’ returns for sales activity and price
cycle.                                                                    growth, and the strains on would-be first home buyers in terms of
In terms of the tax changes at the end of March, the effects so far       trying to save enough for their deposit to keep pace with the
aren’t overwhelming – we certainly haven’t seen a mass sell-off by        market aren’t as intense.
current landlords or clear evidence yet of a large spike in rents. It’s   As always, we keep a running monitor on the property market every
important to note that our Buyer Classification series does show a        week via our NZ Property Market Pulse articles, so be sure to check
clear drop in market share for mortgaged investors since March, but       these out on our website www.corelogic.co.nz/research-news.
we suspect most of that is due to the 40% deposit requirement             Our podcast is also a great source of data and commentary:
rather than necessarily the extended Brightline Test or removal of        corelogicnzpropertymarket.buzzsprout.com.
interest deductibility.

4 © 2021 CoreLogic, Inc. All Rights Reserved.
Macro Economic &
Demographic Indicators

5 © 2021 CoreLogic, Inc. All Rights Reserved.
New Zealand Asset Classes

RESIDENTIAL REAL ESTATE                            NZ LISTED STOCKS

$1.54 trillion                                     $185 billion

COMMERCIAL / INDUSTRIAL REAL ESTATE                NZ SUPER & KIWISAVER

$235 billion                                       $140 billion

The value of residential property across the country as at Q2 2021 was $1.54T, so with
mortgages secured against 21% of that value, the other 79% of the property market is
household equity. However, it’s also important to note that household debt is high
relative to income, and to some extent the debt has only been sustainable recently
because of low mortgage rates. Indeed, even small rises from the current low base for
mortgage rates may start to put strain on some households, especially since average
mortgage sizes have risen.

After a rally through March and April, the NZX 50 generally dropped in May and
although it recouped some of those losses through June, the level was still below the
late April peak (and also the January peaks). In recent months, the NZ Super Fund
and KiwiSaver pots have continued to perform pretty well, no doubt partly supported
in their growth by ongoing member contributions.

6   Sources: CoreLogic NZ, Reserve Bank of NZ, NZX, NZ Super Fund
NZ & Australia GDP Growth
 8
                                                                                                              NZ
                                                                                                              Australia
 6

 4

 2

 0

 -2

 -4
   1990           1994           1998           2002            2006   2010      2014           2018

Annual Average GDP Growth (%)
The performance of the economy in the first three months of 2021 surprised almost everybody, with GDP
rising by a robust 1.6% - which means that the economy is now about 1% larger than it was pre-COVID
(albeit still about 2% smaller than it would have been without COVID). That’s an impressive result, given
the absence of international tourists, although of course it has also involved large amounts of government
spending and associated higher levels of public debt (which may be a longer term restraint on activity).

15%
                                                                                                              NZ Activity Index

10%                                                                                                           GDP

 5%

 0%

-5%

-10%

-15%
           Scales adjusted – April NZAC reading +40.7%
-20%
    2012                                                 2016                            2020

Annual Change in New Zealand Activity Index and GDP (%)
Looking ahead, the vaccination roll-outs around the world bode well for the return of normal tourism and
international trade over perhaps a 1-2 year horizon, which will help drive NZ’s economic growth. However,
it also needs to be noted that inflation pressures are building and so the flipside of economic recovery is
that interest rates will need to rise – putting pressure on mortgage borrowers.

 7     Sources: Reserve Bank of New Zealand, Stats NZ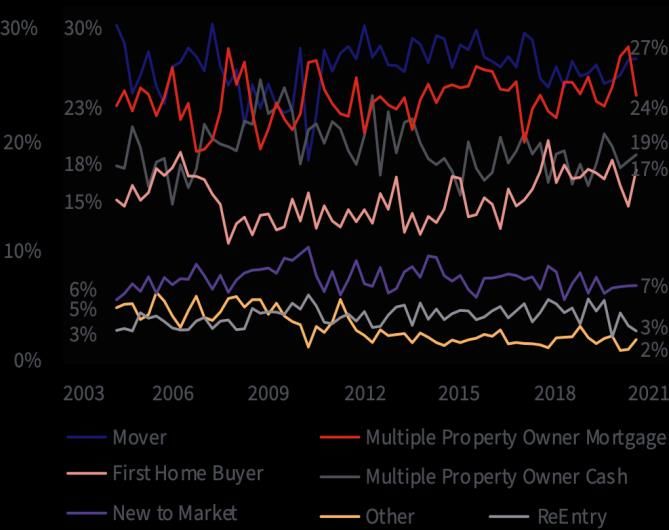
NZ Population & Migration

Quarterly Change in National Population                                    Population Change Composition
(persons per quarter)                                                      (persons per quarter)
45000                                                                     40000
40000               Quarterly population change                                            Natural increase
                    4 quarter moving average                              30000            Net migration
35000
30000
                                                                          20000
25000
20000
                                                                          10000
15000
10000
                                                                              0
 5000
     0                                                                    -10000
         1992    1996      2000       2004   2008   2012   2016    2020            1996   2000    2004        2008   2012     2016     2020

Annual Change in Population (persons)

New Zealand                                                                                                                   105000

     Auckland                                              37000

     Hamilton             4200

     Tauranga              5100

    Wellington           3100

Christchurch                   7000

      Dunedin           1800

In the year to March 2021, NZ’s population only rose by 33,200             NZ only gained a net 6,500 new migrants, the smallest annual
(to hit 5.12m), the smallest annual increase since 29,500 in the           figure since Q1 2013, when it was 2,500 (having improved from a
year to March 2013. For comparison, a year ago, the population             figure of -3,400 in the year to March 2012). In other words, for
had risen by almost 118,000.                                               the first time in about seven years, the natural rate of growth
                                                                           (i.e. births minus deaths) has been the primary driver of overall
Of course, the sharp slowdown in population growth comes as
                                                                           population growth, coming in at a total of 26,700 over the past
no surprise, given that the borders remain largely closed (except
                                                                           12 months.
for the Australian travel bubble). Indeed, in the year to March,

8        Source: Stats NZ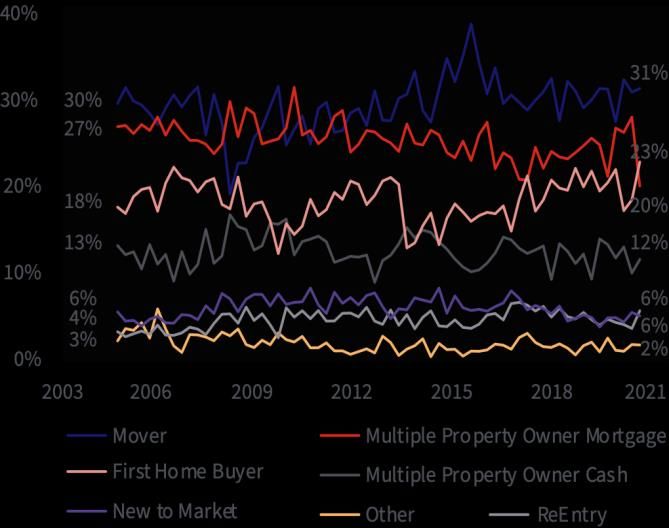
NZ Population &
Migration
Long Term Migration (12-month rolling totals)
200,000
                                                                                                          Net

                                                                                                          Arrivals
150,000
                                                                                                          Departures

100,000

 50,000

     0

-50,000
          2002            2006                2010                2014                2018

Migration Flows for NZ Citizens (12-month rolling totals)
 80,000                                                                                                   Departures

 60,000                                                                                                   Arrivals

                                                                                                          Net total
 40,000

 20,000

     0

-20,000

-40,000

-60,000
          2002            2006                2010                2014                2018

Looking ahead, we’d be reasonably confident that the opening of borders over the coming years will see
NZ’s net migration figure bounce back – but we also do need to be cautious about the scope for kiwis to
start moving back to Australia in greater numbers.

9    Source: Stats NZ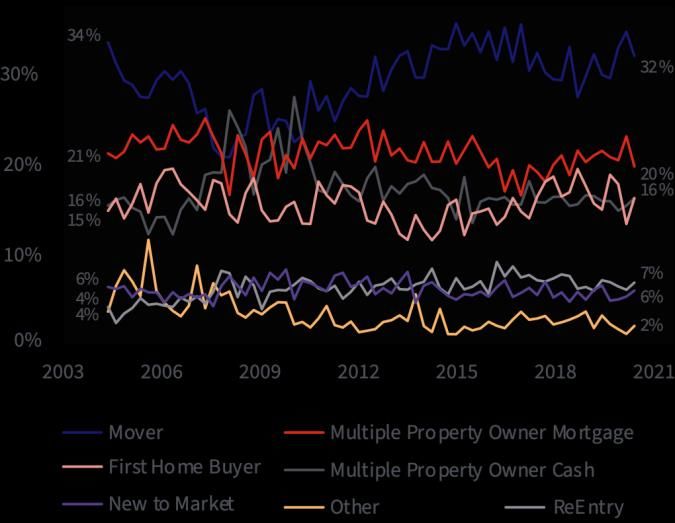
Building Consents
1,800
                                                                                                                  Auckland Region
1,600
                                                                                                                  Waikato Region
1,400
                                                                                                                  Wellington Region
1,200
                                                                                                                  Canterbury Region
1,000
                                                                                                                  Rest of NI
 800
                                                                                                                  Rest of SI
 600

 400

 200

     0
         1995          1999         2003            2007            2011           2015            2019

New Dwelling Consents Trend (consents per month)
It’s still a great time to be a builder, with dwelling consents running at record highs, driven geographically
by Auckland and in terms of property type by smaller dwellings such as townhouses. Given our rising
occupancy rate (people per household) and (un-)affordability pressures, a more intensified housing stock
seems to make a lot of sense. Indeed, in Australia where home ownership rates are higher than NZ,
units/apartments comprise a much bigger share of housing stock.

However, while the number of consents are high in absolute terms across NZ, it doesn’t really stand out on
a per capita basis. Indeed, we’ve recently been consenting about 7.5 new dwellings per year for every
1,000 people in the country, which is the highest for about 15 years, but still well below the figures of 13 in
1973 and 12 in 1974. In other words, we need to keep dwelling consents going at current levels for a
number of years yet, or perhaps even raise them further.

On that note, the emerging problem is capacity pressure in the construction industry, both in terms of
supply of materials and labour, which is leading to rising costs. That seems to be coming just at the wrong
time, as obviously a higher cost to build a new property will discourage some households from doing so,
and mean that our dwelling shortage (at prices more people can afford) lasts longer than otherwise.
Similarly, those capacity pressures are likely to lead to a longer duration between consent being granted
and the property finally being built.

It’s not just new dwelling construction that is running at high levels either; consents issued for alterations
to existing properties (let alone non-consented work) are also strong, with more people choosing to ‘love
it’ rather than ‘list it’. Indeed, we suspect that the shortage of available listings on the market is a key
reason why owner-occupiers are staying where they are instead and making their existing property better
for their needs.

Putting aside any costs issues, at least the recent changes to the property investment landscape have
certainly incentivised investors to look at new-build properties, which should give developers confidence
about their future demand levels. These incentives for investors include exemptions for new-builds from
the LVR rules and also the Brightline extension, while interest deductibility can also continue to be used –
and the Government’s consultation documents certainly suggest that deductibility terms could be quite
generous, potentially in perpetuity for the first owner (investor) of a new-build property.

10       Source: Stats NZ
Consumer Confidence
160
140
120
100
80
Average
60
40
20
0
2004 2006 2009 2011 2014 2016 2019
ANZ-Roy Morgan Consumer Confidence (Index, Monthly)
After a flat patch in March as the country moved back up and down the COVID alert levels – and the
Government announced the policy changes that reduced the profitability of owning an investment
property – consumer confidence has resumed its upwards trend in the past few months. At a seasonally
adjusted reading of 117.4 in May, the ANZ Roy Morgan index was at its highest level since February last
year, and not far below the long term average for this series of 118.7 (back to January 2004).
There’s a good chance that consumer confidence will stay relatively strong in the coming months, as the
labour market continues to rebound and house prices rise (albeit at a slower pace). However, COVID
uncertainty is always a risk (even despite the vaccination programme) and the medium-term prospect of
rising mortgage rates will start to dent households’ sentiment too. Overall, we doubt that a slump in
confidence is on the horizon (which should underpin the housing market), but nor is sentiment likely to
surge higher either.
11 Source: ANZ, Roy MorganEmployment
Annual Change in Employment Labour Force Participation Rate (%)
10% 72
8%
6% 68
4%
2%
64
0%
-2%
60
-4%
-6% Full time Part time
-8% 56
1987 1998 2009 2020 1987 1998 2009 2020
Unemployment Rate (%) Number of Jobseeker Support Claimants
12
240,000
220,000
9
200,000
180,000
6
160,000
3 140,000
120,000
0 100,000
1986 1997 2008 2019 Jan-20 Apr-20 Jul-20 Oct-20 Jan-21 Apr-21
The labour market has certainly been a relative ‘success story’ were more than enough jobs to soak up the people that decided
of the post-COVID era, with the overall level of employment to return to the labour force in Q1 2021. The unemployment rate
managing to largely shrug off the worst effects of the pandemic, remains above the previous trough (4%), but still comfortably
although of course some sectors have been hit harder than below the decade average of 5.2% - and well below some
others – e.g. tourism has weakened, but construction has grown forecasts that COVID could cause it to rise towards (or above)
strongly. Overall, the level of employment in Q1 2021 was 0.4% 10%.
higher than a year earlier (i.e. still a period not materially
Looking ahead, the potential slow re-opening of global business
affected by COVID), albeit with part-time roles rising by 2.4%
activity as the vaccination programmes move forward would be
and full-time basically flat. This hints at one area where we still
a boost for our export-oriented economy, and hence help to
have ‘spare capacity’ in the labour market – i.e. people who are
support the labour market. In turn, that would also bolster the
part-time but may want to be full-time.
housing market, both in terms of sales activity and property
However, there are other measures of strength too – e.g. the values. In fact, relative to the possible recession we could have
labour force participation rate actually rose in the first quarter faced, property is already being supported by lower
of 2021 (i.e. proportionately more of the working age population unemployment.
were either in work or actively seeking a job) but despite that
bigger pool for active labour market participants, the
unemployment rate fell from 4.9% to 4.7%. In other words, there
12 Sources: Stats NZ, Ministry of Social DevelopmentInterest Rates
In broad terms, we’re at a turning point for mortgage rates, with Mortgage Interest Rates (%)
the likelihood that over the next 12-18 months most durations 25
will have seen an increase. Certainly, off the back of rises in
global market rates and also the Reserve Bank’s clearer 20
indication that the official cash rate will start to rise from 0.25%
at some stage soon (and could increase to 1.75% by mid-2024), 15
longer dated fixed rates in NZ have already increased – e.g. from
less than 3% for a five year rate to closer to 3.5% now. 10
However, at the same time, it’s still competitive in the lending
5 Floating mortgage interest rates
market and the banks have access to cheap money from the
2 year fixed rate
Funding for Lending Programme (which so far has only seen
0
about $3bn of the potential $30bn total drawn down). 1965 1983 2002 2021
Accordingly, at shorter durations, such as a one year fixed term,
mortgage rates have actually dropped a bit in the past few
months – and that’s still proving attractive to many borrowers Official Cash Rate & Mortgage Rates (%)
who are opting for the lowest cost rather than long term 12
certainty. OCR history
OCR projection
For now, a strategy of rolling over consecutive one year fixed 9
2-yr fixed mortgage
rates still looks to cost a bit less than fixing longer term, but that
could change quickly if the economy continues to rebound
6
quickly, inflation rises by more than expected, and those longer
term fixed rates rise beyond where they sit now. However, it’s
also important to note that the end point for mortgage rates is 3
arguably still a lot lower than in the past – perhaps an indicative
5% or less, versus rates of 8-9% previously.
0
2000 2007 2014 2021
Average Two-Year Fixed Rates (%)
5.2%
4.7%
4.2%
3.7%
3.2%
2018 2019 2020 2021
13 Sources: Reserve Bank of NZ, interest.co.nzHousing Overview 14 © 2021 CoreLogic, Inc. All Rights Reserved.
Listings

Weekly Flow of New For-Sale Listings                                       Weekly Flow of New For-Rent Listings
6,000                                                                       4,000

                                                                            3,500
5,000
                                                                            3,000
4,000
                                                                            2,500
3,000                                                                       2,000

                                                                            1,500
2,000                                                   2019                                                                       2019
                                                        2020                1,000                                                  2020
1,000
                                                        2021                 500                                                   2021

     0                                                                         0
     Jan-21        Mar-21        Jun-21        Sep-21          Dec-21          Jan-21        Mar-21        Jun-21         Sep-21          Dec-21

A key and ongoing feature of the NZ property market in recent              market lately, they’re still present in decent numbers, and
times has been the low supply of listings available on the                 they’re not selling anything before they purchase either.
market, which has been bolstering property values as buyers
                                                                           Meanwhile, despite some suggestions that the Government’s tax
continue to face limited choice. There has been no material
                                                                           changes at the end of March would cause larger numbers of
change in the tight listings situation in the past three months
                                                                           investors to sell their properties, there are very few signs this is
either, with the total stock of existing properties available for
                                                                           happening to any great degree (indeed the overall new flow of
sale running at multi-year lows. In turn, that has reflected both a
                                                                           listings hasn’t spiked at all). That said, with investors’ purchases
continued stream of achieved sales (which removes listings at
                                                                           of existing properties likely to be curtailed in the coming
the end of pipeline) but also only a ‘normal’ flow of new listings
                                                                           months, this might help the market to rebalance a bit more in
coming onto the market at the start of the pipeline.
                                                                           terms of the supply of listings versus active demand. However,
In some ways, there is a vicious circle going on for listings, with        the shift is unlikely to be dramatic.
some existing owner-occupiers not moving house because they
don’t have much choice about their next property. And of
course, those owners are then not listing their own house, which
feeds back into even tighter supply conditions. Similarly,
although first home buyers have found it tougher to access the

     Early Property Market Indicators
     During alert level four lockdown, measures relating to the early stages of a sale process – i.e. pre-listing (such as appraisals
     generated by real estate agents) and pre-mortgage (valuations ordered by banks) – fell away sharply, which was no surprise.
     However, as our Early Market Indicators Report shows, they then bounced back steadily, and have recently been running at
     around normal levels:

     www.corelogic.co.nz/early-market-indicators

15    Source: CoreLogic
Lending Conditions
7,000
Owner-occupier
6,000
Investor
5,000
4,000
3,000
2,000
1,000
0
-1,000
-2,000
-3,000
-4,000
2016 2017 2018 2019 2020 2021
Annual Change in Gross New Lending Flows ($m per month)
After a strong end to 2020 and beginning to 2021, the mortgage lending market has continued to operate
at a high level of activity in April and May. Indeed, after a record high of $10.5bn of new lending in March,
the figures for April and May were $8.5bn and $8.9bn respectively – both the highest for those particular
months of the year since at least 2014. Investors have retained a decent presence in the lending market in
the past few months, but if anything the balance of momentum is shifting more towards owner-occupiers,
including first home buyers.
Of course, those early signs of a shift in the borrower mix shouldn’t come as much of a surprise. After all,
although the Reserve Bank only mandated a 30% deposit for investors from 1st March this year and 40%
from 1st May, the banks themselves had been requiring those levels for several months prior (even before
Christmas last year in some cases). In that environment, it is logical to think that investors will be finding it
harder to meet lending criteria and will therefore see a reduced presence. Certainly, after the deposit
requirements were last lifted to 40% (in October 2016), investors’ market share tailed off over the course
of the following 9-12 months.
But this time around there’s also the added influence of the Government’s tax changes at the end of March
to take into account too – i.e. an extended Brightline Test for any further purchases of existing properties
and the removal of the ability to claim interest as a deductible expense (tapered over the next five years
for current landlords). Although there are few signs so far that these changes have had much of an effect in
their own right, their impact will become clearer over time, and could well channel demand from
mortgaged investors towards new-builds over existing properties – especially if the period where interest
could still be deducted on new-builds extends to ‘decades’ rather than ‘years’. On that note, more banks
are also starting to announce very favourable floating mortgage rates for those borrowers looking to
finance the construction of a property.
16 Source: Reserve Bank of NZLending Conditions
25%
20%
15%
10%
5%
0%
2014 2015 2016 2017 2018 2019 2020 2021
High LVR Lending (% of new lending)
Meanwhile, the Reserve Bank now also has permission to design and introduce limits on debt to income
(DTIs) ratios for new mortgage lending, if and when required. Their analysis indicates a potential cap for
investors of about six or so, and seven for owner-occupiers. However, it’s also worth noting that they
aren’t in a rush to impose DTI restrictions and indeed we suspect they won’t actually be required in this
cycle – in other words, the LVRs and tax changes already introduced will help to slow the market without
any further regulation.
The overall implication for the mortgage market is that higher-leveraged investors may pull back a bit
over the coming months. But so far at least, other buyers have been willing to step in, such as first home
buyers and less-leveraged investors. Even so, overall lending flows could cool into the second half of this
year and 2022, but probably not to any dramatic extent.
Refinancing Profile for Mortgages (% of stock)
50% Owner-occupier
Investor
40%
30%
20%
10%
0%
Floating Fixed < 1 year Fixed > 1 year
17 Source: Reserve Bank of NZSales Volumes
Property market activity levels have stayed pretty healthy in the Nationwide Sales Volumes (monthly total)
past few months, although not as strong as they were from
January to March. In other words, the figures for April-June
contain hints that we may be very close to (or at) a turning point.
Of course, part of the explanation for that could still lie with the
low levels of listings on the market – as the cliché goes, you
can’t buy what’s not for sale. And in that environment, it’s no
surprise that property values have still been rising.
However, it’s also no surprise that demand for property may
have moderated a little (albeit not to any major degree). After
all, due to bank criteria, investors have required a 40% deposit
for the past 5-6 months now, even if the Reserve Bank only
enforced that level from 1st May. Then on top of that, the
Government’s tax changes (i.e. Brightline extension to 10 years
and taper/removal of interest deductibility) have also been in Nationwide Annual Change
force for a few months now, making it harder for the sums to in Sales Volumes (%)
stack up for a mortgaged investor looking to buy further existing
properties – albeit new-builds still have appeal to investors,
given their exemptions.
Indeed, we think that a clearer slowdown for property sales
volumes will emerge in the second half of 2021 and into next
year. That will be due to the LVR and tax rules, as well as simply
the general affordability pressures in the market, and now the
medium-term prospect of rising mortgage rates. After a total of
about 98,000 sales in 2020, we think the total could be less than
95,000 in 2021 and closer to 90,000 in 2022. At those levels, sales
activity would be roughly in line with its long term average –
prevented from falling further by a growing economy, solid
labour market, and possibly the slow return of net migration
(boosting population growth). Regional Sales Volumes
(year-on-year % change)
18 © 2021 CoreLogic, Inc. All Rights Reserved.Values Average Value of Housing Stock - New Zealand ($) Property values have continued to rise sharply in the past three months, up by another 1.8% in June alone, and by 7.2% since the end of March. That followed a 7.2% rise in the three months to March and 6.1% in the three months to December. Indeed, over the past year, national average values have risen by 22.8%, to hit $906,532. That figure is more than $168,500 higher than a year ago – which serves to highlight the challenge for first home buyers at present, who in many cases (but not all) need to find 20% of that rise for their deposit to keep pace with the market. The same applies to many would-be ‘upsizers’ too. The key drivers for that increase in average values have been low mortgage rates and the tight supply of listings on the market, which has created intense competition at auctions and open homes. For property investors, there’s also been the additional boost provided by the lack of attractive alternatives – e.g. low term deposit rates have seen investors trying to find a ‘decent’ yield elsewhere. Annual and Quarterly Change in Value (%) However, affordability pressures have continued to escalate, and meanwhile we’ve now also got tighter LVR rules, tougher tax rules for property investors, DTIs in the Reserve Bank’s toolkit (soon), and also the medium term prospect of higher mortgage rates. For all of these reasons, it looks likely that we’re close to (or at) a turning point for the rate of growth in property values – albeit falls in prices don’t look likely for now (just slower growth); after all, unemployment is still low and there’s no sign of a GFC-style crunch of finance availability. 19 © 2021 CoreLogic, Inc. All Rights Reserved.
House Price Index

The upswing in property values has continued right across the            Average Dwelling Value ($)
country in recent months, and although the ‘provincial’ markets
are still seeing the largest gains, the main centres have been a
part of it too.

In fact, of 66 main territorial authorities across the country
(excluding Chatham Islands), none had growth in average values
in the year to June of less than 10% - the ‘softest’ was MacKenzie
District at 10.2%, followed by Central Otago at 11.3%. Only 14
areas saw growth of less than 20%, including Queenstown,
Nelson, Auckland, and Dunedin, while 28 had an increase of at
least 30% annually.

Those ‘fast growers’ included Porirua (32.4%), Hastings (32.5%),
Lower Hutt (33.3%), Upper Hutt (34.0%), Gisborne (35.8%),
Whanganui (35.9%), Kapiti Coast (36.3%), Palmerston North
(38.6%), and areas such as South Wairarapa (40.5%), Tararua
(48.0%), and Wairoa (51.9%) all in excess of 40% gains. Amongst
the other main centres, the annual increases in the year to June
2021 ranged from 21.7% in Christchurch, through to 23.2% in
Tauranga, 27.7% in Hamilton, and 28.9% in Wellington City.

Overall, there are essentially no parts of the country that have
been left untouched by this property market upswing in the past
9-12 months, creating more equity ‘on paper’ for owners, but
raising the barriers to entry for would-be buyers.

                              June 2021
                              Current value                          1 month    3 months     12 months   5 years
New Zealand                   $906,532                                 1.8%        7.2%         22.8%      53%
Auckland                      $1,283,895                               1.5%        5.3%         18.6%      32%
Hamilton                      $801,919                                 1.9%        10.0%        27.7%      63%
Tauranga                      $978,067                                 1.0%        9.0%         23.2%      63%
Wellington                    $1,024,649                               2.3%        9.5%         30.8%      98%
Christchurch                  $631,114                                 3.0%        9.6%         21.7%      28%
Dunedin                       $654,995                                 1.3%        5.5%         19.6%     100%

20   © 2021 CoreLogic, Inc. All Rights Reserved.
House Price Index Average Value of Housing Stock - New Zealand ($) Property values have continued to rise sharply in the past three months, up by another 1.8% in June alone, and by 7.2% since the end of March. That followed a 7.2% in the three months to March and 6.1% in the three months to December. Indeed, over the past year, national average values have risen by 22.8%, to hit $906,532. That figure is more than $168,500 higher than a year ago – which serves to highlight the challenge for first home buyers at present, who in many cases (but not all) need to find 20% of that rise for their deposit to keep pace with the market. The same applies to many would-be ‘upsizers’ too. The key drivers for that increase in average values have been low mortgage rates and the tight supply of listings on the market, which has created intense competition at auctions and open homes. For property investors, there’s also been the additional boost provided by the lack of attractive alternatives – e.g. low term deposit rates have seen investors trying to find a ‘decent’ yield elsewhere. Annual Value Change (%) Over a 12 month horizon, average property values have risen in all parts of the country, with the most strength still evident in the central and lower North Island. The South Island has generally been a little more subdued (e.g. MacKenzie District, Central Otago), but still seeing solid gains in property values. 21 © 2021 CoreLogic, Inc. All Rights Reserved.
House Price Index

Average Value of Housing Stock - New Zealand ($)
Property values have continued to rise sharply in the past three months, up by another 1.8% in June
alone, and by 7.2% since the end of March. That followed a 7.2% in the three months to March and 6.1% in
the three months to December. Indeed, over the past year, national average values have risen by 22.8%, to
hit $906,532. That figure is more than $168,500 higher than a year ago – which serves to highlight the
challenge for first home buyers at present, who in many cases (but not all) need to find 20% of that rise for
their deposit to keep pace with the market. The same applies to many would-be ‘upsizers’ too.

The key drivers for that increase in average values have been low mortgage rates and the tight supply of
listings on the market, which has created intense competition at auctions and open homes. For property
investors, there’s also been the additional boost provided by the lack of attractive alternatives – e.g. low
term deposit rates have seen investors trying to find a ‘decent’ yield elsewhere.

Three Month Value Change (%)
Over the shorter three-month period since March, the continued strong gains in the property market are
clear to see right across the country – again, the central and lower North Island features strongly, while parts
of Otago and Southland have been a little softer (albeit still seeing growing property values).

22   © 2021 CoreLogic, Inc. All Rights Reserved.
Rent

National Annual Change                                             Gross Rental Yield –
in Value and Rent (%)                                              National (%)
 30%                                                               5.0%

 20%                                                               4.0%

 10%                                                               3.0%

  0%                                                               2.0%

                                          Annual change in value
-10%                                                               1.0%
                                          Annual change in rent

-20%                                                               0.0%
       2007       2010        2013        2016         2019               2005     2008       2011      2014       2017       2020

According to the Stats NZ rental price index, the growth in rent   lull last year, which now seems to have been unwound – rents
for new tenancies has accelerated lately, rising from an annual    looks to be about where they ‘should’ be on a trend basis.
pace of only about 1.5% in the final three months of 2020 to
                                                                   Looking ahead, it’s certainly true that some landlords will be
more than 3% over the past three months (and 4.5% in May
                                                                   looking to push up rents faster than otherwise, in order to try
alone). It’s possible that some of that increase has been due to
                                                                   and recoup some of their increased (tax) costs. But history has
landlords wanting to raise rents in response to the
                                                                   shown they can’t always achieve this – e.g. rents tend to be
Government’s tax changes at the end of March.
                                                                   anchored more closely to tenants’ wages rather than landlords’
However, it’s very difficult to disentangle that effect from the   costs, and regulations such as the Healthy Homes standards
simple supply/demand pressures that are evident in the rental      haven’t prompted a noticeable jump in rents. Indeed, it’s often
market (and arising from the same shortage of physical             the case that landlords want to keep a good tenant and avoid a
dwellings that has also put upwards pressure on the prices that    vacancy rather than extract maximum rent. Overall, rents will
buyers are having to pay too), as well as the likelihood that      continue to rise, but we doubt that there’ll be a tax-driven spike
there’s a rental ‘catch-up’ underway after last year’s freeze.     over and above ‘normal’ growth.
Indeed, when you look at the level of rents, there was clearly a

23     © 2021 CoreLogic, Inc. All Rights Reserved.
Buyer Classification
Buyer Classification – NZ Property Transfers by Non-Citizens
New Zealand (% of purchases) or no Resident Visa (% of total transfers)
3.5%
Buying
3.0%
Selling
2.5%
2.0%
1.5%
1.0%
0.5%
0.0%
2017 2018 2019 2020 2021
After a record peak for mortgaged investors’ presence in the to step in and tighten investor tax rules, as well as the Reserve
property market, our Buyer Classification data is now showing a Bank reinstating the LVR rules. Accordingly, we are now seeing
turning point, with their share of purchases having dipped from the market share for mortgaged investors ease back again, and
29% in Q1 2021 to 25% in Q2 – the lowest figure for about a year. that trend probably has further to run. The last time deposit
To be fair, they’re still making a reasonable number of requirements were lifted to 40% (October 2016) we saw
purchases, just that other participants in the market have mortgaged investors’ market share trough at 22%, but it seems
gained in confidence and their ability to buy – especially first likely that with the extra focus on them this time around (from
home buyers and equity-rich investors. However, ‘movers’ (or the Government in particular) a trough of 20% or perhaps even
relocating owner-occupiers) are still a bit less active than less can’t be ruled out.
normal.
That would of course open up opportunities for other buyer
In terms of the detail, starting with mortgaged investors, their groups, and we’ve already seen the market share for first home
surge once the LVR rules had been removed in May last year was buyers rise again in the past few months, from 21% in Q1 2021
a key property market talking point in the second half of 2020 to 24%. The burden of raising a deposit (with property values
and into the first three months of this year. From a market share themselves having already risen so far) is unlikely to get any
of 24% in Q2 last year (which had already crept higher from 23% easier, but at least FHBs are still able to access KiwiSaver,
in mid-2019), mortgaged investors’ (or multiple property compromise on location/property type, and also take
owners/MPOs) increased to a 29% presence in Q1 2021 – a advantage of the LVR speed limits (where 20% of owner-
record high, surpassing the previous peak of 28% seen at occupier lending can be done at less than a 20% deposit).
various points in 2014, 2015, and 2016. A significant amount of
Finally, for movers, a market share of 28% so far in Q2 2021 is
this upturn was driven by ‘Mum and Dad’ investors – perhaps
down a bit on past norms (i.e. closer to 30%), but reflects in
just buying their first or second rental property – who saw the
many cases the tight supply of listings – movers can’t find their
returns on alternative assets (e.g. term deposits) dwindle away
ideal next purchase, so they’re choosing to stay where they are,
to very little.
and often renovate instead.
More generally, the growth in mortgaged investors’ market
share last year was a key factor behind the property politics that
ramped up quickly, and also why the Government felt they had
24 Source: Statistics New ZealandMain Cities Housing Market Indicators 25 © 2021 CoreLogic, Inc. All Rights Reserved.
Auckland Market Activity

Buyer Classification –                                               Buyer Classification –
Auckland (% of purchases)                                            Northland region (% of purchases)

The Buyer Classification trends within Auckland have been            Meanwhile, although there’s been a bit of volatility in the first
similar to NZ as a whole lately – mortgaged investors were very      home buyer data for Auckland lately, the general trend over the
active in the first quarter of the year (and first home buyers’      past year or so has been for them to find it harder to retain
market share had dipped), but there are now signs of a turning       market share – that’s not surprising, given the high (and rising)
point as regulatory pressures kick in.                               property values in Auckland and hence the larger deposit that is
                                                                     required than in other parts of the country. However, after
After a figure of 26% in Q2 last year, mortgaged multiple
                                                                     dipping to 24% in Q1 2021, there are signs of a turnaround for
property owners (MPOs or investors) raised their share of
                                                                     FHBs, with the figure for Q2 rising to 26%.
purchases in Auckland to 31% by Q1 2021 – that was the highest
for several years, but not quite a record (33% over 2015-16).        As is the case elsewhere in NZ, movers are also relatively quiet in
However, for Q2, that figure has already dipped to 28%, and is       Auckland, with a 25% share of purchases in Q2, down from more
likely to continue to fall as the 40% deposit requirement            typical levels of 28-30% in the past. That’s consistent with the
continues to bite, and the taper/removal of interest                 low level of listings, and the fact that many would-be movers are
deductibility also changes the economics of property investing       finding it hard to locate their ideal next property.
for more people.

It’s also important to note that the rapid rise in property values
has pushed down yields in Auckland, so that will have made the
sums more difficult for some would-be property investors too.

26   © 2021 CoreLogic, Inc. All Rights Reserved.
Auckland Values
Average Value of Housing Stock Annual & Quarterly Value Change
Auckland ($) Auckland (%)
The continued upturn in average property values for Auckland function of their lower starting point, or in other words, within
as a whole has reflected rising markets across each sub-area – in an Auckland context, more favourable affordability than other
other words, the upturn remains broad based. Indeed, over the parts of the city. The cheaper areas tend to be where first home
three months to June, the rise in average values has ranged buyers and higher leveraged investors tend to be more active,
from 8.7% in Franklin (and more than 7% in Waitakere, Rodney, whereas movers are more prominent in expensive areas (where
and Papakura) down to a still-solid 4% or so in Auckland City. a higher amount of equity is required).
North Shore and Manukau are in the 5-6% range. Five of the
However, Manukau, Waitakere, and Rodney aren’t far behind (all
seven main areas of Auckland now have an average value of at
seeing annual gains of more than 20%), and even in the more
least $1m, and both Papakura and Franklin are rapidly
expensive parts of Auckland, i.e. Auckland City and North Shore,
approaching the $900,000 mark.
the rises over the past year have been around the 17% mark.
In fact, over the past year as a whole, it’s those two areas that
have seen the fastest growth – 23.6% for Franklin and 23.0% for
Papakura. The faster increases in those areas are likely to be a
June 2021
Current value 1 month 3 months 12 months 5 years
Rodney $1,196,709 3.1% 7.6% 21.8% 40%
North Shore $1,456,929 1.5% 5.2% 16.8% 28%
Waitakere $1,043,068 2.2% 7.4% 21.6% 35%
Auckland City $1,493,303 0.7% 3.8% 16.9% 30%
Manukau $1,138,531 1.9% 6.2% 21.1% 35%
Papakura $895,839 2.2% 7.7% 23.0% 43%
Franklin $860,258 3.7% 8.7% 23.6% 41%
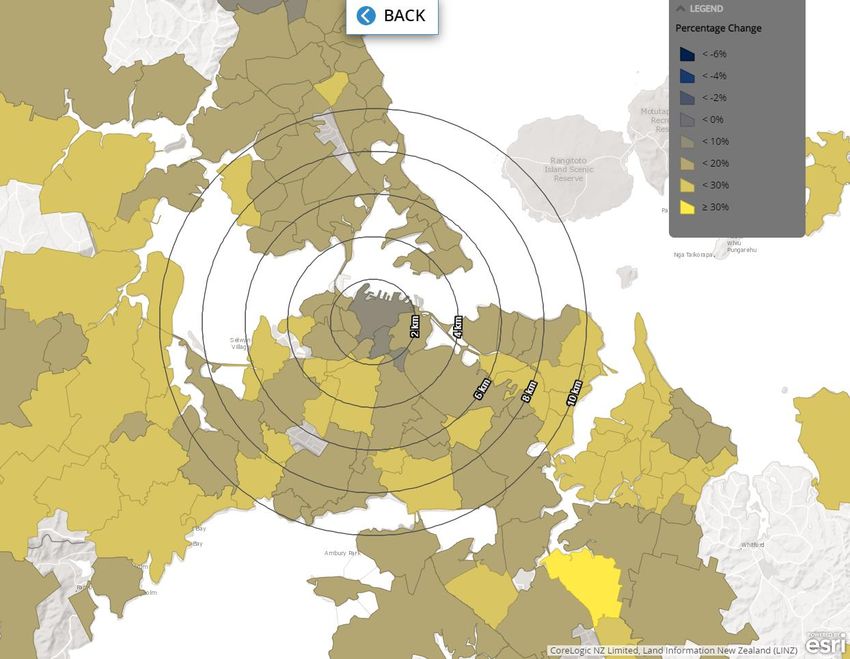
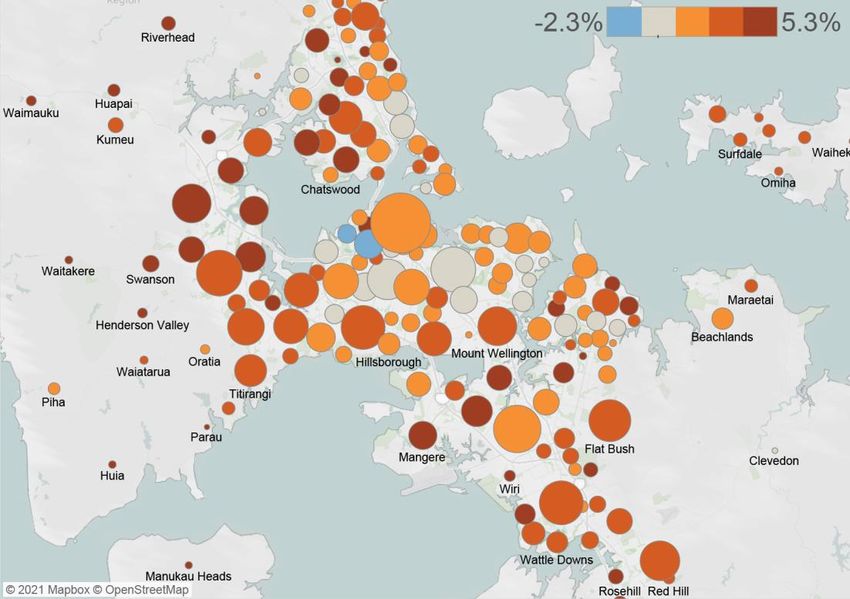
27 © 2021 CoreLogic, Inc. All Rights Reserved.Auckland Suburb Value Change Three-month Value Change (%) Over the shorter three month view, there is some variability starting to show through at the suburb level, with those at the more expensive end of the spectrum (including Grey Lynn -1.7% and Westmere -1.1%) seeing minor decreases over the observed period. 28 © 2021 CoreLogic, Inc. All Rights Reserved.
Current Suburb Values:
‘Mapping the Market’

Auckland suburb median values June 2021 ($)
The upturn in property values over the past 9-12 months has been seen across almost all suburbs, with some
areas seeing very stark increases. CoreLogic’s interactive ‘Mapping the Market’ product shows the changes
over the past 12 months, it’s freely available and updated quarterly. The heatmaps in ‘Mapping the Market’
are point-in-time snapshots of median values from 2020 and 2021, and show the % and $ change over that
period too. See www.corelogic.co.nz/mapping-market.

Auckland is illustrated in the heatmap here. Herne Bay remains the highest priced suburb in Auckland (and
the entire country), with a median property value now of $3.16m. There are 18 suburbs across Auckland with
a median value at least $2m, and 162 with a value at least $1m. All suburbs have seen median values rise
over the past year, ranging from more than 30% in Otara and Manurewa East, down to 3.8% in Auckland
Central. When converted to dollar terms, the largest rise has been in Saint Marys Bay, at $445,450 (and Herne
Bay $438,000), while 197 other suburbs have seen gains over the past year of at least $100,000.

29   © 2021 CoreLogic, Inc. All Rights Reserved.
Hamilton Market Activity

Buyer Classification –                                              Buyer Classification –
Hamilton (% of purchases)                                           Waikato Region (% of purchases)

Hamilton’s Buyer Classification trends have also mirrored the       After a lull in Q1 2021 (22% share of purchases), first home
national picture lately, but mortgaged multiple property owners     buyers found it a little easier in Q2, with a 27% market share –
always tend to have a higher market share than the national         back on a par with typical levels throughout 2019 and 2020. It
average, while the rise up to Q1 2021 for this group was stronger   wouldn’t be a surprise to see FHBs’ share in Hamilton stay at
too.                                                                around those levels or above over the coming years, as the sums
                                                                    start to get harder to justify for mortgaged investors.
Indeed, from a 29% share of Hamilton property purchases in Q2
2020, mortgaged MPOs/investors had raised their figure to 39%       At 24% in Q2 2021, the market share for movers in Hamilton has
by Q1 2021, back to matching the previous peak from Q3 2016.        been relatively low by past standards, but is likely to reflect the
However, for Q2 this year – as the 40% deposit requirements         lack of listings (hence movers can’t find their ideal next
have continued to bite and investment sentiment has just            property) and also the fact that it still costs quite a lot to ‘trade
moderated a bit – their market share has dropped back to 32%.       up’, both in terms of legal/agent costs but also just the extra
That figure is likely to continue to drop, but property won’t be    equity & debt required to make that move.
abandoned altogether – after all, the alternatives for investment
(such as term deposits) aren’t likely to suddenly become
irresistible again, and while mortgage rates are set to rise over
the medium term, they’re likely to stay low by past standards
(and only rise slowly).

30   © 2021 CoreLogic, Inc. All Rights Reserved.
Hamilton Values
Average Value of Housing Stock Annual & Quarterly Value Change
Hamilton ($) Hamilton (%)
Hamilton’s average property values rose by another 1.9% in Over the past three months, the strongest gains within Hamilton
June, taking the rise since March to 10.0% and since December have been in Central & North West (11.4% rise), while the South
to 18.9% - the annual change sits at 27.7%. It’s also noteworthy West has lagged a little, but still seen a robust increase of 8.0%.
that the level for average values in Hamilton went above the On an annual basis, the rises across Hamilton have been pretty
$800,000 mark for the first time in June ($801,919). uniform (and strong) – ranging from 29.3% in Central & North
West, down to 26.4% in South East.
June 2021
Current value 1 month 3 months 12 months 5 years
Hamilton Central & North West $759,808 3.4% 11.4% 29.3% 68%
Hamilton North East $979,940 2.4% 9.9% 27.7% 56%
Hamilton South East $742,335 1.6% 10.1% 26.4% 65%
Hamilton South West $712,809 0.5% 8.0% 26.8% 64%
31 © 2021 CoreLogic, Inc. All Rights Reserved.Tauranga Market Activity Buyer Classification – Buyer Classification – Tauranga (% of purchases) Bay of Plenty Region (% of purchases) Over the second quarter, movers remained the key buyer group Meanwhile, first home buyers’ market share was also relatively in Tauranga, accounting for 32% of purchases. The high market stable in Tauranga at 19% in Q2 2021, still broadly in line with share for movers contrasts with all of the other main centres, past norms. However, reflecting the regulatory changes lately and potentially illustrates how a solid base of equity/wealth is (i.e. 40% deposits and also the tax changes at the end of March), important in Tauranga, rather than necessarily local wages mortgaged investors’ market share fell sharply in Q2 2021, and being a key driver for a property purchase. on the flipside the presence for cash investors increased. 32 © 2021 CoreLogic, Inc. All Rights Reserved.
Tauranga Values

Average Value of Housing Stock                                       Annual & Quarterly Value Change
Tauranga ($)                                                         Tauranga (%)

Tauranga’s average property values stagnated a little in the first
quarter of 2021, but have resumed an upwards trend since then
– rising by 1.0% in June, 9.0% over April-June, and by 23.2%
over a 12 month horizon. The level is now $978,067, and it
seems likely that they’ll go above $1m fairly soon (to join
Auckland, Wellington, Queenstown, and Thames-Coromandel).

33   © 2021 CoreLogic, Inc. All Rights Reserved.
Wellington Market Activity

Buyer Classification –                                                Buyer Classification –
Wellington Area (% of purchases)                                      Lower Hutt (% of purchases)

Across the four main territorial authorities in Wellington (City,     Meanwhile, mortgaged investors’ market share eased a little,
Lower Hutt, Upper Hutt, Porirua), first home buyers have              from 31% in Q1 2021 to 29% in Q2. Consistent with the tighter
emerged again as the largest buyer group in Q2 2021, after an         rules for investors that are now in effect, we suspect that the
easing off for mortgaged investors.                                   market share for this buyer group around wider Wellington will
                                                                      continue to decline in the coming quarters.
Indeed, FHBs’ share of purchases rose from 28% in Q1 2021 to
33% in Q2, returning to past peaks seen at various points in          At a more detailed level, Porirua and Wellington City both
2018, 2019, and 2020. Access to KiwiSaver for the deposit, as         broadly saw mortgaged investors hold their ground in Q2 2021,
well as a willingness to compromise on location and/or property       but at the same time FHBs started to recover a bit too. However,
type, and also making use of the LVR speed limits are all likely to   the more meaningful shifts in terms of mortgaged investors
have been factors supporting FHB activity in Q2.                      easing back and FHBs gaining more market share in Q2 2021
                                                                      came in Upper Hutt and Lower Hutt – the latter saw FHBs share
                                                                      rise from 30% in Q1 2021 to 36% in Q2.

34   © 2021 CoreLogic, Inc. All Rights Reserved.
Wellington Values
Average Value of Housing Stock Annual & Quarterly Value Change
Wellington ($) Wellington (%)
The wider Wellington area has seen strong growth in property The annual growth figures are even more striking. Carterton
values over the past 9-12 months (and prior to COVID too), with (41.9%), South Wairarapa, and Masterton are all around the 40%
Lower Hutt (11.1%), South Wairarapa (10.8%), Kapiti Coast mark for increases in average property values over the past 12
(10.6%), and Carterton (10.2%) all experiencing double-digit months, with most other parts of the wider Wellington area
rises since March this year alone. Even Porirua’s rise of 7.6%, above 30%. Wellington City is ‘last’ at 28.9%, but that is clearly
while less than those other areas, is hardly trivial. still a very strong result in its own right, and the rise has pushed
average values now to more than $1.1m.
June 2021
Current value 1 month 3 months 12 months 5 years
Porirua $915,018 2.0% 7.6% 32.4% 116%
Upper Hutt $856,857 1.5% 8.6% 34.0% 134%
Lower Hutt $914,549 2.6% 11.1% 33.3% 121%
Wellington City $1,144,381 2.3% 9.3% 28.9% 83%
Carterton $677,162 0.4% 10.2% 41.9% 141%
Masterton $610,356 2.7% 8.7% 38.7% 148%
South Wairarapa $813,518 3.6% 10.8% 40.5% 148%
Kapiti Coast $912,784 1.3% 10.6% 36.3% 116%
35 © 2021 CoreLogic, Inc. All Rights Reserved.Christchurch Market Activity
Buyer Classification – Buyer Classification –
Christchurch (% of purchases) Canterbury (% of purchases)
Christchurch is seeing similar Buyer Classification trends to the Meanwhile, mortgaged investors saw their market share in
other main centres around NZ, with mortgaged investors now Christchurch drop from 27% in Q1 2021 to 25% in Q2 – still a
on the start of a downwards trend and first home buyers’ relatively high figure, but probably marking the start of a
market share having picked up again (but also with movers downwards trend, as the tighter regulatory environment takes
relatively quiet). hold. That said, it wouldn’t be a surprise if mortgaged investors’
presence stays higher in Christchurch than elsewhere, as yields
However, it’s also important to note that FHBs have tended to
are more attractive and longer-term there could still be a bit
have a higher market share in Christchurch than other parts of
more scope for property values to rise faster (given they’re
the country for some time now. In other words, the rebound to
starting from a lower base).
28% in Q2 2021 came from an already-solid 26% in Q1 – that
higher starting point no doubt reflects the more favourable
affordability position in Christchurch, after a number of years of
relatively stable property values.
36 © 2021 CoreLogic, Inc. All Rights Reserved.Greater Christchurch Values
Average Value of Housing Stock Annual & Quarterly Value Change
Christchurch ($) Christchurch (%)
The wider Christchurch market has been part of the national On an annual basis, Banks Peninsula has seen average values
upswing in property values in recent months, with areas like rise by 25.3%, just ahead of Christchurch East at 24.3% (and the
Waimakariri and some of the Christchurch sub-markets (e.g. national average of 22.8%). All other parts of Christchurch are
East, and Hills) seeing growth of more than 3% in June alone. above the 20% growth mark over the past 12 months, as is
Over the past quarter, Christchurch East has seen average Waimakariri – and Selwyn at 19.3% isn’t far behind.
values rise by almost 11%, while even the ‘lagging’ Selwyn
Anecdotally, the supply of new development land coming on
District has still seen an increase of nearly 8% just in the past
stream around Greater Christchurch isn’t as plentiful as in the
three months.
past, so it’ll be interesting to watch this market’s
supply/demand balance over the medium term.
June 2021
Current value 1 month 3 months 12 months 5 years
Banks Peninsula $675,396 2.6% 10.8% 25.3% 31%
Christchurch Central & North $729,213 3.0% 8.8% 20.1% 26%
Christchurch East $488,773 3.5% 10.8% 24.3% 31%
Christchurch Hills $865,596 3.5% 9.8% 22.0% 30%
Christchurch Southwest $599,295 2.3% 9.6% 21.8% 29%
Selwyn $677,260 1.3% 7.8% 19.3% 27%
Waimakariri $566,866 3.2% 9.1% 21.7% 33%
37 © 2021 CoreLogic, Inc. All Rights Reserved.Dunedin Market Activity
Buyer Classification – Buyer Classification –
Dunedin (% of purchases) Otago (% of purchases)
Across Dunedin, first home buyers held their ground in Q2 2021, Meanwhile, existing owner-occupiers who chose to relocate (i.e.
with their market share of purchases remaining broadly steady ‘movers’) raised their market share from 27% in Q1 to 29% in
at 24%. That’s roughly in line with past norms, although down Q2, the highest level for about three years. Listings across
from previous peaks (e.g. 28% in late 2018 and into early 2019). Dunedin are still low, but there were signs of a loosening in
recent months, which may have created opportunities for more
The bigger shifts in Dunedin in Q2 2021 were for mortgaged
movers to shift house.
investors and movers. Indeed, after a peak of 29% in Q1 2021,
mortgaged investors’ market share faded back to 24% in Q2, no
doubt reflecting tougher deposit requirements and tax changes
from the Government.
38 © 2021 CoreLogic, Inc. All Rights Reserved.You can also read