IDFC US Equity Fund of Fund - Benefit from Strong Structural Opportunities in a Resilient US Market - NET

Page created by Joseph Schneider
 
CONTINUE READING
IDFC US Equity Fund of Fund - Benefit from Strong Structural Opportunities in a Resilient US Market - NET
IDFC US Equity Fund of Fund
Benefit from Strong
Structural Opportunities in
a Resilient US Market
IDFC US Equity Fund of Fund - Benefit from Strong Structural Opportunities in a Resilient US Market - NET
1. Why Invest in US Equities?

?           2. Why Invest in US Equities Now?

    3. Why IDFC US Equity Fund of Fund?
IDFC US Equity Fund of Fund - Benefit from Strong Structural Opportunities in a Resilient US Market - NET
Participation only in Indian assets has historically limited the Indian investor’s portfolio
Investing in global markets offers a powerful opportunity for improved diversification

                          Traditional
                        Diversification                                              Suggested
                       Strategies in the                                             Additional
                       Home Country /                                              Diversification
                       Domestic Market

         Asset Class                    Within Asset Class                        Geographical

   Split between Equity,               Split basis company
                                                                               Split across different
       Fixed Income,                        size, sector,
                                                                               markets in the world
     Commodities, etc                 creditworthiness, etc

                                                        3
IDFC US Equity Fund of Fund - Benefit from Strong Structural Opportunities in a Resilient US Market - NET
Low Correlation between India and US equity markets
                Combining investments with low correlation improves portfolio efficiency and diversification

   Rolling 1-year returns

80%

60%

40%

20%

 0%
       Dec-11

                                           Dec-12

                                                                               Dec-13

                                                                                                                   Dec-14

                                                                                                                                                       Dec-15

                                                                                                                                                                                           Dec-16

                                                                                                                                                                                                                               Dec-17

                                                                                                                                                                                                                                                                   Dec-18

                                                                                                                                                                                                                                                                                                       Dec-19

                                                                                                                                                                                                                                                                                                                                           Dec-20

                                                                                                                                                                                                                                                                                                                                                                               Dec-21
                         Jun-12

                                                             Jun-13

                                                                                                 Jun-14

                                                                                                                                     Jun-15

                                                                                                                                                                         Jun-16

                                                                                                                                                                                                             Jun-17

                                                                                                                                                                                                                                                 Jun-18

                                                                                                                                                                                                                                                                                     Jun-19

                                                                                                                                                                                                                                                                                                                         Jun-20

                                                                                                                                                                                                                                                                                                                                                             Jun-21
                                                                                                          Sep-14

                                                                                                                                                                                                                                                                                                                                                                      Sep-21
                Mar-12

                                  Sep-12

                                                    Mar-13

                                                                      Sep-13

                                                                                        Mar-14

                                                                                                                            Mar-15

                                                                                                                                              Sep-15

                                                                                                                                                                Mar-16

                                                                                                                                                                                  Sep-16

                                                                                                                                                                                                    Mar-17

                                                                                                                                                                                                                      Sep-17

                                                                                                                                                                                                                                        Mar-18

                                                                                                                                                                                                                                                          Sep-18

                                                                                                                                                                                                                                                                            Mar-19

                                                                                                                                                                                                                                                                                              Sep-19

                                                                                                                                                                                                                                                                                                                Mar-20

                                                                                                                                                                                                                                                                                                                                  Sep-20

                                                                                                                                                                                                                                                                                                                                                    Mar-21
-20%

-40%

                                                                                                                        US equity market                                                            India equity market

          Russell 1000 Growth index considered as investment in US markets and Nifty 50 as investment in India. Both the indices have been rebased to INR 10,000 on Dec 2011 to arrive at the above rolling returns.
          Source: Russell website, investing.com, internal analysis
          Data as on 31st Dec 2021
          Past performance is not an indicator of future performance
                                                                                                                                                                                                4
IDFC US Equity Fund of Fund - Benefit from Strong Structural Opportunities in a Resilient US Market - NET
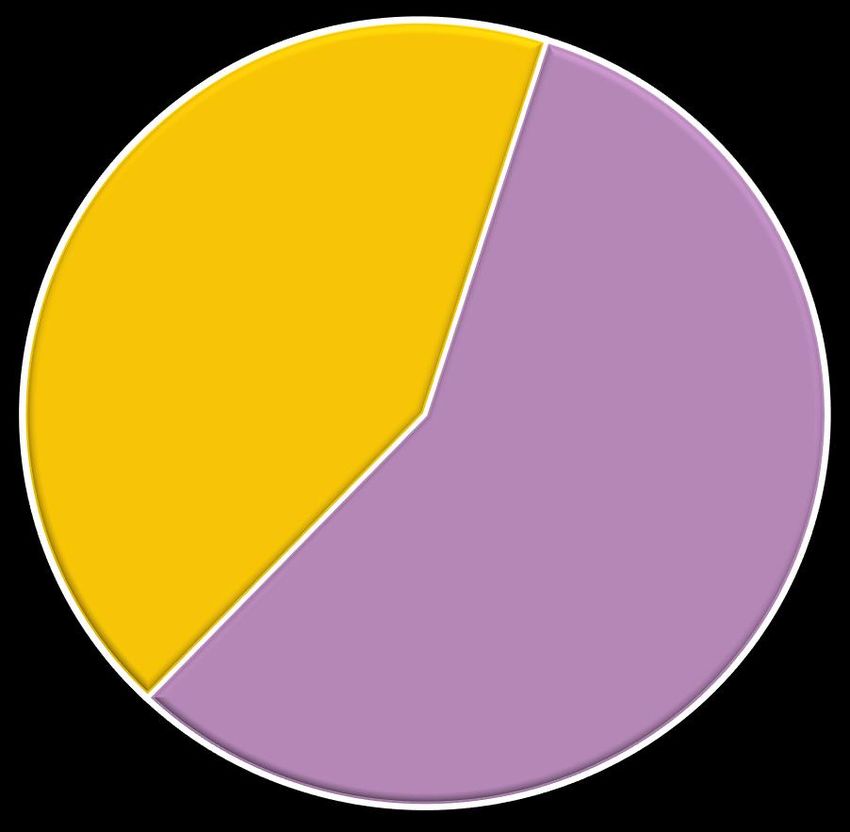
A combined India + US Portfolio can be considered more efficient
                       An (illustrative) 80% India & 20% US Portfolio has a far better return and risk characteristic than a pure Indian equity portfolio

Value of INR 10,000 invested in the US market, India
Market and a combined portfolio
                                                                                                                                                                                             20% US +
                                                                                                                                                                 %^          US*    India*
                                                                                                                                                                                             80% India
40,000
                                                                                                                                                 34,813
                                                                                                                                                              5 year
30,000                                                                                                                                                                       28.3    16.2    18.9
                                                                                                                                                   23,789     INR return
20,000
                                                                                                                                        21,198                Standard
10,000                                                                                                                                                                       16.5    18.6    16.5
                                                                                                                                                              Deviation
    -
                                                                                                                                                              Return per
          Dec-16

                                     Dec-17

                                                                Dec-18

                                                                                           Dec-19

                                                                                                                      Dec-20

                                                                                                                                                 Dec-21
                                                                         Apr-19

                                                                                                                               Apr-21
                            Aug-17
                   Apr-17

                                              Apr-18

                                                                                                    Apr-20
                                                       Aug-18

                                                                                  Aug-19

                                                                                                             Aug-20

                                                                                                                                        Aug-21
                                                                                                                                                                             1.72    0.87    1.15
                                                                                                                                                              unit of risk
         US equity market                                India equity market                                   20% US + 80% India

         Source: Russell website, investing.com, internal analysis, the indices have been rebased to INR 10,000 on Dec 2016
         Data as on 31st Dec 2021
         *Russell 1000 Growth Index considered for US market returns and Nifty 50 considered for India market returns
         ^5-year return, standard deviation and risk per unit of risk as on 31st Dec 2021
         Past performance is not an indicator of future performance

                                                                                                                                                          5
IDFC US Equity Fund of Fund - Benefit from Strong Structural Opportunities in a Resilient US Market - NET
Purely India focused assets participate in just ~3% of Global GDP
Investing in the US offers a substantial opportunity to benefit from global GDP growth

                                                    GDP
                                                                               US contributes the highest
                                                                    US, 25%    i.e. about 1/4th of Global
                                                                               GDP

                        Rest of the
                        world, 44%

                                                                       China, 17%

                                                                  Japan, 6%
                                        India, 3%
                                                    Germany, 5%

 Source : World Bank. Data as on 2020

                                                             6
IDFC US Equity Fund of Fund - Benefit from Strong Structural Opportunities in a Resilient US Market - NET
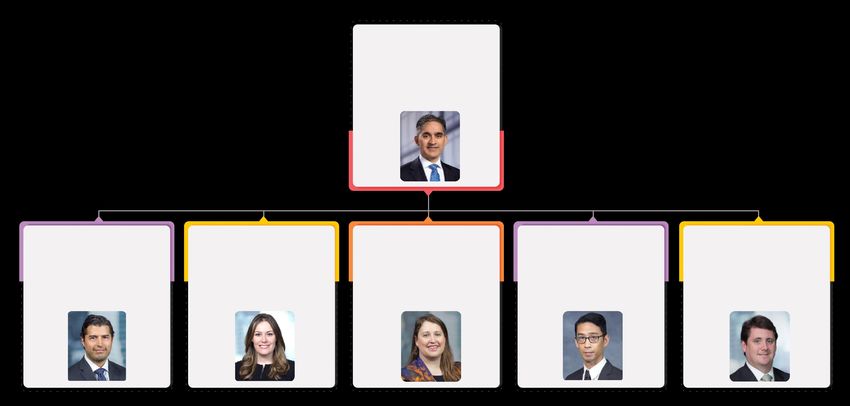
US Companies are a good mix of US and Global Revenues
Over 40% of Revenues in a portfolio of US Equities* can come from Non-US revenue pools

                                                  Global Revenue split of US companies*

                                                                 41%
                                                                Non -
                                                              US Market
                                                                                              59%
                                                                                           US Market

 *includes companies invested in by the underlying fund of IDFC US Equity FoF. Data as on 31st Mar’21; Source: Factset

                                                                                                 7
IDFC US Equity Fund of Fund - Benefit from Strong Structural Opportunities in a Resilient US Market - NET
US has been the most consistent equity market with low volatility over the last decade
          In addition to the high return, it has also displayed the low risk (volatility)

              In a negative/low return environment Globally, US                                                                          In a Global rally, US has rewarded well;
              has shown resilience and performed better than                                                                             e.g. 2012, 2017
              other geographies; e.g. 2008, 2013, 2016, 2018, 2021
                                                                                                                                                                                     Annual           Risk
                                                                                                                                                                      2021           Return        (Volatility)
                    2008             2012         2013          2014          2015            2016          2017          2018         2019            2020

                   Japan           India          U.S.  China A     Japan  Taiwan      China     U.S.  Taiwan      Korea         U.S.     U.S.  China A
                  -29.1%          26.0%         32.4%    52.1%       9.9%   19.6%      54.3%   -4.4%    37.7%      45.2%      28.7%     16.6%    23.8%
                     U.S.          China        Japan      India  China A      U.S.    Korea    India  China A    Taiwan     Taiwan    Taiwan     India
                    -37%          23.1%         27.3%    23.9%       2.4%   12.0%      47.8%   -7.3%    37.2%      42.0%      26.8%     16.0%    21.4%
                  Taiwan          ASEAN        Europe       U.S.      U.S.   Korea      India Taiwan     U.S.     China A       India    India   China
                  -45.9%          22.8%         26.0%    13.7%       1.4%     9.2%     38.8%    8.2%    31.5%      38.4%      26.7%     10.9%    19.6%
                  Europe         APAC ex-      Taiwan   Taiwan     Europe APAC ex-JP APAC ex- ASEAN    Europe      China     Europe    China A   Korea
                  -46.1%         JP 22.6%        9.8%    10.1%      -2.3%     7.1%   JP 37.3%  -8.4%    24.6%      29.7%      17.0%      9.9%    19.3%
                  ASEAN           Korea         Korea     China      India  ASEAN     China A  Japan    China    APAC ex-JP    Japan   Europe   Taiwan
                  -47.6%          21.5%          4.2%      8.3%     -6.1%     6.2%     32.6%  -12.6%    23.7%      22.8%        2.0%     8.8%    16.4%
                   China         Europe         China    ASEAN      Korea    Japan    ASEAN APAC ex-JP Japan         U.S.     ASEAN     Japan    ASEAN
                  -50.8%          19.9%          4.0%      6.4%     -6.3%     2.7%     30.1%  -13.7%    20.1%      18.4%        0.2%     8.7%    15.5%
                APAC ex-JP       Taiwan       APAC ex- APAC ex-JP China      China    Taiwan  Europe APAC ex-JP     India    China A APAC ex-JP Europe
                  -51.6%          17.7%        JP 3.7%     3.1%     -7.6%     1.1%     28.5%  -14.3%    19.5%      15.9%       -1.0%     8.0%    15.5%
                   Korea           U.S.       China A     Japan  APAC ex-  Europe     Europe   China    Korea      Japan    APAC ex-JP  Korea  APAC ex-JP
                  -55.1%          16.0%         -2.6%     -3.7%   JP -9.1%    0.2%     26.2%  -18.7%    13.1%      14.9%       -2.7%     7.5%    15.4%
                 China A         China A         India  Europe     Taiwan     India    Japan   Korea   ASEAN                   Korea    China    Japan
                                                                                                                Europe 5.9%
                  -63.2%          10.9%         -3.8%     -5.7%    -11.0%    -1.4%     24.4%  -20.5%     8.8%                  -7.9%     7.4%    13.1%
                   India          Japan        ASEAN      Korea    ASEAN   China A       U.S. China A   India      ASEAN       China   ASEAN       US
                  -64.6%           8.4%         -4.5%    -10.7%    -18.4%   -15.2%     21.8%  -27.6%     7.6%      -6.2%      -21.6%     2.8%    13.0%
Source: Factset, MSCI, Standard & Poor’s, Guide to the markets by J.P. Morgan Asset Management; Data as on 31st Dec 2021.
Returns are total returns in U.S. Dollars based on MSCI indices, except the U.S., which is the S&P 500, China A, which is the CSI 300 index in the USD terms. China return is based on the MSCI China index. 10-
yr total (gross) return data is used to calculate annualized returns and annualized volatility and reflect the period 31/12/11 - 31/12/21. Past performance is not an indicator of future performance.
                                                                                                              8
IDFC US Equity Fund of Fund - Benefit from Strong Structural Opportunities in a Resilient US Market - NET
US Equity Performance has been driven by higher Earnings growth Vs Rest-of-the-world
               Positive earnings growth in the US witnessed Vs negative for the rest of the world

       12 Months trailing earnings per share                                                                           15 Year Annualized Performance

                    Russell 1000 Value                  Russell 1000 Growth                                             14.0%
                                                                                                                                        12.5%
                    MSCI ACWI ex USA Index              S&P 500 Index
                                                                                                                        12.0%
       3.00
                                                                                                                                                            9.90%
                                                                                                                        10.0%
       2.50
                                                                                                                          8.0%                                                  7.3%
       2.00
                                                                                                                          6.0%                                                                5.40%
       1.50
                                                                                                                          4.0%
       1.00
                                                                                                                          2.0%
       0.50

                                                                                                                          0.0%
       0.00                                                                                                                         Russell 1000       S&P 500 Index        Russell 1000   MSCI ACWI ex-
              '05     '07    '08     '10     '11     '13    '14     '16     '17     '19    '20                                      Growth Index                            Value Index     USA Index

Source: IDFC internal analysis, Bloomberg, Guide to the markets by J.P. Morgan Asset Management. As of 31 December 2020. Past performance is not an indicator of future performance

                                                                                                                9
IDFC US Equity Fund of Fund - Benefit from Strong Structural Opportunities in a Resilient US Market - NET
Exposure to USD currency addresses the need for a USD asset for future USD expenses
             The underlying investments being in USD, Indian investors will also gain if the USD rises over time Vs the INR

Illustration of additional returns through INR depreciation on an investment of INR 10,000

30,000
                                                                                                                                                                                        INR 2,056 earned
                                                                                                                                                                                        more due to fall in
25,000                                                                                                                                                                                  INR value vs USD

20,000                                                                                                                                                                                  INR 14,046 earned
                                                                                                                                                                                        through investment
15,000                                                                                                                                                                                  in US market
10,000

 5,000
                                        Jun-19
                                                 Aug-19

                                                                                              Jun-20

                                                                                                                                                    Jun-21
                                                                                                                                                             Aug-21
                                                                                                       Aug-20
                               Apr-19

                                                                                     Apr-20

                                                                                                                                           Apr-21
             Dec-18

                                                                                                                         Dec-20
                                                          Oct-19
                                                                   Dec-19

                                                                                                                                                                      Oct-21
                      Feb-19

                                                                            Feb-20

                                                                                                                Oct-20

                                                                                                                                                                               Dec-21
                                                                                                                                  Feb-21
                               US Market Investment INR                                           US Market Investment USD

  Russell 1000 Growth index considered as investment in US markets; the index has been rebased to INR 10,000 on Dec 2018.
  Source: Russell website, investing.com, internal analysis
  Data as on 31st Dec’21
  Past performance is not an indicator of future performance
                                                                                                                                     10
In Summary, 5 key reasons why US Equities are a powerful complementary addition for the Indian
                 investor’s portfolio

                                                  2. Access a                                            4. Earnings
      1. Effective                                                             3. Consistent                                    5. Creation of
                                                  large Global                                              Driven
      Diversification                                                          Performance                                      a USD asset
                                                  Revenue Pool

Low correlation with                    Not just the largest             Among major blocks,        Higher US Equity         Add currency
Indian Equities helps                      economy, US                   the US has provided      market performance       exposure to your
 US Equities provide                       Equities offer               attractive returns with   may be attributed to     portfolio to meet
     attractive                          participation in a                low risk – a great     its superior earnings     future expenses
   diversification                       significant global                 combination of               growth           and/or for potential
      benefits                             revenue pool                 reward with resilience                            gains from currency
                                                                                                                               movement

           Past performance is not an indicator of future performance

                                                                                        11
1. Why Invest in US Equities?

?           2. Why Invest in US Equities Now?

    3. Why IDFC US Equity Fund of Fund?
US Markets : Some of the dilemmas

         Isn’t the pandemic                             What can drive
           going to hurt US                              US earnings
               growth?                                    growth?

   Aren’t US market
   valuations already                                         Aren’t we too late
       too high?                                                to enter now?

                              Is the end of this bull
                                 market nearing?

                                               13
US market: Is it expensive?
           Valuation Premium of non-Top 10 stocks more reasonable, which contribute significantly to overall Earnings

 P/E ratio of the top 10 and remaining                                                                         Market Cap and Earnings Contribution of the
 stocks in the S&P 500                                                                                         top 10 in S&P 500
Next 12 months                              Current          Average         % of avg.                                   Weight of the top 10 stocks in the S&P 500
                       Top 10                 33.2x           19.8x            168%                                      % of market capitalization of the S&P 500

                       Remaining
                                              19.7x           15.7x            126%
                       stocks
                       S&P 500                21.2x           16.4x            129%

                                                                                                                         Earnings contribution of the top 10 in the S&P 500
                                                                                                                         Based on last 12 months’ earnings

Source: Factset, Standard & Poor’s, J.P. Morgan Asset Management. The top 10 S&P 500 companies are based on the 10 largest index constituents at the beginning of each month. The weight of each of
these companies is revised monthly. As of 1st Dec 2021, the top 10 companies in the index were Apple (6.8%), Microsoft (6.5%), Amazon (3.9%), Tesla (2.3%), Alphabet Class A (2.2%), Alphabet Class C
(2.1%), Nvidia (2.1%), Facebook (1.9%), Berkshire Hathaway Class B (1.3%), JPMorgan Chase (1.2%), and Johnson & Johnson (1.2%).The remaining stocks represent the rest of the 494 companies in the S&P
500. Guide to the Markets – U.S. Data as on 31st December 2021; P/E – Price to Earnings Ratio. Past performance is not an indicator of future performance.
                                                                                                          14
Is the bull market over?
            Past Bull market phases have lasted longer

S&P 500 bull market gains

     • If the bull market ended today, it would be the shortest and the weakest bull market since the 1960s
     • Low policy rates and spending helping

   Source: FactSet, Standard & Poor’s, Guide to the markets Asia by J.P. Morgan Asset Management as on 31 st Dec’21. A bull market represents a 20% increase from a market trough. Charts and labels refer to
   price return. Past performance is not a reliable indicator of current and future results. Provided for information only to illustrate general market trends not to be construed as research or investment advice.
   Investments involve risks and are not similar or comparable to deposits. Not all investment ideas referenced are suitable for all investors. Provided for information only, not to be construed as investment
   advice.

                                                                                                                  15
Invest for the long-term – Timing doesn't matter
        Investing when the market has touched a new high can provide reasonable returns too

   Average cumulative S&P 500 total returns (Jan 1988 – Mar 2021)

             90%
                                                                                                                                                                           79.2%
             80%
                                                                                                                                                           72.1%
             70%

             60%
                                                                                                                49.9%
             50%
                                                                                                39.3%
             40%

             30%

             20%                                      15.0%
                                     11.9%
             10%

              0%
                                              1 year                                                    3 years                                                    5 years
                                                                           Invest on any day                  Invest at a new high

Source: FactSet, Guide to the markets by J.P. Morgan Asset Management, IDFC internal Analysis, investing.com; Data are as of 31st March 2021. Provided for information only to illustrate general market
trends not to be construed as research or investment advice. Investments involve risks and are not similar or comparable to deposits. Not all investment ideas referenced are suitable for all investors. Past
performance is not an indicator of future performance.
                                                                                                              16
US : A strong consumption-driven economy

                                     24                                   4.7% Housing
                                     22
                                                               13.0% Investment ex-housing
3Q21 nominal GDP, USD (trillions)

                                     20

                                     18                          17.6% Government spending
      Components of GDP

                                     16
                                                                                                                                                            •     Consumption is the most
                                                                                                                                                                  prominent driver of the US
                                     14                                                                                                                           economy.
                                     12

                                     10                                                                                                                    •     Strength of its economy is
                                                                                                                                                                 dependent on the strength
                                      8                                  68.8% Consumption                                                                       of its consumers.
                                      6

                                      4

                                      2

                                     -2
                                                                              --4.1%      Net exports

                       Source: BEA, FactSet, J.P. Morgan Asset Management Guide to the Markets – Asia as on 31st Dec’21; Values may not sum to 100% due to rounding.

                                                                                                                           17
Aggressive Vaccination rollout and sharply falling Covid cases in the US have led to expectations of
                  quicker normalization

    Change in confirmed cases and fatalities in the U.S.                                                                    Progress toward immunity
    (7-day moving average)                                                                                                  Percentage of population, end of month

                                   Confirmed Cases                     Fatalities

Source: Centers for Disease Control and Prevention, Johns Hopkins CSSE, Our World in Data, J.P. Morgan Asset Management. *Share of the total population that has received at least one vaccine dose. **Est. Infected
represents the number of people who may have been infected by COVID-19 by using the CDC’s estimate that 1 in 4.2 COVID-19 infections were reported. ***Est. Infected & vaccinated reflects those that have been both
infected and vaccinated, assuming those infected equally likely to be vaccinated as those not infected. Guide to the Markets –U.S. Data are as of 31st Dec’21.

                                                                                                                   18
Low household debt + Historically high net worth = Expected to unleash pent-up consumption demand

Household Debt at a historic low                             +         Household Net Worth at a historic high

 Household debt service ratio                                                                                  Household net worth
 Debt payments as % of disposable personal income, SA                                                          Not seasonally adjusted, USD (billions)

                                                                                                                                                                   4Q21**:
                                                           4Q07: 13.2%                                                                                             $150,788

    1Q80:
                                                                                                                                                   3Q07: $70,730
    10.6%
                                                                                           4Q21**:
                                                                                           9.0%

   Source: BEA; JP Morgan Guide to the Markets – US
   Data includes households and non-profit organisations.
   **4Q21 figures for debt service ratio and household net worth are J.P. Morgan Asset Management estimates. Data are as of 31 st Dec 2021.
                                                                                                                 19
Expectations of strong recovery in economic activity and earnings

Pent-up demand expected to drive GDP growth in the second half of 2021, with GDP
growth expected to be the highest in almost 40 years

Earnings per share for S&P 500
                                                                                                                                Earnings Growth1                                             2021E

                                                                                                                                Consumer                                                       55%

                                                                                                                                Finance                                                        47%

                                                                                                                                Health care                                                    20%

                                                                                                                                Industrials/Commodities                                        94%

                                                                                                                                Technology                                                     36%

                                                                                                                                Utilities/Telecoms                                              6%

                                                                                                                                S&P 500                                                        43%

  Source: JP Morgan Asset Management; estimates as of 30th Sep 2021. 1. Shows earnings estimates for super sectors. Opinions, estimates, forecasts, projections and statements of financial market trends
  that are based on current market conditions constitute the judgement of JP Morgan Asset Management and are subject to change without notice.

                                                                                                                 20
The US remains at the centre-stage of new-age innovations

       Energy ENERGY                                                                                                   INDUSTRIALS / AUTOS
  Solar & Wind Energy                                                                                                  Electric Vehicles

                                                                                                                                                                               •     Innovations across sectors
                                                                                                                                                                                     expected to advance the
                                                                                                                                                                                     economy further
        MEDIA
Connected TV &                                                       US                                                          FINANCIALS
                                                                                                                                 Payments                                      •     Many of these i innovative
     Streaming                                                                                                                                                                       themes may not be directly
                                                                                                                                                                                     available in India

         CONSUMER                                                                                                    HEALTHCARE
    Home Automation                                                                                                  Medical Technology
                                                                                                                     Use of data / AI

      Source: J.P. Morgan Asset Management. As of 31st March 2021. Opinions, estimates, forecasts, projections and statements of financial market trends are based on market conditions at the date of the publication,
      constitute our judgment and are subject to change without notice. There can be no guarantee they will be met. Provided for information only to illustrate general market trends not to be construed as research or
      investment advice. Investments involve risks and are not similar or comparable to deposits. Not all investment ideas referenced are suitable for all investors.

                                                                                                                      21
In Summary, 5 key reasons why US equities continue to be well-poised to deliver growth

     1. Expected                                   2. For the                 3. Highest GDP         4. Reopening
                                                                              growth in ~40          of the US              5. Innovative
     broader market                                long-term                                                                themes
     pick up                                       investor                   years expected         economy

 Lower Valuations                     Irrespective of market              Being essentially a   US to benefit from     Participate in the
  for the Broader                       timing, investing for            consumption-driven     lowering Covid-19    growth of innovative
 market vs top 10                      the long-term offers                economy, US to       cases and reaching   themes that may not
  stocks, thereby                      significant potential^                benefit from         herd immunity       be available in India
    offering the                                                        consumers unleashing                          and are expected to
potential to benefit                                                    their pent-up demand                            advance the US
from growth in the
                                                                             and savings,                              economy further
  Broader market
                                                                          supported by low
                                                                         debt levels and high
                                                                               net worth

          ^Past performance is not an indicator of future performance

                                                                                      22
1. Why Invest in US Equities?

?           2. Why Invest in US Equities Now?

    3. Why IDFC US Equity Fund of Fund?
An overview of the IDFC US Equity Fund of Fund
          An open-ended fund of fund scheme investing in units/shares of overseas Mutual Fund Scheme (/s) / Exchange
          Traded Fund (/s) investing in US Equity securities

        • The underlying fund(/s) will be based on the existing US market view and outlook of the fund manager

        • Currently, the fund will invest in an underlying fund with a Growth-style investing

                                                                           Structure of the Investment

                                                               IDFC US Equity                                         Underlying                        Equity shares
                 Investors                                      Fund of Fund                                            Fund                                of US
                                                                                                                                                         companies

Note: It will not be a dedicated feeder fund structure and the Indian fund is open to invest in funds that meet the investment objective and strategy

                                                                                                                24
Underlying Fund: The J.P. Morgan US Growth Fund
            A carefully chosen fund with a well-tested investment process and well-proven track record

                                                                   Fund Inception Date: 20th Oct’00
                                                                 Share Class inception date: 3rd Oct’13*

          60-90 stock portfolio – Large-cap
        focused with some mid-cap exposure                                                                 USD 2Bn of assets as on Dec’21

                                                                                   J.P. Morgan
                                                                                   US Growth
                                                                                       Fund
                    An experienced lead portfolio                                                      Global exposure: 40% of the revenue
                    manager supported by a team                                                        of the underlying stocks contributed
                    of sector research analysts                                                        by countries outside of US^

                                                 Bottom-up investment approach to identify companies with :
                                                • A large addressable market undergoing meaningful change
                                                • Sustainable competitive advantage and strong execution
                                                • Good price momentum

*Underlying fund is JPMorgan Funds – US Growth Fund; Class: JPM US Growth I (acc) USD
^As on 31st March 2021

                                                                                             25
The Underlying Fund deploys a fundamentals driven, bottom-up process to build a portfolio of high
       conviction companies

         Idea Generation                   Fundamental Analysis              Portfolio Construction

   •   Run proprietary quantitative    •   Determine if a prolonged      •   Bottom-up, fundamental
       screens on Russell 1000             growth opportunity exists
       Growth Index (approx. 800                                         •   Giri Devulapally, lead portfolio
       names)                          •   Assess competitive dynamics       manager, uses the fundamental
                                                                             analysis coupled with his insights to
        ➢ earnings revisions           •   Evaluate the attractiveness       create a portfolio of 60-90 stocks
        ➢ price momentum                   of the business model
        ➢ valuation
                                                                         •   Position sizes determined by
                                       •   Track record of                   conviction level
   •   Narrow investable universe          management’s ability to
                                                                              ➢ quality of business
       to 150-200 companies                execute
                                                                              ➢ risk/reward

   •   Company meetings                •   Potential for margin               ➢ diversification impact on portfolio
                                           expansion
   •   Industry conferences                                              •   Portfolio guidelines:
                                       •   Balance sheet strength             ➢ Sectors at + / - 10% relative to the
                                                                                benchmark
                                                                              ➢ Stocks at + / - 5% relative to the
                                                                                benchmark
Source: J.P. Morgan Asset Management

                                                            26
ESG principles embedded in the research process of the Underlying Fund
               A robust framework to evaluate each company under coverage on ESG dimensions

                                                                                       Environment                   Social                    Governance

 Global Equity Research Team

  • Decades of insight                                                         •    Climate Change        •   Human Capital            •   Corporate Governance
  • Globally consistent                                                        •    Natural Resources     •   Product Liability        •   Corporate Behaviour
  • Systematic approach                                                        •    Pollution and Waste   •   Stakeholder Opposition
                                                                               •    Environmental         •   Social Opportunities
                                                                                    Opportunities
Supported by:
Investment Stewardship Professionals                                               12 questions               12 questions                 16 questions
Over 20 years experience with corporate
engagement and governance oversight

    Source: J.P. Morgan Asset Management. ESG = Environment, Social, and Governance.

                                                                                                  27
The Underlying Fund provides access to unique business models and companies

   Digital Advertising                                               Financials                                                   Technology - Enabled                                               Technology

Merchants spending more                                 Increased conviction in                                           Companies leveraging                                             Largest underweight but
on digital advertising to                               traditional financials while                                      technology to create                                             largest in absolute weight
build mindshare in the                                  owning secular winners in                                         competitive advantages
online world                                            payments                                                          • Select industrials are poised                                  • Semiconductor
• Snap, Alphabet, Meta                                                                                                      to benefit from                                                  companies with
                                                        • High-quality franchises                                           technological innovation
  Platforms                                               that have robust                                                                                                                   sustainable growth
                                                          tailwinds: Charles                                                 Deere, Freeport-McMoRan,                                        drivers
                                                          Schwab, Morgan                                                     Rockwell Automation                                             ASML, Advanced Micro
                                                          Stanley, Blackstone, SVB                                        • Consumer-facing platforms:                                       Devices, Synopsys
                                                          Financial
                                                                                                                             Chipotle, Align Technology,
                                                        • Payments:                                                                                                                        • Underweight stocks that
                                                                                                                             Carvana
                                                          PayPal, Square                                                                                                                     have outperformed
                                                                                                                                                                                             substantially
                                                                                                                                                                                             Apple, Microsoft
     Source: J.P. Morgan Asset Management. The securities highlighted above have been selected based on their significance and are shown for illustrative purposes only. It should not be interpreted as a
     recommendation to buy or sell. It should not be assumed that other securities in the portfolio have performed in a similar manner. The Strategy is an actively managed portfolio, holdings, sector weights,
     allocations and leverage, as applicable are subject to change at the discretion of the Investment Manager without notice.
                                                                                                                       28
Portfolio performance of the Underlying Fund (INR)

Annualised Return

   As on 30th November 2021                                             One Year                            Three Years                            Five Years                  Since inception

   JPM US Growth Fund                                                       27.7%                                 36.9%                                31.1%                             23.5%

   Russell 1000 Growth Index
                                                                            32.3%                                 32.1%                                27.0%                             22.0%
   (Benchmark)

   Excess Return                                                            -4.6%                                  4.8%                                 4.1%                              1.5%

  Source: J.P. Morgan Asset Management and IDFC internal analysis. INR performance has been derived from the USD returns. Fund performance is shown based on the NAV of the share class I in USD with
  income (gross of shareholder tax) reinvested including actual ongoing charges excluding any entry and exit fees. Figures greater than 1 year are annualised. The benchmark figures are net of 30%
  withholding tax. Past performance may or may not be sustained in the future.

                                                                                                           29
Portfolio performance of the Underlying Fund (INR)

Calendar year performance

 As on 30th November 2021 CY’21 YTD                                               CY’20              CY’19              CY’18             CY’17              CY’16              CY’15              CY’14

 JPM US Growth Fund                                         23.5%                 59.4%             42.2%                8.7%             29.3%               0.0%              12.8%             14.9%

 Russell 1000 Growth Index
                                                            28.2%                 41.3%             39.4%                6.9%             21.8%               9.4%              10.5%             14.8%
 (Benchmark)

 Excess Return                                               -4.7%                18.1%               2.9%              1.7%               7.4%              -9.3%               2.3%               0.2%

  Source: J.P. Morgan Asset Management and IDFC internal analysis. INR performance has been derived from the USD returns. Fund performance is shown based on the NAV of the share class I in USD with
  income (gross of shareholder tax) reinvested including actual ongoing charges excluding any entry and exit fees. Figures greater than 1 year are annualised. The benchmark figures are net of 30%
  withholding tax. Past performance may or may not be sustained in the future.

                                                                                                           30
Sector breakdown Vs the benchmark of the Underlying Fund
           Portfolio repositioned towards cyclicals, beneficiaries of reopening of the economy

    Sector positions (%)

                        Portfolio Over/ (Under) Weight                                                                                            Portfolio Weight                Benchmark Weight

                                                                                       6.6                       Financials                                  8.8                              2.2

                                       0.7                                                                       Industrials                                 1.3                              0.6

                                   0.2                                                                          Health Care                                  8.3                              8.1

                       (0.1)                                                                                 Basic Materials                                 0.0                              0.1

                       (0.2)                                                                               Consumer Staples                                  2.3                              2.5

                      (0.3)                                                                                        Utilities                                 0.3                              0.6

                    (0.5)                                                                                          Energy                                    0.1                              0.6

            (1.5)                                                                                        Telecommunications                                 10.1                             11.6

           (1.6)                                                                                      Consumer Discretionary                                20.9                             22.5
           (1.6)                                                                                                Technology                                  48.0                             49.6
          (1.8)                                                                                                 Real Estate                                  0.0                              1.8

Source: Wilshire. The portfolio is actively managed. Holdings, sector weights, allocations and leverage, as applicable, are subject to change at the discretion of the investment manager without notice. As of September
2020, Russell Global Sectors (RGS) classification scheme has been decommissioned and has been replaced by the new Industry Classification Benchmark (ICB) classification. Data as on 30th Nov 2021.
                                                                                                                  31
Portfolio Details of the Underlying Fund
                    An active overweight in select ‘non-traditional’ stocks and an underweight in the recent winners

                                   Fund weight                                                            Fund               Relative
  Top 10 Holdings                                                                                                                                        Key Portfolio Statistics                    Fund             Benchmark
                                       (%)                                                              weight (%)          position (%)
        Microsoft                         9.0                              Advanced Micro

                                                          overweights1
                                                                                                              3.4                  2.5                   Weighted Average
                                                                           Devices                                                                                                                USD 850.0b          USD 986.1b
          Apple                           8.7                                                                                                            Market Cap

                                                             Top 5
                                                                           Blackstone Group                   2.9                  2.5
        Alphabet2                         7.4                                                                                                            Price / Earnings,
                                                                           Deere                              2.4                  2.0                                                               25.5x              27.4x
    Tesla Motors                          4.9                                                                                                            12-mth fwd3
                                                                           Morgan Stanley                     1.9                  1.9
    Amazon.com                            3.5                              Charles Schwab                     1.9                  1.9                   EPS Growth,
                                                                                                                                                                                                    15.0%               14.8%
   Advanced Micro                                                                                                                                        12-mth fwd
                                          3.4

                                                           underweights1
       Devices
                                                                           Amazon.com                         3.5                 -3.1
       NVIDIA                             3.3                                                                                                            Number of holdings                              69              496
                                                               Top 5
                                                                           Apple                              8.7                 -2.4
   Meta Platforms                         3.1                              Home Depot*                        0.0                 -1.8                   Weight in top 10 index
Blackstone Group                          2.9                                                                                                                                                         40%                50%
                                                                           Microsoft                          9.0                 -1.7                   holdings
           Deere                          2.4                              Visa*                              0.0                 -1.4
                                                                                                                                              Market Capitalisation (%)
Top Buys in 3Q 2021                                                        Top Sells in 3Q 2021
                                                                                                                                              78.8 83.1
Blackstone Group                                                                                                                                                                   Fund      Benchmark
                                                                           Microsoft
Advanced Micro Devices                                                     Alphabet                                                                                  21.3 14.7
                                                                                                                                                                                            0.0    2.2
Visa*                                                                      Zillow Group*
                                                                                                                                             > USD 50 bn           USD 10-50 bn           < USD 10 bn
        Source: Factset, Wilshire (excludes cash), J.P. Morgan Asset Management. 1. Relative to the Russell 1000 Growth Index. 2. Based on combining the positions of both Alphabet share classes (GOOGL and
        GOOG) which are listed in the Russell 1000 Growth Index. 3. excludes negatives *Indicates stock not held in the portfolio as of 30th Nov 2021. The portfolio is actively managed. Holdings, sector weights,
        allocations and leverage, as applicable, are subject to change at the discretion of the investment manager without notice.

                                                                                                                          32
The Underlying Fund has a tight-knit portfolio team focused on Large Cap Growth
     100+ years of combined experience

                                                                                      Giri Devulapally
                                                                                      Managing Director
                                                                                      Portfolio Manager
                                                                                      Experience: 30/18

        Joe Wilson                               Holly Fleiss                          Sarah Dodson                               Larry Lee                            Robert Maloney
    Managing Director                       Executive Director                                                               Managing Director                          Vice President
                                                                                      Executive Director
   Co-PM*/Technology                        Health Care Analyst                                                             Financials / Business                    Industrials, Energy &
                                                                                      Consumer Analyst
        Analyst                                    Health Care                              Consumer                          Services Analyst                         Materials Analyst
          Technology                             Experience: 17/9                        Experience: 12/4                   IT Services & Financial Svcs                     Industrials
        Experience: 16/7                                                                                                         Experience: 28/15                        Experience: 21/8

                            Also leverages the insights of the J.P. Morgan Equity organization, which includes
                                        over 40 research analysts in the U.S. and over 200 globally
As of 30th September 2021. Years of experience: Industry/Firm. *Back-up PM. There can be no assurance that professionals currently employed by JPMAM will continue to be employed by JPMAM or that
past performance or success of such professionals serve as an indicator of the professionals’ future performance or success.
                                                                                                       33
Investment in the FoF akin to any other Indian Mutual Fund

                                        Exit Load
           1% of applicable NAV - if the units are                                                                                           Investment Objective The Fund seeks to
redeemed/switched out within 1 year from the                                                                                                 generate long term capital appreciation by
                                date of allotment                                                                                            investing in units/shares of overseas Mutual
 Nil – if the units are redeemed / switched-out                                                                                              Fund Scheme (/s) / Exchange Traded Fund (/s)
          after 1 year from the date of allotment                                                                                            investing in US Equity securities.*

                                                                                                                                                       Subscription: Fresh Purchase (including switch-
                            Benchmark Russell                                                   Investment                                             in) - Rs.5,000/- and in multiples of Re. 1/-
                           1000 Growth Index^                                                    in the FoF                                            thereafter.
                                                                                                                                                       Additional Purchase (including switch-in) -
                                                                                                                                                       Rs.1,000/- and any amount thereafter

                            Maximum Total Expense                                                                                            Fund Manager
                            Ratio (including underlying                                                                                      Mr. Viraj Kulkarni – overseas investments
                            fund expense): 2.25%                                                                                             Mr. Harshal Joshi – domestic fixed income
                                                                                                                                             securities

          *However, there can be no assurance that the investment objective of the Scheme will be realized. ^Total Return Net of 30% withholding tax

                                                                                                              34
In Summary, 5 key reasons to choose the IDFC US Equity Fund of Fund

      1. Investment                                                                                   3. Reduced                                     5. Ease of
                                                   2. Portfolio                                                                4. Expertise
      Approach                                                                                        concentration                                  Investment

An actively managed                     The Underlying Fund                                 Broad exposure to              Seasoned, proven        Hassle-free
Underlying Fund with                     is Growth-oriented,                                US equity markets             fund management      investment process
   a well-tested,                       positioned to benefit                               without a sector/                 team of the        into US market;
   fundamental,                           from reopening of                                  market-cap bias,               Underlying Fund       subscribe and
  bottom-up stock                         the economy while                                  with currently a                with deep US     redeem like a regular
 selection process                           majorly being                                  lower exposure to                  expertise#      Indian mutual fund
                                        invested in long term                                  top 10 index
                                             secular trends                                    constituents

           #The IDFC US Equity Fund of Fund is open to invest in funds that meet the investment objective and strategy.

                                                                                                                     35
Annexure: Other details of IDFC US Equity Fund of Fund
Minimum Subscription / Redemption amounts:
Subscription: Fresh Purchase (including switch-in) - Rs.5,000/- and in multiples of                                                                       Indicative Allocation
                                                                                                                               Instruments
Re. 1/- thereafter                                                                                                                                        (as % of total assets) Risk Profile
Additional Purchase (including switch-in) - Rs.1,000/- and any amount thereafter
Redemption: Rs.1,000/- or the account balance of the investor, whichever is less.                                        Units/Shares of overseas
Redemption TAT: T+5 business days^                                                                                       Mutual Fund Scheme (/s) /
                                                                                                                         Exchange Traded Fund (/s)            95% - 100%          Very High
SIP: Rs.1,000/- and in multiples of Re.1 thereafter                                                                      investing in US Equity
STP (being Target Scheme): Rs.1,000/- and any amount thereafter (for Fixed                                               securities
amount option) / Rs.500/- and any amount thereafter (for capital appreciation
option)                                                                                                                  Debt Securities, Money
                                                                                                                         Market Instruments, and/or             0% - 5%            Low to
SWP: Rs. 200 and any amount thereafter                                                                                   units of Debt and Liquid                                  Medium
Maximum Total Expense Ratio (including underlying fund expense): 2.25%                                                   schemes

            Taxation
                                                                                                           Resident Investor                                  Mutual Fund
             Dividend*
             Tax on Dividend                                                                          As per respective slab rate or corporate tax rate             Nil
                                                                                                      applicable to the investor
             Capital Gains*
             Long Term (holding period more than 36 months)                                           20% with indexation                                           Nil
             Short Term (holding period up to 36 months)                                              As per respective slab rate or corporate tax rate             Nil
             applicable to the investor
            *plus applicable surcharge and Health & Education cess
            ^As per SEBI regulations, redemption has to be processed within 10 business days; TAT - Turn Around Time
Important Disclosure

                                                            This product is suitable for investors who are seeking*:
                                                            To create wealth over long term
                                                            Diversification of returns through investing in a fund mainly investing in units/shares of overseas Mutual Fund
                                                            Scheme (/s) / Exchange Traded Fund (/s) which invests in US Equity securities

                                                            *Investors should consult their financial advisers if in doubt about whether the product is suitable for them.

The identity of the issuer of the Promotion Material and the investment product which is the subject of the Promotion Material and the content of the Promotion Material has been verified by the issuer thereof;
The Promotion Material is not issued by J.P. Morgan Asset Management (Singapore) Limited (JPMAMSL), any of its Affiliates or a JPMorgan Fund and the Promotion Material does not relate to a direct investment
in any JPMorgan Fund; neither JPMAMSL, any of its Affiliates or a JPMorgan Fund has reviewed the contents of the Promotion Material and accordingly takes no responsibility for the accuracy of the contents of
the Promotion Material or any liability for any statement or misstatement in the Promotion Material; and an investor would be investing into an investment product which is established, offered and sold by the
Company or its Affiliates and would not be investing in any JPMorgan Fund, and accordingly there is no contractual relationship between the Investor and JPMAMSL, any of its Affiliates or a JPMorgan Fund.
Investors will bear the recurring expenses of the Scheme in addition to the expenses of the underlying schemes in which investments are made by the Scheme. IDFC US Equity Fund of Fund is not a dedicated
Feeder fund and investment in underlying fund will be undertaken subject to fulfilment of documentation and regulatory requirements applicable for investing in the underlying fund. The FoF performance is
subject to the movements of the underlying fund. IDFC AMC does not have an active role in managing the underlying fund. The IDFC US Equity Fund of Fund can invest only in similar mutual fund/s or exchange
traded fund/s with similar investment strategy, similar investment objective, similar asset allocation, similar benchmark.

MUTUAL FUND INVESTMENTS ARE SUBJECT TO MARKET RISKS, READ ALL SCHEME RELATED DOCUMENTS CAREFULLY.
The Disclosures of opinions/in house views/strategy incorporated herein is provided solely to enhance the transparency about the investment strategy / theme of the Scheme and should not be treated as
endorsement of the views / opinions or as an investment advice. This document should not be construed as a research report or a recommendation to buy or sell any security. This document has been prepared on
the basis of information, which is already available in publicly accessible media or developed through analysis of IDFC Mutual Fund. The information/ views / opinions provided is for informative purpose only and
may have ceased to be current by the time it may reach the recipient, which should be taken into account before interpreting this document. The recipient should note and understand that the information provided
above may not contain all the material aspects relevant for making an investment decision and the stocks may or may not continue to form part of the scheme’s portfolio in future. The decision of the Investment
Manager may not always be profitable; as such decisions are based on the prevailing market conditions and the understanding of the Investment Manager. Actual market movements may vary from the anticipated
trends. This information is subject to change without any prior notice. The Company reserves the right to make modifications and alterations to this statement as may be required from time to time. Neither IDFC
Mutual Fund / IDFC AMC Trustee Co. Ltd./ IDFC Asset Management Co. Ltd nor IDFC, its Directors or representatives shall be liable for any damages whether direct or indirect, incidental, punitive special or
consequential including lost revenue or lost profits that may arise from or in connection with the use of the information.

                                                                                                              37
Thank You
    IDFC Asset Management Company
       One World Centre, 6th Floor,
       841 Jupiter Mills Compound,
Elphinstone Road (West), Mumbai 400013,
            Maharashtra, India

           www.idfcamc.com
           www.idfcmf.com
            www.idfc.com
You can also read